Key facts today
Next report date
—
Report period
—
EPS estimate
—
Revenue estimate
—
−1.851 CHF
−232.13 M CHF
399.72 M CHF
130.85 M
About 3D Systems Corporation
Sector
Industry
CEO
Jeffrey A. Graves
Website
Headquarters
Rock Hill
Founded
1986
FIGI
BBG007FJP669
3D Systems Corp. is a holding company, which engages in the provision of comprehensive three-dimensional printing solutions. It offers a comprehensive range of 3D printers, materials, software, haptic design tools, 3D scanners, and virtual surgical simulators. The company was founded by Charles W. Hull in 1986 and is headquartered in Rock Hill, SC.
Related stocks

DDD (NYSE) - 30-Min Chart Long Trade Setup! 🚀
🔍 Stock: DDD (NYSE)
⏳ Timeframe: 30-Min Chart
📈 Setup Type: Bullish Breakout
📍 Trade Plan:
✅ Entry Zone: Above $4.60 - $4.70 (Breakout Confirmation)
🚀 Take Profit 1 (TP1): $4.86 (First Resistance)
🚀 Take Profit 2 (TP2): $5.24 (Extended Bullish Target)
🔻 Stop-Loss (SL): Below $4.33 (Key Support)

DDD (NYSE) - 30-Min Chart Long Trade Setup! 🚀
🔍 Stock: DDD (NYSE)
⏳ Timeframe: 30-Min Chart
📈 Setup Type: Bullish Breakout
📍 Trade Plan:
✅ Entry Zone: Above $4.80 - $4.85 (Breakout Confirmation)
🚀 Take Profit 1 (TP1): $4.99 (First Resistance)
🚀 Take Profit 2 (TP2): $5.35 (Extended Bullish Target)
🔻 Stop-Loss (SL): Below $4.44 (Key Support)

3D Systems Corporation (DDD): Redefining 3D Printing3D Systems Corporation (DDD) is a pioneer in the world of 3D printing, offering advanced solutions for industries like healthcare, aerospace, automotive, and manufacturing. The company specializes in creating 3D printers, materials, and software that help businesses design and produce high-quality p
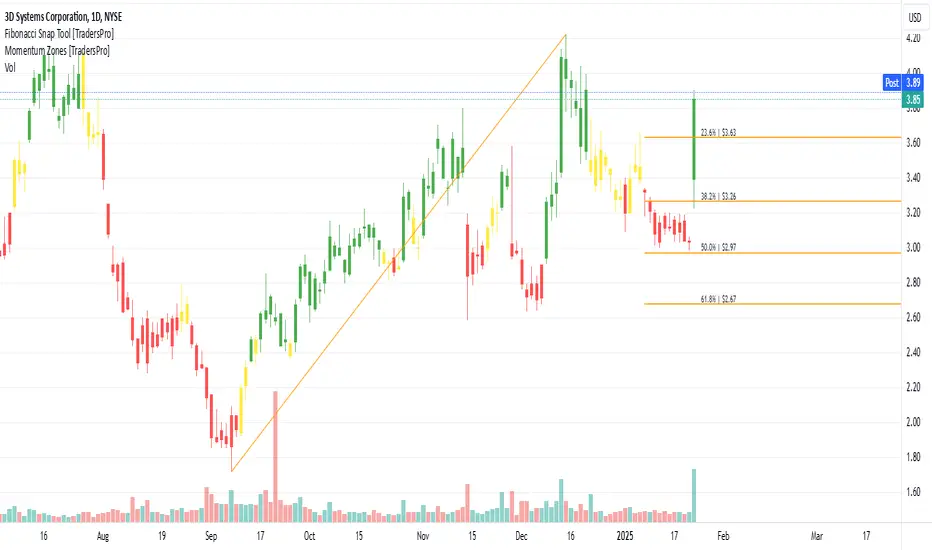
DDD: Breakout from Descending Triangle on 30-Min Chart!Trade Setup for DDD:
Entry:
Enter a long position at $3.56 (current price or confirmed breakout above the trendline).
Stop Loss (SL):
Place your stop loss below the recent support level at $3.45.
Take Profit Targets (T1, T2):
Target 1 (T1): $3.68 (immediate resistance level).
Target 2 (T2): $3.84

DDD Bullish Breakout: Targeting $4.70 with Strong Momentum!DDD is showing strong bullish momentum, breaking out of key resistance levels. Entry is at $4.05 with a stop loss at $3.86. Targeting multiple profit zones:
Target 1: $4.29
Target 2: $4.48
Target 3: $4.70
This setup offers an excellent risk-reward ratio, supported by higher highs and strong volume.

"Short" DDD-overbought and at downtrend resistanceAgain, I'm not one to short stocks, but if I was, I would if I could do it at this level (between 3.97 and 4.01).
It's both overbought at 3.97 and RIGHT up against down trend resistance, plus it's been up 6 of the last 7 days. I think it's due for a breather and the technicals and candles say he

Good time to bounce backI think DDD finally reached medium term bottom and will comeback to gain ~80%.
Not a financial advice.

DDD RiskyStudying the chart the trend is still down.
Possible support at $5.
I will go long now. But only a 1% of Capital Investment.
Obviously these risk / rewards can go both directions, however if correctly timed - the gains % are great.
So I am taking this trade long as its way oversold right now.
I am w


See all ideas
Summarizing what the indicators are suggesting.
Neutral
SellBuy
Strong sellStrong buy
Strong sellSellNeutralBuyStrong buy
Neutral
SellBuy
Strong sellStrong buy
Strong sellSellNeutralBuyStrong buy
Neutral
SellBuy
Strong sellStrong buy
Strong sellSellNeutralBuyStrong buy
An aggregate view of professional's ratings.
Neutral
SellBuy
Strong sellStrong buy
Strong sellSellNeutralBuyStrong buy
Neutral
SellBuy
Strong sellStrong buy
Strong sellSellNeutralBuyStrong buy
Neutral
SellBuy
Strong sellStrong buy
Strong sellSellNeutralBuyStrong buy
Displays a symbol's price movements over previous years to identify recurring trends.
Frequently Asked Questions
The current price of SYV is 1.418 CHF — it has increased by 2.98% in the past 24 hours. Watch 3D SYSTEMS CORP stock price performance more closely on the chart.
Depending on the exchange, the stock ticker may vary. For instance, on BX exchange 3D SYSTEMS CORP stocks are traded under the ticker SYV.
We've gathered analysts' opinions on 3D SYSTEMS CORP future price: according to them, SYV price has a max estimate of 3.36 CHF and a min estimate of 1.68 CHF. Watch SYV chart and read a more detailed 3D SYSTEMS CORP stock forecast: see what analysts think of 3D SYSTEMS CORP and suggest that you do with its stocks.
SYV stock is 2.93% volatile and has beta coefficient of 1.66. Track 3D SYSTEMS CORP stock price on the chart and check out the list of the most volatile stocks — is 3D SYSTEMS CORP there?
Today 3D SYSTEMS CORP has the market capitalization of 195.73 M, it has increased by 7.51% over the last week.
Yes, you can track 3D SYSTEMS CORP financials in yearly and quarterly reports right on TradingView.
3D SYSTEMS CORP is going to release the next earnings report on Aug 6, 2025. Keep track of upcoming events with our Earnings Calendar.
SYV earnings for the last quarter are −0.19 CHF per share, whereas the estimation was −0.13 CHF resulting in a −44.83% surprise. The estimated earnings for the next quarter are −0.12 CHF per share. See more details about 3D SYSTEMS CORP earnings.
3D SYSTEMS CORP revenue for the last quarter amounts to 83.69 M CHF, despite the estimated figure of 88.09 M CHF. In the next quarter, revenue is expected to reach 75.95 M CHF.
SYV net income for the last quarter is −32.74 M CHF, while the quarter before that showed −30.61 M CHF of net income which accounts for −6.95% change. Track more 3D SYSTEMS CORP financial stats to get the full picture.
No, SYV doesn't pay any dividends to its shareholders. But don't worry, we've prepared a list of high-dividend stocks for you.
As of Jul 27, 2025, the company has 1.83 K employees. See our rating of the largest employees — is 3D SYSTEMS CORP on this list?
EBITDA measures a company's operating performance, its growth signifies an improvement in the efficiency of a company. 3D SYSTEMS CORP EBITDA is −84.51 M CHF, and current EBITDA margin is −22.32%. See more stats in 3D SYSTEMS CORP financial statements.
Like other stocks, SYV shares are traded on stock exchanges, e.g. Nasdaq, Nyse, Euronext, and the easiest way to buy them is through an online stock broker. To do this, you need to open an account and follow a broker's procedures, then start trading. You can trade 3D SYSTEMS CORP stock right from TradingView charts — choose your broker and connect to your account.
Investing in stocks requires a comprehensive research: you should carefully study all the available data, e.g. company's financials, related news, and its technical analysis. So 3D SYSTEMS CORP technincal analysis shows the buy rating today, and its 1 week rating is buy. Since market conditions are prone to changes, it's worth looking a bit further into the future — according to the 1 month rating 3D SYSTEMS CORP stock shows the buy signal. See more of 3D SYSTEMS CORP technicals for a more comprehensive analysis.
If you're still not sure, try looking for inspiration in our curated watchlists.
If you're still not sure, try looking for inspiration in our curated watchlists.