TSLA looking for rejection around 200HMASo, I've been bearish on TSLA around that $400 mark and was waiting for more PA to evolve before calling the shots. It broke down. Quite rapidly actually. Currently looking to see what happens when price floats around that 200HMA in red. Also looking at weekly RSI that broke down the centre of the channel. If RSI on weekly cannot reclaim above centra at 50 and price has a hard time returning above 200HMA, I'll be looking for another leg down on HTF. I'm looking at weekly timeframe here so be mindful about that. I'm fluid. For me, price doesn't have to get a clean rejection for me to make up my mind. Although, that would make life easier, I'll also look at how price behaves around a certain price level. What I mean by that is: I don't care whether the price will go higher than that 200HMA in daily candles. I care about weekly closes and formations around that area.
TL0 trade ideas

TSLA Shorts, Done in 15 minPDH taken, CISD, H1 IFVG, MMSM forming with draw on PDL but with RB right above profit target needed to be adjusted. The price kept creating bearish pd arrays showing hand that the draw was lower and entry was after H1 BISI was inverted and entered on retracement with partials along the way. I'll try to label my charts post trade.

Tesla stock has completed 5 downward waves.Tesla stock has completed 5 downward waves
Currently, market sentiment is highly negative. A correction to the $296-$326 area, which corresponds to 38.20 and 50% Fibonacci levels, seems likely. They have also covered the gap from below.
After Tesla stock's correction, I expect a global collapse of the SP500, the US stock market, and the cryptocurrency market.
You can review ideas for Bitcoin, Ethereum, Solana, SPY/SP500:
-----
SP500/SPY:
Today:
-----
Bitcoin:
-----
Ethereum:
-----
Solana:

Tesla Update 2 Plan the trade and be PreparedUpdate on the Monthly chart with revised level which is worth noting on your charts and being prepared for . Enjoy the update and thanks for watching

Tesla Update 3 Whats Next after Target Long Hit Quick recap of the previous level I gave for tesla which is now + 35% off of that level . In this video I use fibs and channels + gann box .
Show your support for continued analysis with a boost and feel free to ask any questions

How far will $TSLA go?How far will NASDAQ:TSLA go?
Elon is rolling into the Golden Age with robotaxi’s, A.I. and humanoid robotics.
Some baseline technical analysis. Pitchfork projected from the 2019 impulse waves. Price has touched the median line twice and the bottom of Fibonacci fork thrice. Setting up a possible three drives waves pattern.
Break $600 on this run up and we’ll see $1,000-$1,700 quickly to reach the top of the pitchfork completing the impulse waves. This puts Tesla at a marketcap of $5.47T

MASSIVE $TESLA SHORT:
🚨 NASDAQ:TSLA - MASSIVE SHORT INCOMING? 🚨
Weekly Bearish Divergence Alert 🔻
Tesla is flashing major warning signs on the weekly chart. While price has pushed higher recently, momentum is doing the opposite — bearish divergence on the RSI/MACD is undeniable.
📉 Price Action:
TSLA is struggling to reclaim key resistance near $200–$210. The recent rally looks exhausted, with buyers losing strength.
📊 Technical Breakdown:
RSI Divergence: Price made a higher high, but RSI made a lower high = bearish divergence
MACD Histogram Weakening: Bullish momentum is fading fast
Volume: Declining on green days, heavier on red = distribution underway
⚠️ Macro Headwinds
EV competition is surging
Elon selling shares = supply pressure
Market rotation into value, not growth
🎯 Trade Setup (Not Financial Advice):
Entry: $195–$205 zone
Stop: Close above $215
Targets: $180, $160, then $130 for the brave
This is a textbook swing short opportunity with a favourable risk/reward ratio. Smart money could be unloading here — don’t get caught long at the top.
📅 Watch for confirmation on this week’s close. If the divergence plays out, this could be a multi-week dump.
#TSLA #Short #BearishDivergence #SwingTrade #Options #TeslaCrash #TradeView

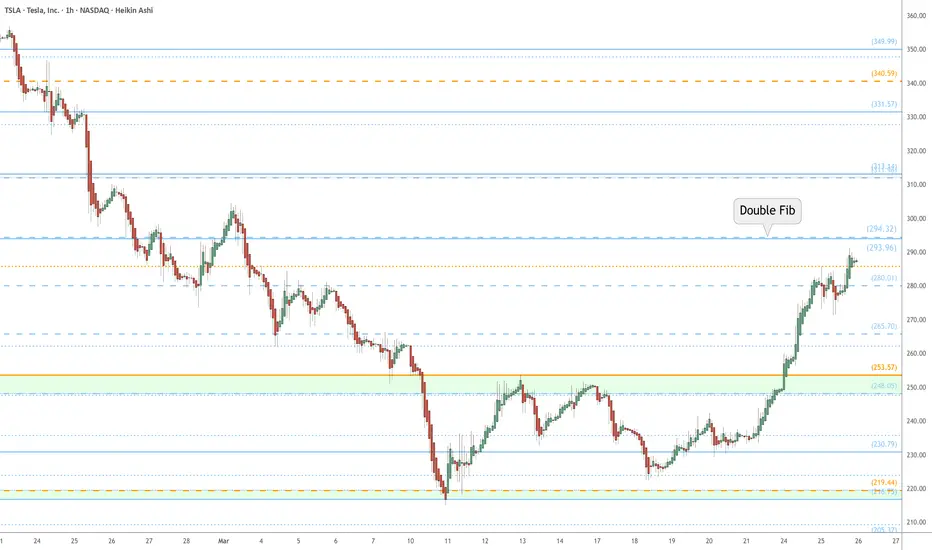
TSLA watch $294: Double Fib hurdle to bounce from Golden GenesisTSLA finally got past our Golden Genesis fib at $253.
Strong bounce cut through several Covid fibs (dashed).
Watch tight confluence of Covid+Genesis around at $294.
$ 293.96 - 294.32 is the exact zone of concern for bulls.
==================================================
.
Tesla (TSLA) – Daily Chart AnalysisTechnical Landscape
Immediate Resistance:
Gap / Low Volume Zone: $288.14 – $338.79
0.236 Fibonacci retracement at ~$338.79
Major Resistance Above:
50% Retracement: ~$356.15
0.618 Fibonacci: ~$418.66
Key Support Levels:
$246.45 (recent structural low)
$220.48
$196.51
$180.80
Momentum Indicators
RSI
Currently rising and reclaiming the 50.00 level, a significant threshold.
Momentum profile closely mirrors the November 2024 recovery (highlighted with circle).
Prior surges from similar RSI+ structures led to multi-week uptrends.
Trend
Bullish crossover confirmed with expanding green histogram.
Momentum is accelerating out of a deeply oversold condition—similar to the late 2024 rally initiation.
Signal line separation is clear, suggesting short-term strength remains intact.
On Balance Volume
Just printed its first strong upturn in over two months.
The curve has transitioned from flat to rising, forming a mirror image of the reversal seen in November 2024.
While early, the formation suggests underlying accumulation and rotation back into strength.
Scenarios Based on Current Structure
Scenario 1: Bullish Continuation Through Gap Zone
Trigger: Break and hold above ~$288.14 (gap entry) with increasing volume and confirmation from RSI+ and WaveTrend.
Structure: Price accelerates into low-volume gap region, seeking fill up to ~$338.79.
Target 1: $338.79 (0.236 Fib)
Target 2: $356.15 (50% retracement)
Target 3: $418.66 (0.618 retracement)
Momentum Bias: All three indicators currently favor bullish continuation.
Scenario 2: Short-Term Rejection at Gap Resistance
Trigger: Price rejects within $288–$300 and fails to sustain above the low-volume node.
Price Response: Retests structural support near $246.45 or deeper at $220.48.
Setup: Look for RSI+ to lose the 50 level and WaveTrend to flatten or recross down.
Bias: Short-term corrective move, but still within a broader base-building structure.
Scenario 3: Breakdown Back Into Range
Trigger: A sharp reversal with high-volume rejection from the current rally leg, especially without full gap fill.
Confirmation: Indicators roll over—WaveTrend flips negative, Volume Buoyancy breaks down.
Target: $220.48 initially, then $196.51 and potentially $180.80 if broader market weakens.
Implication: Reclassifies price action as a failed relief rally, resuming prior downtrend.
Summary
Tesla is in the early stages of a potential trend reversal. The alignment of RSI+, WaveTrend 3D, and Volume Buoyancy with prior bottoming conditions suggests further upside is likely if the stock clears the low-volume region starting at ~$288. That said, this is a structurally thin area, and rejection within the gap could send price back to major support zones.
Volume will be key in validating breakout attempts. Should momentum fade and structural levels fail, the broader downtrend may reassert itself.

TESLA Market Outlook: Strong Reversal Expected at $200 SupportNASDAQ:TSLA is currently trading within a well-defined ascending channel , a structure that has guided price action since 2020. This channel reflects the broader bullish trend, with higher highs and higher lows consistently forming over the years. The recent sharp decline from the upper boundary of the channel is best interpreted as a temporary retracement rather than a structural shift. Such pullbacks have presented strong buying opportunities before, particularly when price approaches key support levels within the channel. The key area to watch is the $200 demand zone. This level coincides with the lower boundary of the ascending channel and has before drawn significant buying interest.
Given the broader bullish structure, a reversal from this zone could reestablish the uptrend and lead to a retest of higher levels. If a bounce occurs at the $200 demand zone, the immediate target is $263, which aligns with a key resistance level where prior rejection occurred. This area represents a logical point to watch for, but a successful breakout above $263 could lead to further move toward the upper boundary of the channel.
Fundamental Outlook:
From a fundamental perspective, the recent decline could be due to Tesla facing a unique set of challenges stemming from Elon Musk’s increasing involvement in the U.S. government. His role in the Department of Government Efficiency (DOGE) under the Trump administration has triggered mixed reactions across the financial landscape. The DOGE program, aimed at cutting bureaucratic waste and enhancing operational efficiency, has led to concerns about Musk’s ability to maintain focus on Tesla. Some investors do worry that his attention, divided among a few ventures such as Tesla, SpaceX, and also the federal program, might slow the company’s innovation pipeline in addition to running efficiency.
People are quite divided in their opinions. While some view Musk’s governmental involvement as a strategic advantage, believing his influence could drive favorable policy outcomes, others see it as a distraction that threatens Tesla’s future success. Additionally, if the DOGE program prompts budgetary austerity measures, there could be cuts to clean energy incentives, an outcome that would directly impact Tesla’s profits directly.
Despite these concerns, the market’s long-term outlook for Tesla remains bullish. Many investors view any significant retracement as a buying opportunity, particularly near major technical support zones like $200. This area is widely recognized as a strong accumulation zone where institutional buyers are likely to step in. Furthermore, the electric vehicle market continues to expand globally, and Tesla’s brand strength and technological lead remain intact, reinforcing the long-term growth narrative.
Market View & Predictions
While short-term volatility is expected due to ongoing uncertainties surrounding Musk’s government involvement, the broader technical structure suggests that the uptrend is still intact.
The recent pullback from the upper channel boundary appears to be a healthy correction rather than a trend reversal. If the price tests the $200 support zone, it could trigger a new wave of buying pressure, potentially driving the stock back toward the $263 resistance and beyond. As long as the price remains within the ascending channel, the bullish case for Tesla remains valid, with the potential for further upside as market confidence stabilizes.

Tesla Could Continue to DropTesla Inc. (TSLA) Elliott wave count implies more downside action.
Daily Stochastic is overbought and implies Minor wave"4" could be complete.
TSLA could make a significant bottom in the 150 to 175 area.

TSLA volume profile tells a storyTesla is heading to 320 to be shorted again
During its climb to 485 TSLA had hardly any volume bove 285, but on the fall side it had significant volume, indicating short sellers were the net cause of volume. The same are taking profits now causing sharp rise. There is volume imbalance at around 320, also the middle line of hilo ema (200 days) which is powerful attracter of prices

Tesla PushI see a valid break and retest forming with nice volume
the trade is simple
Im buying the retest of the break and im taking my trade to the breakout high
most likely im going to get 50% of the move back to the high either way im going to make cash

SeekingPips sees TSLS Tesla GAIN $60 ! What's Next?It's hard for many traders to do. 🤔
⭐️ I still see it today with traders and investors alike. Even with some who have been at it for many years...
BUT some of the BEST ENTRIES & EXITS for me have been when the OPEN CANDLE IS COMPLETELY AGAINST ME.
The LAST WEEKLY TESLA chart that I shared is another prime example of this.
🟢SeekingPips🟢 shared a BULLISH BIAS when the WEEKLY CHART was looking as BEARISH as hell. 🔥
ℹ️ Now it really is not a method that works for everyone.
Trading against momentum always looks SCARY BUT the SECRET is MULTI TIMEFRAME ANALYSIS and also being able to...
VISUALISE DIFFERENT OBSCURE TIMEFRAMES IN REAL-TIME USING THE CURRENT OPEN CHART.
⚠️I plan on going DEEPER INTO this rabbit hole with some information and examples in the TUTORIAL SECTIONS soon.⚠️
🚥 In it's simplest terms an example would be beaing able to note where price is on a 20 or 10 min chart just only by having a 5 minute chart in front of you.
By being able to do so in REAL-TIME KEY LEVELS POP OUT that you may not have noticed from the 5 minute chart perspective only.💡💡💡
Now 🟢SeekingPips🟢 has to wait for a TRIGGER for a NEW ENTRY & SO SHOULD YOU.👍👌👍


TSLA LEVELS ENDING MARCHPreviosuly drawn out fib
Levels are ehhhh.
TSLA down w news as well.
Personally think long term value is strong and they will be leaders in the EV/ automated driving sector.
Still want to have in portfolio... but dont know if right now its too hot to even touch?
if so
focus on another EV to add to portfolio for autonomous driving etc? or just stay course w Tesla and buy @ major dips like now?

TSLA bounce baby tgt $264Well, that was quite a trip on TSLA, my lord!
My target at $242 from the last idea (TSLA big short) was blown, & I forgot I had a lower zone given from a reading (I'm a dowser) I did on 2/20 this year. I drew the range back then & suddenly price came into this huge drawing I had forgot I put on my chart. Maybe I mentioned it in the last idea, actually, but I'd have to check.
Regardless the way I get zones sometimes is I'm given a date. In this case the date was all the way back to 1/16/24. That day price was from $212-$223, so I just draw the zone & see what happens. When I asked at the time (2/20) the guidance is that TSLA would revisit those prices.
This is a long winded explanation of how I get info sometimes, and also why I think we bounce from here... besides the fact it's "due", right?!
My work in indexes was pretty super with a new breakthrough on predicting the time it will take to hit targets, which is amazing, and I'm not even going to be shy about it. We're in that time window with targets hit on indexes & dowsing repeating there's bullish energy.
Target on TSLA is $264 by the 24th of this month. Coincidentally, I have long indexes to the 25th. This is super experimental work, so let's just see what happens because I've had really good calls & then next time is horrible. Keeps me humble LOL. Go TSLA!

TSLA big short??? Tgt $242Alrighty, I've been creating a nice little track record with TSLA since just before earnings, and when I asked about it today, some different kind of energy or information came in.
I get my information from dowsing with a pendulum. You really won't find technicals at all with my work, so if you'd like a new or different perspective from the esoteric "woowoo" realm, I'm it. If you know any others who do this kind of thing and post about it, please lmk who they are.
So into tomorrow (Friday) should be pretty bullish on TSLA, however, my dowsing has pushed me about getting dates. When I did this, I noticed both dates (10/12/24 & 2/2/25) have large gaps down around that time frame. I also get that there's some kind of news - maybe this Saturday. Might Elon be too busy for TSLA??? Idk & didn't ask because I don't care. I only care what the stock is going to do & this took me a long time to do, so the fewer the questions, the better. The repeating "energy" is multi day downtrend and breakdown.
When I asked about a target I have a couple things... one thing came as a date, 1/15/2024 & suggested it revisits the price. I have seen this work in the past, so maybe. It also would clean up many gaps. That price range was $212-223 & is right in a consolidation zone.
My dowsing keeps giving me something with 42 though. This could be 42% from the next swing high, which if it makes it to $377 would take it to around $218. I let dowsing choose between the price 218 & 242 & it likes 242. Anyway, my lower targets are often blown (see last TSLA idea), but when you've already made so many points, is it a big deal??
It usually just indicates a warning zone for a reversal.
When I ask how many weeks to hit, I get 10 weeks. When I ask what month, I get May. When I ask what's most important to tell you guys, it says "a big high is coming".
We'll see. This'll be interesting!

HAMMER (Bullish Pattern) FormationWeekly Chart- It looks like a "HAMMER" (Bullish Formation) has formed in the last week. This Hammer has "sat" on a good support area and its "Head" is above the 200MA. A strong bounce is possible during the next 3 weeks. The yellow arrows show the behavior of Tesla stocks every time a "Hammer" has formed.

Tesla Financials: Q1 2025The market is currently staging a short-term rally - essentially a speculative mean reversion bounce as a reaction to -55% crash from all-time high. This move appears driven largely by retail traders seizing what it perceives as a rare opportunity to accumulate an oversold "large-caps".
While retail participation and opportunistic capital are supporting the current bounce, this alone is insufficient to sustain a full recovery. As the price approaches higher levels, particularly near key supply zones, it will likely encounter significant resistance, resulting in reversal.
Let's not forget the fact that figures in Tesla’s Q4 '24 financial report initiated bearish sentiment among institutional investors which resulted in market crash. Similarly, the upcoming Q1 earnings report presents a clear downside risk, as the significant events throughout this quarter will inevitably be reflected in the financial figures!
Anticipated impact of significant developments on Tesla’s Q1 2025 Financial Statements
🛑 Revenue Decline
• U.S. Market Weakness: Lower-than-anticipated vehicle sales in the U.S. directly reduce automotive revenue.
• Severe European Slump: A significant 76% sales decline in Germany and weakness elsewhere in Europe will notably reduce international revenues.
• Chinese Market Challenges: A substantial 49% sales drop in China will negatively affect one of Tesla’s crucial growth markets.
• Cybertruck Weakness and Recalls: Reduced demand and multiple recalls of Cybertruck models further erode revenue growth.
• Resale Value Decline and Trade-Ins: Increased vehicle trade-ins indicate lower demand, causing inventory buildup, discounting pressures, and further sales reductions.
🛑 Gross Margin Erosion
• Price Reductions and Sales Incentives: Competitive pressures and lower demand likely forced Tesla to reduce vehicle prices and offer incentives, compressing gross margins.
• Increased Competition from BYD: BYD’s advanced battery technology (providing 400 km of range in just 5 minutes of charging) pressures Tesla to increase R&D spending or cut prices further, negatively affecting margins.
• Production Challenges (Supply Chain and Battery Issues): Ongoing global supply chain disruptions and difficulties scaling battery production significantly increase manufacturing costs, further squeezing gross margins.
🛑 Increased Operating Expenses
• Recall Costs and Legal Expenses: Vehicle recalls, along with lawsuits related to product issues such as phantom braking, will significantly increase warranty provisions, legal fees, and related operating expenses.
• Protests and Vandalism Costs: Public backlash and vandalism necessitate additional expenditures on security, facility repairs, and public relations initiatives.
• Employee Turnover Costs: Departures of key personnel result in increased recruiting, training, onboarding, and severance expenses.
🛑 Net Income and EPS Impact
• Analyst Earnings Downgrades: Already-reduced EPS projections by major analysts suggest Tesla will likely report earnings below expectations, reflecting revenue shortfalls and elevated expenses.
• $1.4 Billion Financial Discrepancy: If confirmed or unresolved, this discrepancy could lead to substantial asset impairments, restatements, or write-downs, negatively impacting net income and earnings per share (EPS).
🛑 Cash Flow and Liquidity Pressures
• Lower Operating Cash Flows: Reduced revenue coupled with rising operating costs (including recalls, lawsuits, security, and PR spending) severely diminish cash generated from business operations.
• Increased Capital Expenditures: Additional CapEx is likely required to address battery production bottlenecks and delays in autonomous driving technology development, resulting in elevated investing cash outflows.
• Investor Divestment and Stock Volatility: Negative investor sentiment could lead to costly equity financing conditions if Tesla needs to raise capital, adversely affecting financing cash flows and liquidity.
🛑 Balance Sheet Risks
• Rising Inventory Levels: Weak sales combined with continued vehicle production may lead to increased inventory levels, reducing cash and potentially requiring markdowns or provisions.
• Debt and Liquidity Challenges: Deteriorating credit metrics or covenant breaches could make refinancing existing debt more expensive or complicated, negatively impacting Tesla’s financial stability.

Tesla on the Path to New Highs: Correction Before a Major high?hello guys.
let's have a comprehensive analysis of Tesla
__________________________
Technical Analysis
Price Structure & Trend:
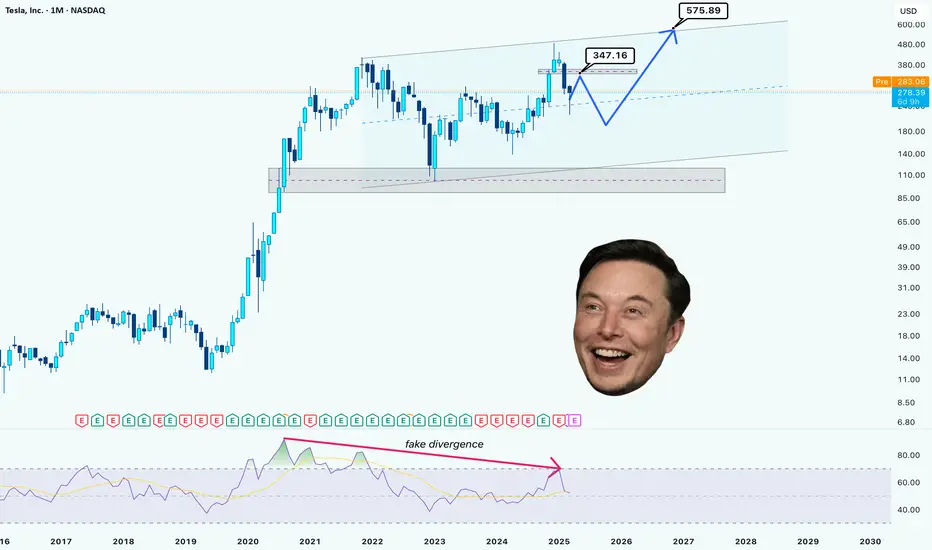
The monthly chart indicates a long-term uptrend within a broad ascending channel.
Tesla has recently faced resistance around $300 and is now in a corrective phase.
The expected correction may bring the price down to around $220-$250, where it could find strong support before continuing its bullish move. or it is possible to start an upward movement and form an ATH!
RSI & Divergence:
The RSI indicator previously showed a fake bearish divergence, meaning the price action remains strong despite earlier weakness signals.
Potential Higher Levels
If Tesla successfully follows the projected movement, a break above $575 could open the door to $700-$750, based on the channel extension and historical breakout patterns.
__________________________
Fundamental Analysis
Earnings & Growth:
Tesla's revenue growth remains strong despite market headwinds.
New factory expansions (Giga Texas, Giga Berlin) and production efficiency improvements contribute to long-term profitability.
The Cybertruck ramp-up and expansion in AI-driven automation could drive future stock value.
EV Market Outlook:
Tesla maintains a dominant position, but increasing competition from Chinese EV manufacturers and legacy automakers remains a challenge.
Recent price cuts have impacted margins but helped sustain high sales volume.
Macroeconomic Factors:
Interest rate decisions by the Federal Reserve could impact growth stocks like Tesla.
If rates stabilize or decrease in 2025, Tesla could see renewed investor interest, pushing the stock to new highs.
_________________________
Conclusion
The mid-term bearish retracement toward $250 aligns with healthy correction levels.
If Tesla holds above support and breaks $350, your $575 target is highly probable.
A break above $575 could lead to $700+ in the longer term, assuming positive earnings growth and stable macroeconomic conditions.
Tesla's 12% Rally Faces Major Test 🧭 After a brutal 55% sell-off, Tesla bounces sharply—but reputational damage, six-quarter earnings misses, and resistance at $284 may limit the upside.
📌 Tesla Bounces After 55% Decline, But Can It Last?
Tesla shares have staged an impressive 17% rebound over the past two sessions, closing near $282 after briefly dipping below long-term support at $221—a level identified in previous technical analysis. The rally follows a brutal 55% drawdown over two months, driven by fundamental concerns and investor disillusionment with Tesla's leadership and financial trajectory.
While the bounce has sparked hopes of a full recovery, many investors are asking: Is this rally sustainable, or simply a technical reaction to an oversold market?
🔍 What's Behind the Decline? Sales, Sentiment, and Musk
Tesla Inc. was once the undisputed leader of the electric vehicle movement—praised for innovation, margins, and cult-like investor loyalty. However, that sentiment has deteriorated rapidly, driven by a combination of brand erosion, global consumer backlash, and CEO Elon Musk's growing political entanglements.
Recent data shows Tesla vehicle sales in the European Union dropped for the second consecutive month in February, despite increased overall EV adoption among rival automakers. This suggests that brand damage is not just a PR issue—it's hitting demand directly.
The drop coincides with widespread boycotts and protests against Tesla vehicles across regions like Germany, France, and the Netherlands, where public trust in Musk's leadership has sharply declined.
Elon Musk's involvement in U.S. government affairs—ranging from infrastructure to national security—has further blurred the line between corporate leadership and personal politics. While his goals align with long-term technological influence, his increasingly controversial social presence and political commentary have invited scrutiny from both investors and customers alike.
📉 Fundamentals Still Struggling: Six Quarters of Mixed Results
Adding to investor anxiety is Tesla's shaky earnings record. Over the past six quarters, the company has missed revenue expectations in five, with growing signs of delivery pressure and margin compression.
QuarterReported RevenueEstimateSurprise (%)
Sep 2023 $23.35B $24.19B –3.46%
Dec 2023 $25.17B $25.60B –1.67%
Mar 2024 $21.30B $22.22B –4.14%
Jun 2024 $25.50B $24.52B +3.99%
Sep 2024 $25.18B $25.47B –1.12%
Dec 2024 $25.71B $27.26B –5.69%
The most recent miss—a $1.55B revenue gap in Q4 2024—was the largest in over a year, reinforcing fears that Tesla's dominance in the EV market is eroding faster than expected.
📊 Technical Outlook: Bounce or Bull Trap?
Tesla's rally is now facing a critical test. After bouncing from $221, the stock surged through a long-term resistance zone between $244–$263, flipping that region into support. The breakout was accompanied by a notable increase in trading volume, a bullish sign for short-term momentum.
However, several key resistance levels lie directly ahead:
$275.70 – Initial resistance zone; currently being tested
$284.00 – Next level tied to a major supply area
$306.00 and $325.00 – Historical congestion zones
$356.00 and $387.00 – Longer-term recovery targets if momentum continues
If Tesla fails to break and hold above $284, it could fall back into the previous range. The $263–$244 support zone will be critical in cushioning any pullback. A loss of this support could open the door to a retest of $221 or lower.
↺ Scenarios to Watch: Rebound or Reversal?
📉 Bearish Scenario:
Price fails to hold above $275.70
Pullback toward $263, then $244
Breakdown below $244 could retest $221 and resume a broader downtrend
📈 Bullish Scenario:
A clean break above $284 with volume
Continuation toward $306 → $325
Sustained momentum opens the path to $356 and $387
⚠️ Final Thoughts: Brand Damage vs. Technical Rebound
Tesla's rebound is undeniably impressive—but investors should remain cautious. While technicals suggest a short-term recovery is underway, the underlying fundamentals and sentiment remain damaged. Unless Tesla can stabilize earnings, rebuild global brand trust, and separate leadership from political theatrics, this bounce may prove to be temporary relief rather than a long-term trend reversal.
The $284 resistance zone is now the key battleground. A failure to break above may confirm that Tesla's best days are still behind it—for now.

$TSLA Poised For Higher Near-Term NASDAQ:TSLA - The rebound from the lows remains corrective thus far. A potential Double Zigzag within a larger downtrend.
