TSM bull flag with buffet and AAPL news behind it. TSM making a nice bull flag with buffet stake and AAPL saying they will buy chips from arizona. good news behind it too and foundries have been looking strong in last month or so compared to other chip making companies.
looking at 84C fro DEC 2 on this flag intraday. over 83 can rip to 88
TSM trade ideas


TSM makes (W)MA200 retestTSM makes huge almost 40% rally to retest (W)MA200 after a break. Usually biggest plunge happens after (W)MA200 retest - after a long break which has happened? It rallied towards (W)MA200 exactly after exposing Buffett's news.

TSM | Loving this Pattern | Short TermTaiwan Semiconductor Manufacturing Company Limited manufactures, packages, tests, and sells integrated circuits and other semiconductor devices in Taiwan, China, Europe, the Middle East, Africa, Japan, the United States, and internationally. It provides complementary metal oxide silicon wafer fabrication processes to manufacture logic, mixed-signal, radio frequency, and embedded memory semiconductors. The company also offers customer support, account management, and engineering services, as well as manufactures masks. Its products are used in mobile devices, high performance computing, automotive electronics, and internet of things markets. The company was incorporated in 1987 and is headquartered in Hsinchu City, Taiwan.
TSM | Very Overbought Buffett Pick | SHORTTaiwan Semiconductor Manufacturing Company Limited manufactures, packages, tests, and sells integrated circuits and other semiconductor devices in Taiwan, China, Europe, the Middle East, Africa, Japan, the United States, and internationally. It provides complementary metal oxide silicon wafer fabrication processes to manufacture logic, mixed-signal, radio frequency, and embedded memory semiconductors. The company also offers customer support, account management, and engineering services, as well as manufactures masks. Its products are used in mobile devices, high performance computing, automotive electronics, and internet of things markets. The company was incorporated in 1987 and is headquartered in Hsinchu City, Taiwan.

Tiwan Semiconductor (TSM) down 75% from top This asset demands a closer look. TSMC has had a positive MacD cross and looks to be headed back up. It's to early to tell but buying 75% off of highs could be a solid buy. Until Intel and Samsung get going in their new fabs you can bet TSMC will be in high demand. China is the wild card in this trade given the hostility going on over Taiwan.

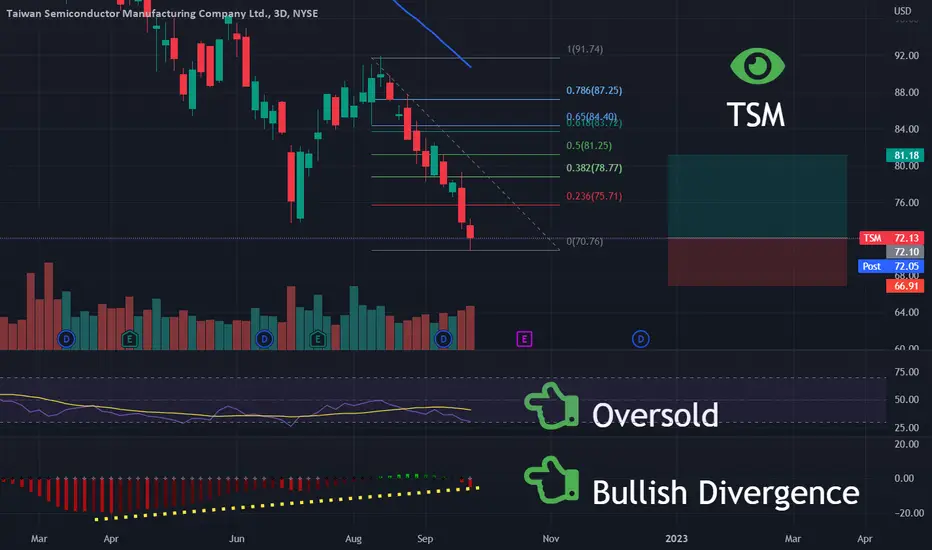
TSM | Oversold Semiconductor | LONGTaiwan Semiconductor Manufacturing Company Limited manufactures, packages, tests, and sells integrated circuits and other semiconductor devices in Taiwan, China, Europe, the Middle East, Africa, Japan, the United States, and internationally. It provides complementary metal oxide silicon wafer fabrication processes to manufacture logic, mixed-signal, radio frequency, and embedded memory semiconductors. The company also offers customer support, account management, and engineering services, as well as manufactures masks. Its products are used in mobile devices, high performance computing, automotive electronics, and internet of things markets. The company was incorporated in 1987 and is headquartered in Hsinchu City, Taiwan.


Finally going long This stock is gapping up pre market. It has hit weekly demand zone, in conjunction with macd and rsi all pointing to the upside. Great entry to the upside.

TSM, 6d+/64.99~58.08shaking at 58.05~64.99 in 6 days.
==================================================================================================================================================================
This data is analyzed by robots. Analyze historical trends based on The Adam Theory of Markets (20 moving averages/60 moving averages/120 moving averages/240 moving averages) and estimate the trend in the next 10 days. The white line is the robot's expected price, and the upper and lower horizontal line stop loss and stop profit prices have no financial basis. The results are for reference only.

TSM weekly bottom of MRC stop loss $0TSM weekly bottom of MRC stop loss $0 stock is under political pressure, but I feel it's gonna be doing fine in a long term.

TSM providing entry?TSM stock price is fighting bad sentiment around about anything related to China. YTD the stock price has almost halved. Current valuation is very attractive for a long term investor looking for a company that, at least historically, provided very decent growth rates. Based on last quarter's EPS, current P/E ratio is lower than 10. That's amazing for a high growth company like TSM, but of course mainly driven by the current sentiment.
Looking at the current share price, it may have found at least near term support around 60 where a long term Fibonacci retracement level is (61.8% level). Current levels may offer an excellent buying opportunity for long term investors too if the geopolitical situation around China and Taiwan cools down. Of course, this depends solely on the 'ambitions' of Chinese president Xi.

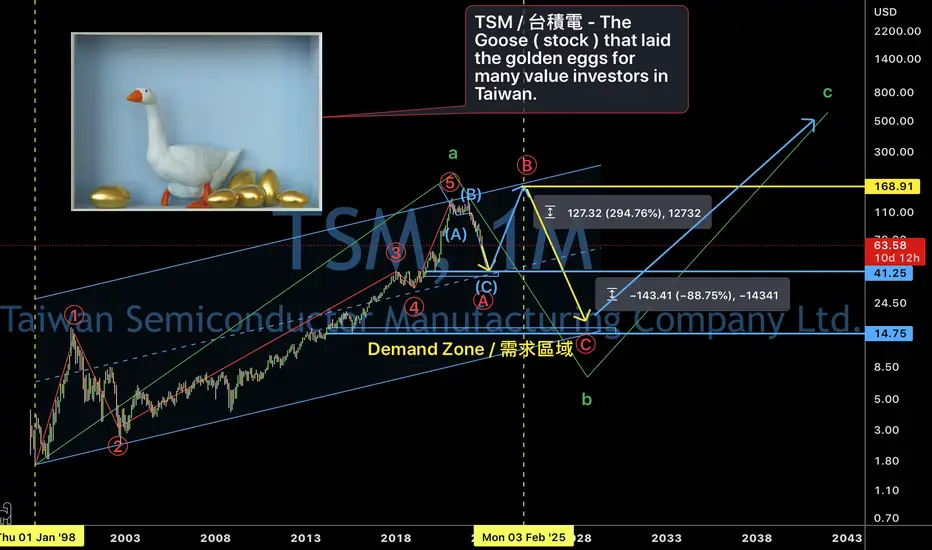
TSM ( Taiwan Semiconductor ) analysis. 21/Oct/22TSM ( Taiwan Semiconductor Manufacturing). The world largest semiconductor foundry. TSM .The Goose ( stock ) that laid the golden eggs for many value investors in Taiwan probably only found its base @ around 41.25
$TSM with a Bullish outlook following its earnings #Stocks The PEAD projected a Bullish outlook for $TSM after a Positive over reaction following its earnings release placing the stock in drift B with an expected accuracy of 44.44%.

$TSM - one to watchThis company is incredibly important to the global economy but has suffered from economic headwinds particularly with semiconductor demand coming down and lower margins with inflation
We are approaching a support level that if lost means the trend of the last decade will have been lost...

TSM, 10d+/-17.18%falling cycle -17.18% more than 10 days
This data is analyzed by robots. Analyze historical trends based on The Adam Theory of Markets (20 moving averages/60 moving averages/120 moving averages/240 moving averages) and estimate the trend in the next 10 days. The white line is the robot's expected price, and the upper and lower horizontal line stop loss and stop profit prices have no financial basis. The results are for reference only.

TSM soon will make W5Monitor the trendline, I think and forecast that W4 will complete soon, then W5 will assume next year.
Morgan Stanley recommended the stock.
"We anticipate a semiconductor cycle recovery in 2H23 and suggest bargain-hunting in quality stocks right now. TSMC is our top pick," the investment bank said in a Tuesday note. It characterized TSMC as "the enabler of future technology."

TSM (Weekly) - No Sign of Recover YetSign of Weakness in the chart:
1. Bearish signal with increasing volume
Drop -35% from Bearish Signal
Disclaimer
This information only serves as reference information and does not constitute a buy or sell call. Conduct your own research and assessment before deciding to buy or sell any stock

TSM - Taiwan Semi / Idea of the Day / $78.55 / $125 Target0. Looking at Taiwan Semiconductor at $78.55 here.
1. Starting a new "long term" position;
2. TSM is a leading indicator, and if it can follow the trajectory laid out for it, we might be going somewhere ;)
3. Looking for a bump and run pattern off the June 16th trendline;
4. Lots of buying points along the way to add to the position;
5. We will accumulate until we hit the 200 dma, looking at the breakout from the channel;
6. Then we could move into a full "long term" position;
7. Continued weakness could be concern for a market lower diamond boundary retest. Looking at 380 on the SPY;
8. Also watching XBI, if this can continue from today above it's trendline, the correction is over, and we chop our way back;
- drchelsea

TSMC BUYLong on TSMC, stoploss at around $74, although there are some risk regarding political tension from China, but it's worth it.

$TSM Possible Inverted H&S Weekly $NVDA $AMD $SOXLTSM setting up a possible inverted head and shoulders on the weekly chart as NVDA runs into problems in China today.

TSM swing short ideaHey all,
I'm not short on TSM- I don't think it is volatile enough a stock for me to want to play it. That being said, in my eyes, TSM's chart is part of the reason why I believe semiconductors are about to get smacked around, along with other unhealthy looking charts within the sector. All this recent rally is for semiconductors by the look of things is that it is a bounce within a strong downtrend. This thing is probably going to give up all of its post-pandemic gains very rapidly.

TSM: What do you see BULL or BEAR?????#Ticker Symbol: TSM
#Timeframe: 4 Hour
#4X BEAR Pattern
#Investment Strategy: Short
TECHNICAL ANALYSIS:
- Rejection of Trend
-Closed below 9EMA
-Money Movement shifting downward
-Formation of Red dot line with Big Red dot (i.e. (EMA crossover) means bearish
#####Follow for daily stock, crypto and forex technical analysis.#####
⚠️ Trading is risky, and I understand nothing is guaranteed. Proper risk management should be in place at all times to minimize losses. Please consult a financial advisor before trading. All Inclusive Trading LLC is not a financial advisor and may not be held liable for any losses which may occur.
