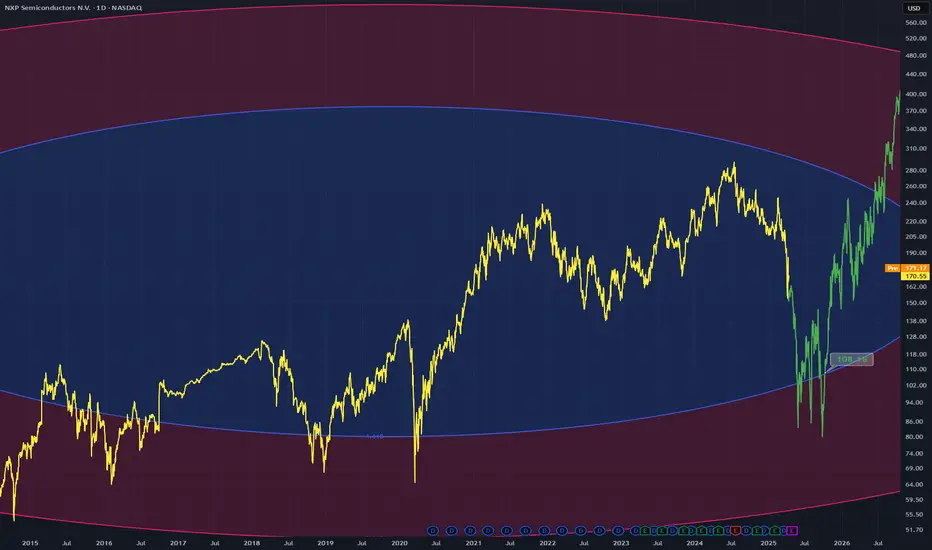
NXPI - Fib Circle RetestA retest of the circle 1.618 fib circle in blue
This has been seen as an area of support for awhile now
I say price will fall to it and find support again before price takes off back upwards on this daily chart
A double top is also present that supports the idea that a downward movement is coming on
Key facts today
Next report date
—
Report period
—
EPS estimate
—
Revenue estimate
—
8.931 CHF
2.28 B CHF
11.46 B CHF
253.25 M
About NXP Semiconductors N.V.
Sector
Industry
CEO
Kurt Sievers
Website
Headquarters
Eindhoven
Founded
2006
ISIN
NL0009538784
FIGI
BBG00LVF1904
NXP Semiconductors NV is a holding company which engages in the provision of semiconductor solutions. It operates through the following geographical segments: China, Netherlands, United States, Singapore, Germany, Japan, South Korea, Malaysia, and Other Countries. The company was founded on August 2, 2006, and is headquartered in Eindhoven, the Netherlands.
Nxpi in the next few daysNxpi will be bullish in the next few days
we will see very strong movement in the next few days for this stock

NXPI at a Crucial Support: A 60% Upside Potential?📉 Current Price: $210
📊 Technical Outlook:
NXPI is testing a strong trendline support. The stock is currently hovering around the 200-Week Moving Average, which has acted as a dynamic support level in past corrections.
Additionally, it is at the 61.8% Fibonacci retracement level from the previo

NASDAQ-NXPI: Is the Market on the Verge of a Reversal?A Critical Juncture: What’s Next for NASDAQ-NXPI?
The semiconductor sector has been riding a wave of volatility, and NASDAQ-NXPI is no exception. The stock currently trades at $208.55, reflecting a 29.56% decline from its all-time high of $296.08 recorded in mid-2024. With a downward deviation of

NXP Semiconductors (NXPI) | Chart & Forecast SummaryKey Indicators on Trade Set Up in General
1. Push Set Up
2. Range Set up
3. Break & Retest Set Up
Active Sessions on Relevant Range & Elemented Probabilities;
* Asian(Ranging) - London(Upwards) - NYC(Downwards)
* Weekend Crypto Session
# Trend | Time Frame Conductive | Weekly Time Frame
- General

Time to Accumulate for the next run As you can see from the patterns in both MACD RSI and price chart. NXP went into another correction phase. It's just perfect times to accumulate and wait about 1 year or so to see another 40 to 50% from the bottom of the correction. I suggest to distribute the accumulation in time to get better aver

NXPI will roar!Looking at the technical indicators and strong revenue predictions; NXPI first should try 250 range and then probably go down to ~211 (+/- 10) price levels to gain strength to test 250 again and 280 region for the first time in the next coming months until the end of 2023-Q4.

NXPI NXP Semiconductors Options Ahead of EarningsAnalyzing the options chain and the chart patterns of NXPI NXP Semiconductors prior to the earnings report this week,
I would consider purchasing the 300usd strike price Calls with
an expiration date of 2024-10-18,
for a premium of approximately $9.10.
If these options prove to be profitable prior t

NXPI: Potential BuyCurrently retesting the previous range, I'm seeing upside potential backed by positive analyst expectations.

NXP Semiconductors May Be Starting to MoveChips have begun 2024 on a strong note, and some traders may look for NXP Semiconductors to participate in the rally.
The first pattern on today’s chart is October’s monthly closing high of $203.46. NXPI paused below the level around November 20. It then climbed, and the same price area went from b

See all ideas
Summarizing what the indicators are suggesting.
Neutral
SellBuy
Strong sellStrong buy
Strong sellSellNeutralBuyStrong buy
Neutral
SellBuy
Strong sellStrong buy
Strong sellSellNeutralBuyStrong buy
Neutral
SellBuy
Strong sellStrong buy
Strong sellSellNeutralBuyStrong buy
An aggregate view of professional's ratings.
Neutral
SellBuy
Strong sellStrong buy
Strong sellSellNeutralBuyStrong buy
Neutral
SellBuy
Strong sellStrong buy
Strong sellSellNeutralBuyStrong buy
Neutral
SellBuy
Strong sellStrong buy
Strong sellSellNeutralBuyStrong buy
Displays a symbol's price movements over previous years to identify recurring trends.
NXPI5422469
NXP B.V. 3.25% 30-NOV-2051Yield to maturity
7.70%
Maturity date
Nov 30, 2051
NXPI5419825
NXP B.V. 3.125% 15-FEB-2042Yield to maturity
7.47%
Maturity date
Feb 15, 2042
NXPI5407721
NXP B.V. 3.25% 11-MAY-2041Yield to maturity
7.32%
Maturity date
May 11, 2041
NXPI4982946
NXP B.V. 3.15% 01-MAY-2027Yield to maturity
6.39%
Maturity date
May 1, 2027
NXPI5399707
NXP B.V. 2.65% 15-FEB-2032Yield to maturity
6.05%
Maturity date
Feb 15, 2032
NXPI5417785
NXP B.V. 2.5% 11-MAY-2031Yield to maturity
5.92%
Maturity date
May 11, 2031
NXPI5414160
NXP B.V. 5.0% 15-JAN-2033Yield to maturity
5.86%
Maturity date
Jan 15, 2033
NXPI5417179
NXP B.V. 2.7% 01-MAY-2025Yield to maturity
5.75%
Maturity date
May 1, 2025
NXPI5418361
NXP B.V. 3.4% 01-MAY-2030Yield to maturity
5.53%
Maturity date
May 1, 2030
NXPI5418363
NXP B.V. 4.3% 18-JUN-2029Yield to maturity
5.26%
Maturity date
Jun 18, 2029
NXPI5407223
NXP B.V. 5.55% 01-DEC-2028Yield to maturity
5.03%
Maturity date
Dec 1, 2028
See all VNX bonds
Curated watchlists where VNX is featured.

Related stocks
Frequently Asked Questions
The current price of VNX is 129.736 CHF — it has decreased by −9.26% in the past 24 hours. Watch NXP SEMICONDUCTORS stock price performance more closely on the chart.
Depending on the exchange, the stock ticker may vary. For instance, on BX exchange NXP SEMICONDUCTORS stocks are traded under the ticker VNX.
VNX stock has fallen by −23.67% compared to the previous week, the month change is a −37.56% fall, over the last year NXP SEMICONDUCTORS has showed a −43.22% decrease.
We've gathered analysts' opinions on NXP SEMICONDUCTORS future price: according to them, VNX price has a max estimate of 226.80 CHF and a min estimate of 152.58 CHF. Watch VNX chart and read a more detailed NXP SEMICONDUCTORS stock forecast: see what analysts think of NXP SEMICONDUCTORS and suggest that you do with its stocks.
VNX stock is 10.38% volatile and has beta coefficient of 1.38. Track NXP SEMICONDUCTORS stock price on the chart and check out the list of the most volatile stocks — is NXP SEMICONDUCTORS there?
Today NXP SEMICONDUCTORS has the market capitalization of 35.90 B, it has decreased by −23.91% over the last week.
Yes, you can track NXP SEMICONDUCTORS financials in yearly and quarterly reports right on TradingView.
NXP SEMICONDUCTORS is going to release the next earnings report on Apr 28, 2025. Keep track of upcoming events with our Earnings Calendar.
VNX earnings for the last quarter are 2.89 CHF per share, whereas the estimation was 2.85 CHF resulting in a 1.33% surprise. The estimated earnings for the next quarter are 2.30 CHF per share. See more details about NXP SEMICONDUCTORS earnings.
NXP SEMICONDUCTORS revenue for the last quarter amounts to 2.83 B CHF, despite the estimated figure of 2.82 B CHF. In the next quarter, revenue is expected to reach 2.51 B CHF.
VNX net income for the last quarter is 449.56 M CHF, while the quarter before that showed 608.45 M CHF of net income which accounts for −26.11% change. Track more NXP SEMICONDUCTORS financial stats to get the full picture.
Yes, VNX dividends are paid quarterly. The last dividend per share was 0.89 CHF. As of today, Dividend Yield (TTM)% is 2.36%. Tracking NXP SEMICONDUCTORS dividends might help you take more informed decisions.
NXP SEMICONDUCTORS dividend yield was 1.95% in 2024, and payout ratio reached 41.24%. The year before the numbers were 1.77% and 37.47% correspondingly. See high-dividend stocks and find more opportunities for your portfolio.
As of Apr 16, 2025, the company has 33.1 K employees. See our rating of the largest employees — is NXP SEMICONDUCTORS on this list?
EBITDA measures a company's operating performance, its growth signifies an improvement in the efficiency of a company. NXP SEMICONDUCTORS EBITDA is 4.08 B CHF, and current EBITDA margin is 35.85%. See more stats in NXP SEMICONDUCTORS financial statements.
Like other stocks, VNX shares are traded on stock exchanges, e.g. Nasdaq, Nyse, Euronext, and the easiest way to buy them is through an online stock broker. To do this, you need to open an account and follow a broker's procedures, then start trading. You can trade NXP SEMICONDUCTORS stock right from TradingView charts — choose your broker and connect to your account.
Investing in stocks requires a comprehensive research: you should carefully study all the available data, e.g. company's financials, related news, and its technical analysis. So NXP SEMICONDUCTORS technincal analysis shows the sell today, and its 1 week rating is sell. Since market conditions are prone to changes, it's worth looking a bit further into the future — according to the 1 month rating NXP SEMICONDUCTORS stock shows the strong sell signal. See more of NXP SEMICONDUCTORS technicals for a more comprehensive analysis.
If you're still not sure, try looking for inspiration in our curated watchlists.
If you're still not sure, try looking for inspiration in our curated watchlists.