C98/USDT LONG SCALP SETUP!Hello everyone, if you like the idea, do not forget to support with a like and follow.
Welcome to this C98/USDT trade setup.
C98 looks good here. Breaks out from the falling wedge-like structure in 1hr time frame. Open a long position here and add more in the dip.
Target1:- $0.385
Target2:- $0.406
Target3:- $0.422
Target4:- $0.436
SL:- $0.359
Lev:- 5x-10x
If you like this idea then do support it with like and follow.
Thank You!
C98USDT trade ideas

C98USDT LONG SignalAfter breaking the mid-term accumulation, this gem is about to kickoff. Our next target C98USDT is about to fly high and give us a nice ride. My setup for this is as follows
Leverage: 5-10x (based on 5% of your total capital).
Entry: 0.30 - 0.37
One-time-Entry: 0.3450
Mid-Term: 0.55 - 0.67
Long Term: > 0.75
Good luck.

C98 - Long Term Buy OpportunityC98 has been sitting on long term support levels since the major crash in May-June which affected the entire crypto market. While it did not show any sign of reversal, a recent tweet from its founder, Thanh Lee, suggests that in 4 days a major announcement will be released signalling the potential of directional changes in the price trajectory for the token.
I am buying some at this level, 0.40USDT to position for a possible reversal. Needless to say that we need to remain cautious given current choppy market conditions.

C98 shortC98 bounced off the resistance level. Asset broke trough off the ascending trendline. Bearish movement to support level at 0.388 is possible.

Buy Sell Signal StrategyBuy Sell Signal Strategy 1 - Just Copy Paste this Script and Save in your Trading View Account:
//@version=4
study(title="BUY SELL", overlay=true, resolution="")
short = ema(close, 8)
long = ema(close, 21)
plot(short, color = color.red)
plot(long, color = color.green)
plotshape(crossover(short,long) , style = shape.triangleup , location = location.belowbar, color = color.green , size = size.normal)
plotshape(crossunder(short,long), style = shape.triangledown , location = location.abovebar, color = color.red , size = size.normal)


$c98Sport trader only in this bear market 🤠 let go from here as you can see we are going to moon soon from here

C98/USDT 4HOUR ANALYST 🌟⚡⚡⚡
C98 digital currency failed to cross the level of $0.45 with several hits, currently the price is close to its last drawn support at the level of $3.5.
If the price stabilizes above the level of $0.45 (Areas Pivots) and above the yellow line of the EMA 200, it has the ability to realize the targets of $0.48, $0.51 and $0.54.
Otherwise, with the loss of the last support drawn in green, the price will see lower levels, if needed, a new update will be available to you.
Arztoday Team 🚀

C98USDT | RISING SUPPORT BROKENC98USDT has broken the rising trendline. We are expecting the price to go down from here but first, it needs to retest the resistance zone .
The bears are in control below the rising support. While bulls will be in control only above break of the recent high.
Trade you levels accordingly

C98 - Short and Long strategiesBYBIT:C98USDT
1H time frame
-
Short:
if C98 momentum is rejected from the upper downtrend line.
Targeting 0.418, 0.4075
Stop loss: if Price close above the downtrend line.
Long:
if C98 can take out that downtrend line, long it after BO or retest.
Targeting 0.443
Stop loss: if BO is false.

C98 will go wildHello traders!
Welcome back to another episode with Analyst Aadil1000x.
Today we are buying C98 in spot and will aim for 50% gains. There is a strong reversal pattern at the bottom and after the formation of bullish pattern market is moving up fast.
The target is 0.647 which will give a gain of 50% profit.
Thanks to the tradingview team for providing the platform.


c98c98 has formed bullish minor 12345 .can expect abc correction now before going for major wave 3 .
NFA DYOR

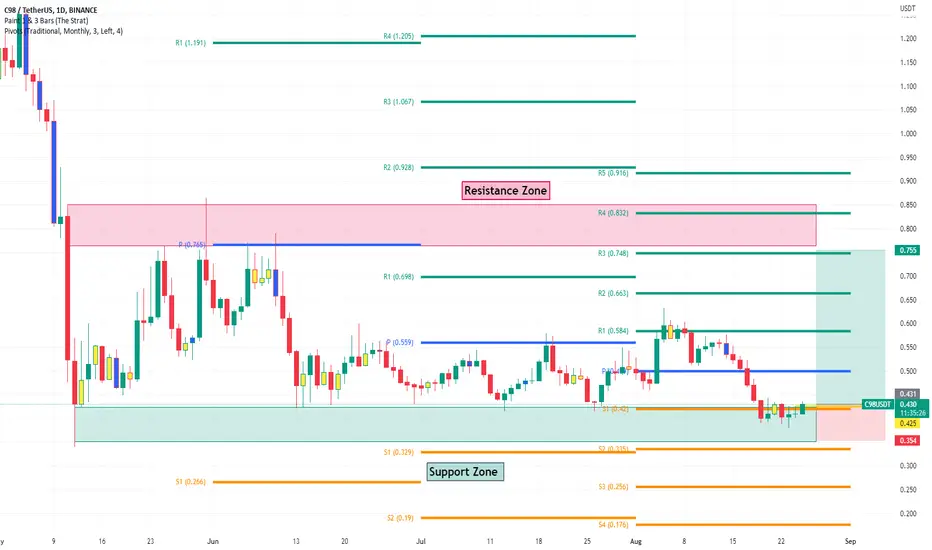
#Coin98 reversal ideaHello dear Traders,
Here is my idea for #Coin98
Price finds support at monthly pivot S1 line.
Daily inside bar has been formed and we will wait for a close above the yellow trigger line (0.425$) in the 4h chart to enter the trade.
Profit target 0.76$ and stop 0.35$.
Risk Reward ratio 4.2
Please feel free to ask any question in comments. I will try to answer all! Thank you.
About #Coin98
Rank 267 by marked cap
Coin98 is a decentralized finance (DeFi) solution that allows users access to cross-chain swaps, staking and yield farming.
To learn more about this project, check out our deep dive of Coin98.
Coin98 aims to fulfill untapped demand in the industry and become a Gateway bridging TradFi users to any DeFi services on multiple blockchains. It accomplishes this mission through a full suite of products, including Coin98 Wallet, Coin98 Exchange, and Space Gate (cross-chain bridge).
Coin98 Wallet: Allows users to store, send, receive, manage crypto assets and connect to numerous dApps on multiple blockchains. It supports over 40 blockchains such as Ethereum, Binance Smart Chain, Solana, Polygon, Avalanche, Terra, etc on both mobile (iOS & android) and Chrome extension versions.
Coin98 Exchange: A multi-chain liquidity aggregator that supports assets across a variety of blockchains, including but not limited to Ethereum, Binance Smart Chain, Solana, Avalanche and Polygon.
Source: Coin98 price today, C98 to USD live, marketcap and chart | CoinMarketCap
About Pivot Lines
The term monthly indicates that the pivot levels are calculated using the prior month’s high, low and closing price. The basic formulas are now well-known and pivot calculators are readily available on Tradingview.
If a market closes above the monthly pivot, then the trend is positive, and closing below the pivot is negative. In a positive market, you look for prices to pause, or maybe even reverse, at the first pivot resistance level (R1). If that level is exceeded, then the R2 is the next level to watch. Conversely, when a market drops below the monthly pivot, then the first downside target is the first pivot support (S1), and the second support is S2.
Source: Learn How To Use Monthly Pivot Analysis (forbes.com)
Coin98 longCoin98 bounced off the support level. Asset broke through the descending trendline. Bullish movement to resistance level at 0.515 is expected to happen.

C98 is Ready For LONG PositionC98 / USDT is Going to get a good setup for LONG POSITION
you can get this position with LEV5 X
Good Luck & dont forget to set SL & TP

c98btc fell to 21k as I expected and alts went down double. especially c98 which has reached its lowest yellow support zone. there is high possibility of pulling back to orange line sitting at 0.5. trade safe and enjoy

C98/USDT BUYING SETUP (SWING)#C98/USDT BUYING SETUP (Swing)
$C98 consolidation on bullish pennant pattern . C98 rejected after hit support trendline at the time 4h demand in there and then any bullish divergence at highly timeframe very potential up. buy with money management
Entry : 0.512 - 0.464 - 0.422
Target : 0.567 - 0.624 - 0.688 - 0.77 - 0.85
Stop : 0.405

Coin98: Descending Broadening Wedge (Bullish!)Coin 98 has been in a bullish pattern called a descending broadening wedge. Price action is more likely to breakout bullish in these patterns. The mesured move is from the high entering the pattern to the low of the pattern. We could expect the price to reach $0.70.

Coin98 longCoin98 bounced off the ascending trendline and bounced off the support level. Bullish movement to resistance level at 0.635 is expected to happen.


C98/USDTC98/USDT
Well, as we can see in the chart, he has done a proper flooring.
On the other hand, you have broken your downward trend line and cannot increase the price to the $2 area.
The targets are indicated in the picture.
#C98USDT #C98 #BTCUSDT #BTC #ETHUSDT #DOGE #DOGEUSDT