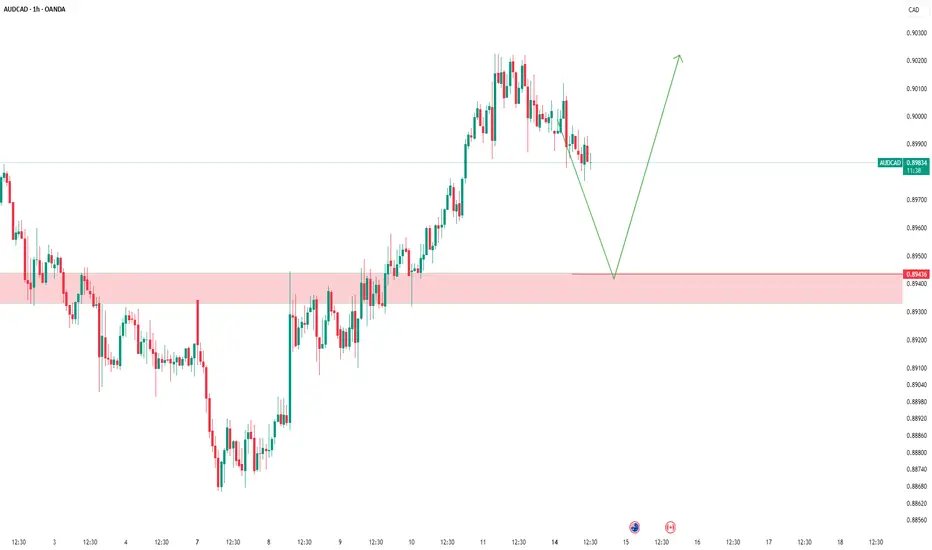
AUDCAD - Possible Buy Setup AheadThe market is approaching a significant zone.
We’re standing by — no rush, no guessing.
If a clean bullish signal appears, we go long.
If it breaks through, we wait for a pullback and adapt.
Our job isn’t prediction — it’s reaction.
Follow the plan. Let the profits take care of themselves
CADAUD trade ideas
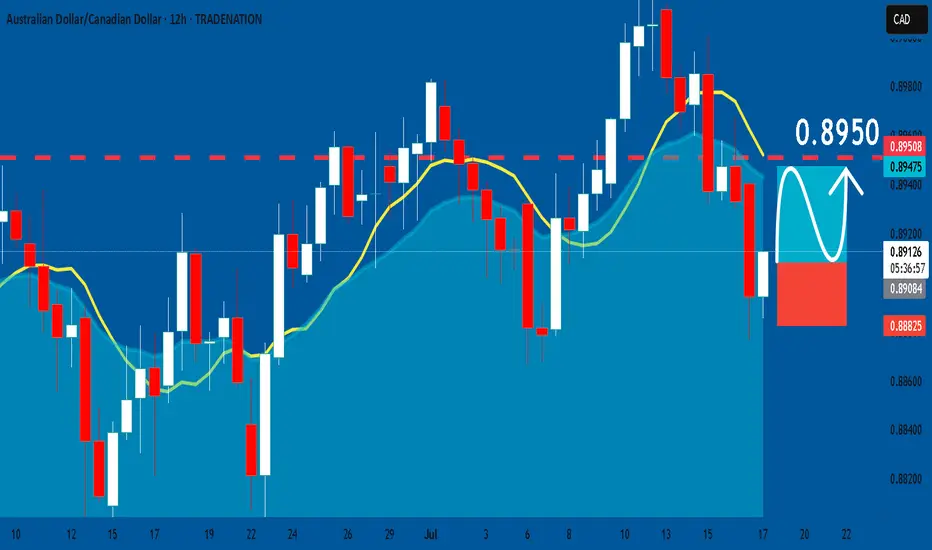
AUDCAD: Long Signal Explained
AUDCAD
- Classic bullish formation
- Our team expects pullback
SUGGESTED TRADE:
Swing Trade
Long AUDCAD
Entry - 0.8908
Sl - 0.8882
Tp - 0.8950
Our Risk - 1%
Start protection of your profits from lower levels
Disclosure: I am part of Trade Nation's Influencer program and receive a monthly fee for using their TradingView charts in my analysis.
❤️ Please, support our work with like & comment! ❤️
audcad Short
We have a break of structure. we waiting for a fair value gap on lower time frame in order to sell to those zone. lets wait and see how it goes

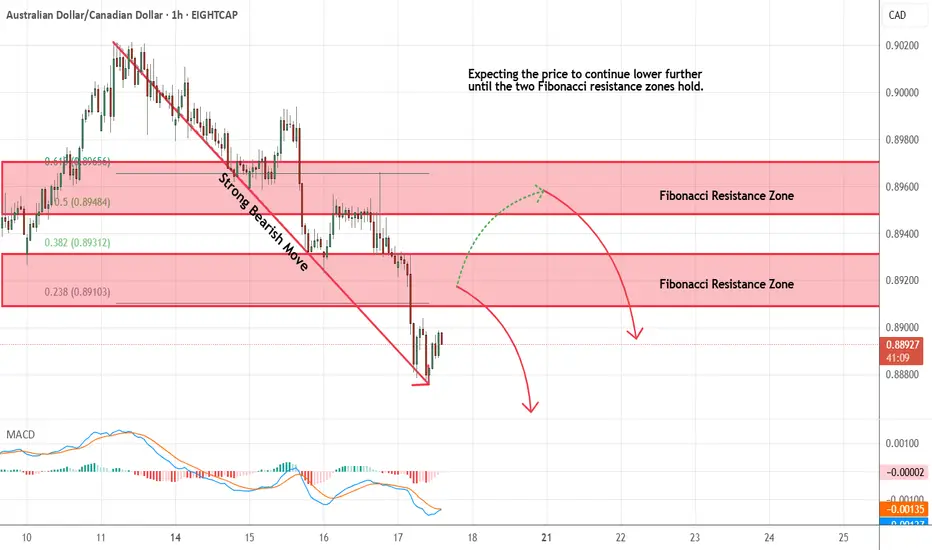
AUDCAD - Short Term Sell IdeaH1 - Strong bearish move.
No opposite signs.
Currently it looks like a pullback is happening.
Expecting bearish continuation until the two Fibonacci resistance zones hold.
If you enjoy this idea, don’t forget to LIKE 👍, FOLLOW ✅, SHARE 🙌, and COMMENT ✍! Drop your thoughts and charts below to keep the discussion going. Your support helps keep this content free and reach more people! 🚀
--------------------------------------------------------------------------------------------------------------------
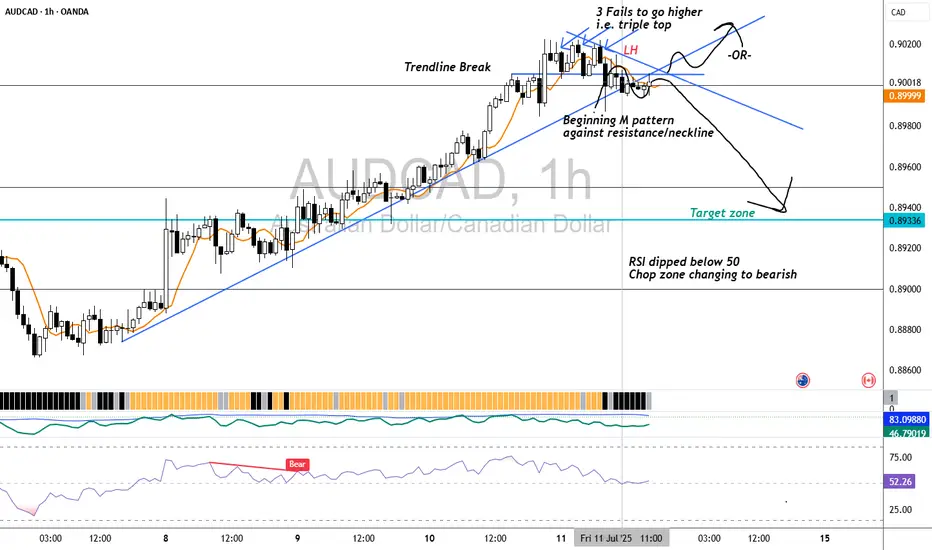
AUDCAD H1 BearishFactors of confluence in favor of short
1. Daily resistance zone 0.90432
2. Triple top
3. M pattern against resistance
4. RSI dipped below 50
5. Chop Zone change to bearish
6. Break of trendline
7. 3.5 R/R
8. Removal of liquidity zone on daily chart(prior high)
Risks
1. No LL yet
2. 2nd time back to daily resistance zone- may break through to upside
3. Price to return to congestion zone above for more consolidation before choosing a direction
4. Possibility to resume upwards momentum
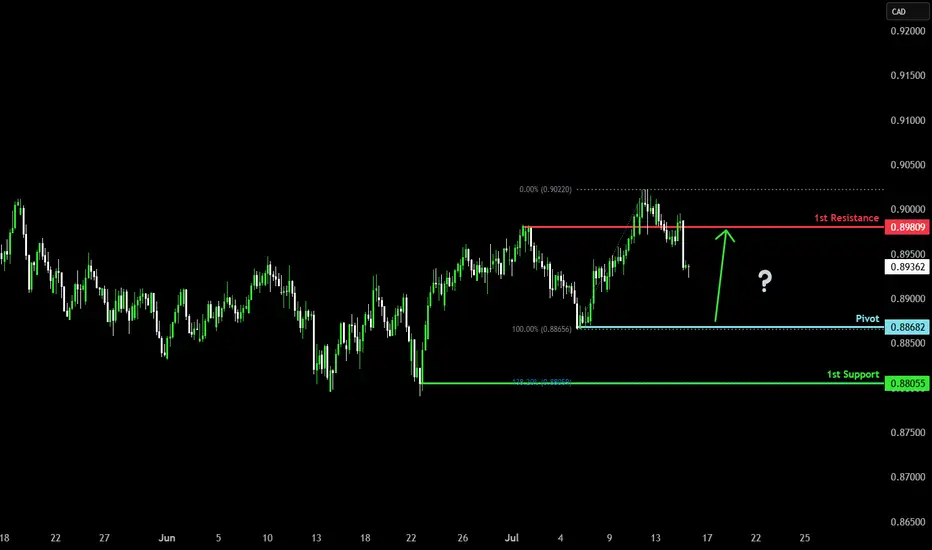
Bullish bounce off pullback support?AUD/CAD is falling towards the pivot which is a pullback support and could bounce to the 1st resistance which is a pullback resistance.
Pivot: 0.88682
1st Support: 0.88055
1st Resistance: 0.89809
Risk Warning:
Trading Forex and CFDs carries a high level of risk to your capital and you should only trade with money you can afford to lose. Trading Forex and CFDs may not be suitable for all investors, so please ensure that you fully understand the risks involved and seek independent advice if necessary.
Disclaimer:
The above opinions given constitute general market commentary, and do not constitute the opinion or advice of IC Markets or any form of personal or investment advice.
Any opinions, news, research, analyses, prices, other information, or links to third-party sites contained on this website are provided on an "as-is" basis, are intended only to be informative, is not an advice nor a recommendation, nor research, or a record of our trading prices, or an offer of, or solicitation for a transaction in any financial instrument and thus should not be treated as such. The information provided does not involve any specific investment objectives, financial situation and needs of any specific person who may receive it. Please be aware, that past performance is not a reliable indicator of future performance and/or results. Past Performance or Forward-looking scenarios based upon the reasonable beliefs of the third-party provider are not a guarantee of future performance. Actual results may differ materially from those anticipated in forward-looking or past performance statements. IC Markets makes no representation or warranty and assumes no liability as to the accuracy or completeness of the information provided, nor any loss arising from any investment based on a recommendation, forecast or any information supplied by any third-party.
AUDCAD breakout of resistance trend lineAUDCAD was trading in symmetrical triangle and recently broke the resistance and soon may retest it and trade can be entered
AUD/CAD LIVE TRADE WINVery nice move down early in the day to give us the win on this 3 day trade. This is the VMS strategy in action. On to the next setup. I have never been a fundamental trader, always technical....are you more of a fundamental or technical trader?

AUDCAD Trade plan: Waiting for bullish confirmation at RetestPrice broke above resistance with a momentum candle, indicating buyer control. This is our first clue that a structure shift might have occurred.
This retest is essential. Many traders make the mistake of entering too early without confirmation. But it's right here, once price touches the former resistance, that you must observe how price reacts. Look for price exhaustion or reversal candlesticks such as bullish engulfing patterns, or even inside bars.
Once rejection is confirmed, I'm looking to go long to 0.90450.
Just sharing my thoughts for the charts, this isn’t financial advice. Always confirm your setups and manage your risk properly.

7.15 AUD/CAD LIVE TRADE UPDATEWe took this trade based on the shooting star followed by a strong engulfing candle reversal pattern. Volume was strong as well as momentum. We have had the best results with this pattern if it "immediately" follows a strong impulsive move. Price action was moving down nicely then boom, against it. We use a R/R of 2:1 on all of our trades. As swing traders some of our trades will take a week to play out others less than 24 hours. Do any of you trade reversals? What is your favorite reversal pattern?


AUD_CAD RISKY LONG|
✅AUD_CAD is trading in an
Uptrend and the pair made
A nice pullback and retested
The falling support so we are
Locally bullish biased and
We will be expecting a
Local bullish rebound
LONG🚀
✅Like and subscribe to never miss a new idea!✅
Disclosure: I am part of Trade Nation's Influencer program and receive a monthly fee for using their TradingView charts in my analysis.

Bullish bounce?AUD/CAD is falling towards the support level which is an overlap support that aligns with the 71% Fibonacci retracement and could bounce from this level to our take profit.
Entry: 0.89106
Why we like it:
There is an overlap support that lines up with the 71% Fibonacci retracement.
Stop loss: 0.88668
Why we like it:
There is a pullback support.
Take profit: 0.90090
Why we like it:
There is a pullback resistance.
Enjoying your TradingView experience? Review us!
Please be advised that the information presented on TradingView is provided to Vantage (‘Vantage Global Limited’, ‘we’) by a third-party provider (‘Everest Fortune Group’). Please be reminded that you are solely responsible for the trading decisions on your account. There is a very high degree of risk involved in trading. Any information and/or content is intended entirely for research, educational and informational purposes only and does not constitute investment or consultation advice or investment strategy. The information is not tailored to the investment needs of any specific person and therefore does not involve a consideration of any of the investment objectives, financial situation or needs of any viewer that may receive it. Kindly also note that past performance is not a reliable indicator of future results. Actual results may differ materially from those anticipated in forward-looking or past performance statements. We assume no liability as to the accuracy or completeness of any of the information and/or content provided herein and the Company cannot be held responsible for any omission, mistake nor for any loss or damage including without limitation to any loss of profit which may arise from reliance on any information supplied by Everest Fortune Group.

AUDCAD LONG 14-7-2025indices
axy : bullish
cxy : bearish
trade long with proper risk management only 0.5 % per trade

Market Insights with Gary Thomson: 14 - 18 JulyMarket Insights with Gary Thomson: Inflation Rate in Canada, US, and UK, US PPI, Earnings Reports
In this video, we’ll explore the key economic events, market trends, and corporate news shaping the financial landscape. Get ready for expert insights into forex, commodities, and stocks to help you navigate the week ahead. Let’s dive in!
In this episode of Market Insights, Gary Thomson unpacks the strategic implications of the week’s most critical events driving global markets.
👉 Key topics covered in this episode:
— Inflation Rate in Canada
— US Inflation Rate
— UK Inflation Rate
— US Producer Price Index
— Corporate Earnings Statements
Don’t miss out—gain insights to stay ahead in your trading journey.
This video represents the opinion of the Companies operating under the FXOpen brand only. It is not to be construed as an offer, solicitation, or recommendation with respect to products and services provided by the Companies operating under the FXOpen brand, nor is it to be considered financial advice.

7.14 AUD/CAD 4H LIVE TRADE UPDATEThis market gave us a great shooting star reversal pattern on the 4H chart on Friday...

AUDCAD shortSwing Trade Idea – AUD/CAD
The price is currently trading below the 50-day moving average, indicating bearish momentum. Recently, a strong bearish candle broke the previous market structure, confirming downside pressure. Based on this, I expect the price to move lower towards the target area, which aligns with the 261.8% Fibonacci extension level.

AUDCAD | Weekly Outlook | July 14, 2025🟦 AUDCAD | Weekly Outlook | ICT-Based Analysis
📅 Week Starting: July 14, 2025
🧠 "Don't chase — let the trade come to you."
🧭 Market Context (1H + HTF Alignment)
This chart outlines a clear Smart Money framework for AUDCAD using ICT principles. The market recently completed a manipulation phase below a major accumulation zone, forming a clear SMT divergence and respecting a CISD (Clean Internal Sell-side Displacement).
After manipulation and SMT confirmation, price respected the CISD and showed willingness to displace bullishly, suggesting a potential re-accumulation phase on the lower timeframes.
🔍 Key Observations
Accumulation + SMT:
We had a prolonged accumulation phase that led to a smart money manipulation (fakeout), marked by SMT divergence. This was followed by a bullish shift in structure, confirming intent.
CISD + CE Reaction:
Price respected the CISD zone and formed a bullish W reversal + OB/BI setup. This is a common ICT pattern before major expansions.
Re-Accumulation Area:
The current consolidation near ERL levels shows signs of controlled accumulation, with price respecting previous liquidity levels.
This area may act as a springboard for expansion towards HTF objectives.
📈 HTF Targeting: Reversal Area + EQH
The chart marks a High Time Frame Reversal Area (HTF) above the current price, potentially acting as a premium inefficiency or sell-side liquidity target.
EOH (Expansion Objective High) is drawn in that same region, providing a long-term magnet for price.
This aligns with the broader Monthly Cycle expectation.
🔄 Monthly Cycle Analysis
“Monthly Cycle is Created — Open, Low... Now We Wait for the High and Close.”
This suggests:
Monthly Open and Low are already formed.
A bullish monthly cycle is anticipated — meaning we're waiting for the High to form next.
Once the high is set, a retracement towards the Close level is expected by the end of the month.
This macro view gives us context for aiming long positions on pullbacks — buying dips within the re-accumulation range.
⚠️ Trader's Insight
Don’t Chase — Let the Trade Come to You.
The setup is not about chasing price. Instead, the idea is to:
Wait for price to return to favorable zones (e.g., CE of OB inside CISD)
Confirm intent with LTF SMT, FVGs, or M15 structural shifts
Target HTF inefficiencies and liquidity zones (EOH & Reversal Area)
🎯 Bias for the Week
Bullish, based on:
Monthly cycle direction (expecting HIGH)
Price behavior post-CISD respect
Clear smart money accumulation and displacement
Re-accumulation on LTFs suggesting continuation

#AN020: US Tariffs, Euro Weakness, USD Strength, Forex at Risk?
1. New US Tariff Threats Against the EU and Canada
Over the weekend, President Trump announced the sending of formal letters introducing new tariffs: 35% on Canadian goods and potential tariffs for the EU as well (15-20%).
Context: The return of protectionism fuels uncertainty.
Market Impact: Shift to safe-haven currencies — the US dollar gains ground, while EUR/USD and USD/CAD remain under pressure.
2. EUR/USD Below 1.1700
The EUR/USD pair closed the week below 1.1700, failing to recover.
3. GBP/USD Loses Ground
The GBP/USD pair fell below 1.3500, hitting a three-week low.
Factors: Disappointing UK GDP data + stronger USD.
Impact: Pressure on the pound, possible continuation of the downtrend to 1.3420 unless better data emerges.
4. USD/JPY near 147.50
The dollar reached new two-week highs against the yen, hitting 147.50.
Causes: Risk flight and reduced expectations for BoJ intervention.
Outlook: If global sentiment remains adverse, USD/JPY could head towards 148.00.
5. Gold and safe-haven assets recover
Trade uncertainty is supporting gold, which has risen to near $3,360/ounce.
Outlook: Volatility and preference for the USD and JPY are increasing; gold will act as a sentinel of fear in the markets.
🔍 Summary of Impacts on Forex Markets
EUR/USD Weaker: Push toward 1.1600 due to trade concerns and USD strength
GBP/USD Down: UK data pressured + risk aversion
USD/JPY Rising: USD refuge and possible break above 148
USD/CAD Volatile: Canadian tariffs penalize CAD, but oil prices and BoC reactions to monitor
Gold & XM Gold strengthens, signaling risk, USD support; JPY and USD benefit

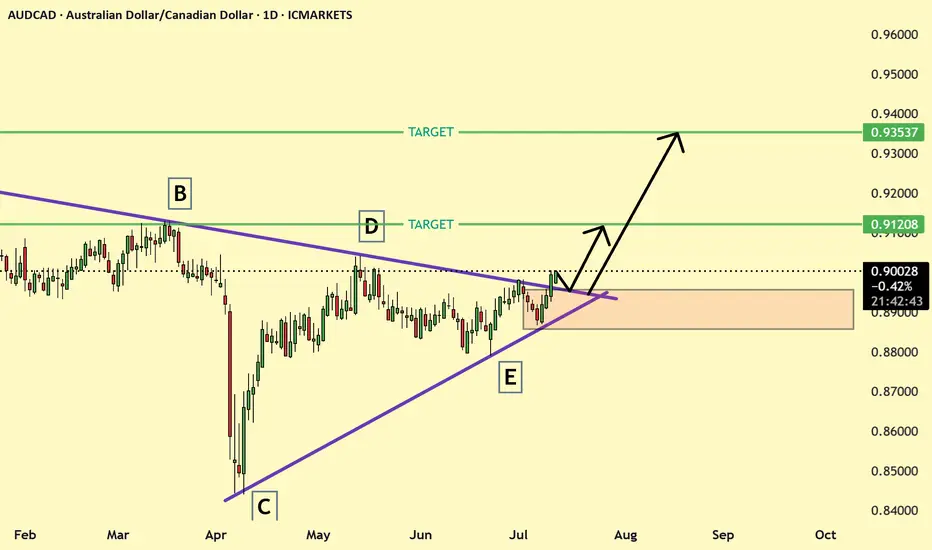
Aud/Cad LongAud has shown strength and this pair is currently testing resistance.
If price will manage to move higher and make resistance to support this suggest
that byers are here and price may go up to the next resistance at 0.91000 and beyond.
TP 1: 0.9100 TP 2: 0.93500
SL: below moving average
Entry: 0.90100 and only if price manages to break above resistance and retest it.
If price will move down from here this trade is invalid

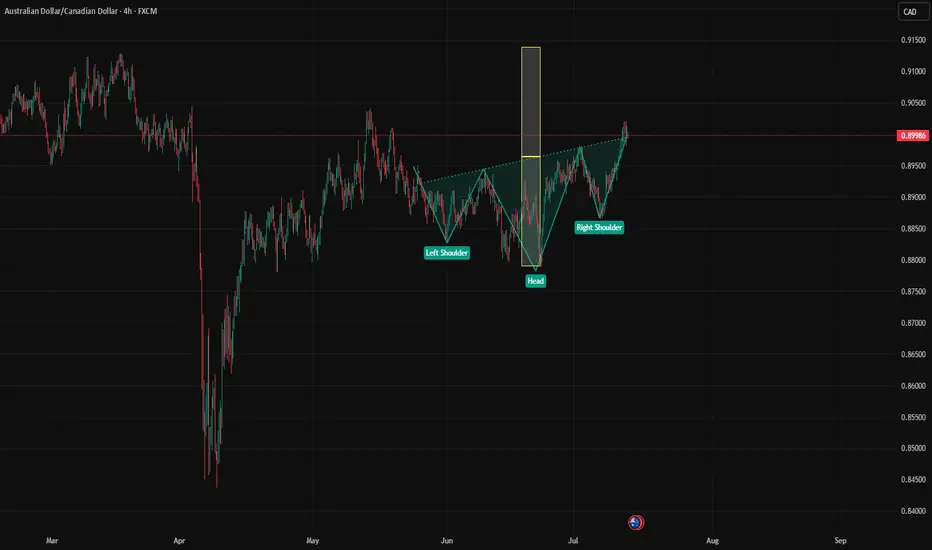
Will AUCAD go up? AUDCAD form HNS in H4, however price is in a big range. Please see any strong and solid bullish candle that breaks above to make this valid, and make it a 1:1 ratio.
AUDCAD: Forecast & Technical Analysis
Balance of buyers and sellers on the AUDCAD pair, that is best felt when all the timeframes are analyzed properly is shifting in favor of the sellers, therefore is it only natural that we go short on the pair.
Disclosure: I am part of Trade Nation's Influencer program and receive a monthly fee for using their TradingView charts in my analysis.
❤️ Please, support our work with like & comment! ❤️

AUDCAD profit hit Congratulations to those of us that took this
AUDCAD profit hit Congratulations to those of us that took this trade we just hit take profit now
