CADCHF - Bearish ContinuationThe pair is in downtrend and recently contacted with downward trend line and showed bearishness. A big marubozu also further confirm tho downside
CADCHF trade ideas

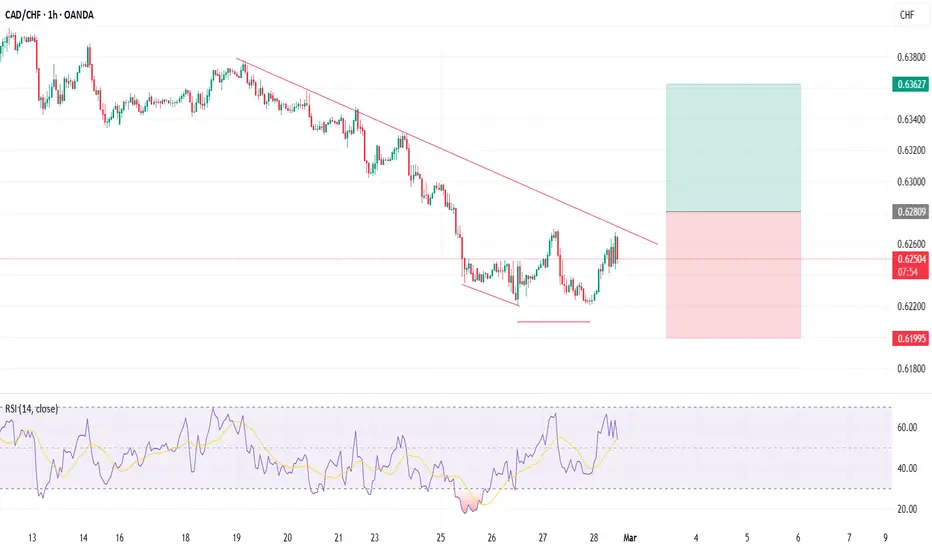
CADCHF LongWe are heading for a resistance. We are waiting for the retest of those zone before we enter Long position

cadchf buy tradeThe Relative Strength Index (RSI) is showing an upward trend, indicating increasing momentum. Additionally, the Moving Average Convergence Divergence (MACD) is showing a bullish crossover, further supporting the potential for an upward move.

CADCHF BEARISHCADCHF continue its bearish trend in h1
break the zone in daily time frame
good for sell
no reversal

CADCHF SELL IDEACADCHF - Canadian Dollar was weak today and Swiss Franc one of the strongest. Price is possible to fall on 0.60595

The chart shows my estimation of CadChf's price action The chart shows my estimation of CadChf's price action based on Elliot wave perspective coupled with waves RSI and Ichimoku cloud properties .
I also use KCT (Kennedy Channeling technique )and Fibonacci.
Here the fifth wave is running with its extension into minor five waves .
We could see price bounce after the completion of the Last minor fifth wave .

CADCHF - LongCADCHF has formed double bottom divergence.
Entry is at the breakout of LH.
At the breakout of LH, buyers will be in control.

CADCHF Buy Trade Idea!CADCHF buy trade can be taken above the mentioned area as it's break higher high on 4hrs to target mentioned in the chart.
Manage your risk according to your account size!

Sell CADCHFWith Trump's announcement of Tarrifs on Canada and mexico starting tomorrow, I expect a continuation of this downward trend on CHF and JPY pairs

CADCHF SHORTWe are in consolidation we touch upper band and we brake 4h trend + trend line. that is signal that market can go down.
My expextation are that we are going to lowr band of consolidation.
At that point i will look for long oportunities.

CADCHF-TREND REVERSALCADCHF can change its trend to bullish as it has formed double bottom pattren along with a bullish divergence wait for its nechline and trendline to secure your entry

CADCHF PRINTING REVERSAL Technically:
CADCHF is printing double bottom
CADCHF is printing bullish divergence
Fundamentally:
According COT data
CAD is bullish
CHF is bearish

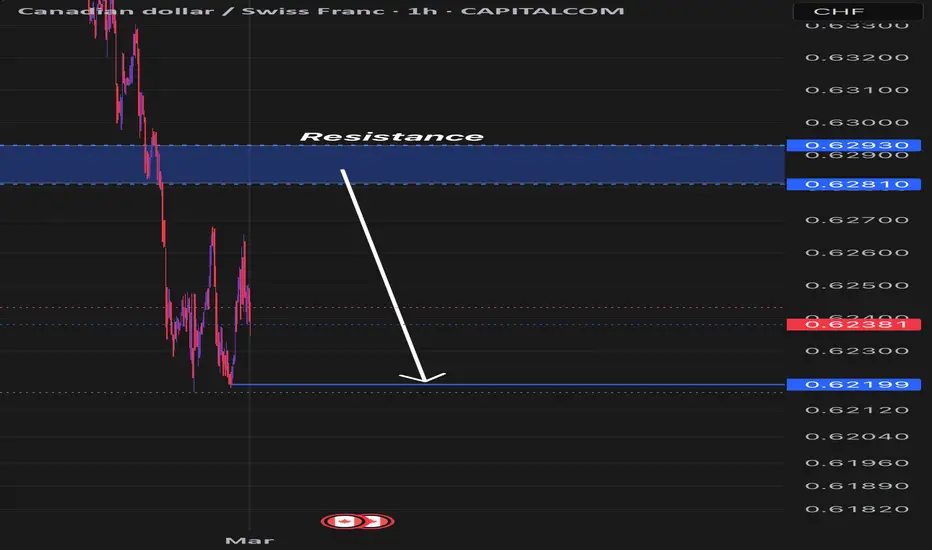
ABOUT CADCHFMy option about cadchf Is more bearish so that zone is good and strong restanice if the price comes to that zone it can pullback
CADCHF H4 STRONG BUYCADCHF H4 Dropped from 0.63472 made a low of 0.62186 made a Climactic Action Bar with Scenerio 3 looking to High to go 0.63137 for the First TpP and can then go to 0.63711.
So Stong BUY.

CADCHF - Long CADCHF has formed double bottom divergence.
Entry is at the breakout of LH.
If price crosses LH, buyers will be in control.
CADCHF LESSONUnderstanding the nature of price is crucial for any trader aiming for long-term success.
While mechanical trading systems can provide structure, relying solely on them may overlook the underlying market dynamics that drive price movements.
By grasping the nuances of price behavior—such as support and resistance, market sentiment, and economic influences—traders can make more informed decisions.
This deeper awareness allows for greater adaptability, enhancing the ability to recognize opportunities and manage risks effectively.
In essence, merging price analysis with mechanical strategies creates a more holistic trading approach, empowering traders to navigate the markets with confidence and insight.


CAD_CHF GROWTH AHEAD|LONG|
✅CAD_CHF is going down now
But a strong support level is ahead at 0.6188
Thus I am expecting a rebound
And a move up towards the target at 0.6260
LONG🚀
✅Like and subscribe to never miss a new idea!✅

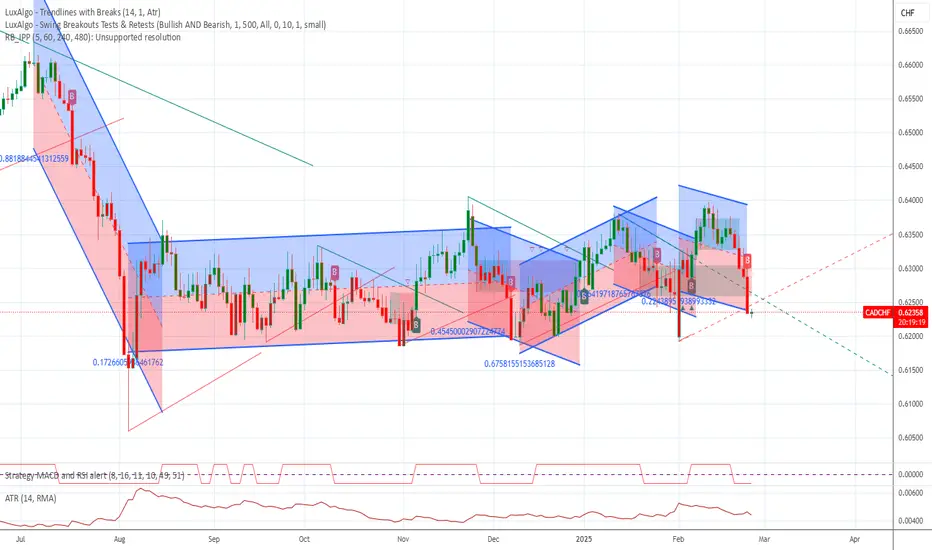
CADCHF is bearishthe pair has made two top as reversal pattern .we have noticed a candle with high shadow named as operating candle before heading south .
using LuxAlgo indicator to specify supply and demand zone we are observing that the zone is coinsiding with the fibo level as target area
let's see what the market will play out

CADCHFWe can attempt to short CADCHF from specified level as it break HL , also bearish divergence occur indicate that it moves downward.
SL , TP mention in chart.

17-02-2025 _ Short Term Bearish Idea _ CADCHF H41- Divergence.
2- Followed by Convergence.
3- Pullback has happened.
4- Expect a push to the downside.

CADCHF ShortCADCHF is now net-Short.
It has negative roll and near the bottom of the consolidation.
I will not take this trade.
CAD-CHF Support Ahead! Buy!
Hello,Traders!
CAD-CHF keeps falling down
And the pair is locally oversold
So after the pair hits a super
Strong horizontal support level
Of 0.6191 a local bullish rebound
Is to be expected
Buy!
Comment and subscribe to help us grow!
Check out other forecasts below too!
