CADCHF What Next? SELL!
My dear followers,
I analysed this chart on CADCHF and concluded the following:
The market is trading on 0.6370 pivot level.
Bias - Bearish
Technical Indicators: Both Super Trend & Pivot HL indicate a highly probable Bearish continuation.
Target - 0.6310
Safe Stop Loss - 0.6403
About Used Indicators:
A super-trend indicator is plotted on either above or below the closing price to signal a buy or sell. The indicator changes color, based on whether or not you should be buying. If the super-trend indicator moves below the closing price, the indicator turns green, and it signals an entry point or points to buy.
———————————
WISH YOU ALL LUCK
CADCHF trade ideas

cad will be retest form the break area hi trader , i will share my idea with you
dont forget to give me your opinion
*** cad will be retest form the berak area
cad break in 1h frame without retest my opinion is cad retest form break area to target

CADCHF: Range BreakoutCADHCF has been in a range since August 2024. This range is quite wide at approximately 160~ pips.
Another observable detail is that the upper range boundary breached twice - once in November 2024 and then again last month, in January 2025.
Right now, in early-February, price is showing signs of breaching the upper range boundary again. Unlike the previous breakouts, this one seems more sustained.
Right now, the daily ATR is 41.4 pips. This sets my trading parameters at TP 20 and SL 41.

CADCHF FORECASTTraders! This is one of my favorite pairs for today, this is because of how the price is developing. When I look at the correlation between the higher and lower timeframe, I get clear reasons why this pair has to be on watch for today. Everything here looks good however waiting for the confirmed entry, is one of the best decisions that we can make. Let's how this price will play out.

CAD-CHF Short From Resistance! Sell!
Hello,Traders!
CAD-CHF made a rebound
From the horizontal support
Below just as we predicted
And keeps growing in a strong
Uptrend but the pair is locally
Overbought so after the retest
Of the horizontal resistance of 0.6409
Above we will be expecting
A local bearish correction
Sell!
Comment and subscribe to help us grow!
Check out other forecasts below too!

CAD/CHF Short-Term Reversal Alert🚨 CAD/CHF Short-Term Reversal Alert! 🚨
🔍 Resistance Holding Strong
The pair is struggling to break through the 0.6370-0.6382 resistance zone, where sellers have previously dominated.
📉 Rejection Signals Weakness
Price action is showing signs of rejection near key resistance, increasing the probability of a short-term pullback.
📊 Bearish Setup Factors:
✅ Multiple rejections at resistance
✅ Potential double-top formation
✅ Overbought near resistance zone
🎯 Key Downside Targets:
🔹 0.6297 (SMA-44 Support)
🔹 0.6192 (Major Support Zone)
💡 Trading Plan:
🔻 Watch for bearish confirmation below 0.6340
🔻 Target 0.6297 and 0.6192 for potential downside moves
🔻 Invalidation above 0.6385
⚠ Stay Sharp! Volatility Ahead!

CAD/CHF, Short, 8h✅ CAD/CHF has rejected the resistance level 3 times, confirming strong selling pressure. The price is now expected to decline slightly in the short term.
SHORT 🔥
✅ Like and subscribe to never miss a new analysis! ✅

CAD_CHF STRONG RESISTANCE|SHORT|
✅CAD_CHF surged again to retest the resistance of 0.6380
But it is a strong key level
So I think that there is a high chance
That we will see a bearish pullback and a move down
SHORT🔥
✅Like and subscribe to never miss a new idea!✅

CADCHF - Trade analysis !!Hello traders!
‼️ This is my perspective on CADCHF.
Technical analysis: Here we are in accumulation phase for the last couple of months. My expectation is price to manipulate buy side liquidity and maybe filling the imbalance. After that to reject from bearish OB to distribute lower.
Like, comment and subscribe to be in touch with my content!

CADCHF Breaks Resistance After Falling Wedge BreakoutCADCHF is currently trading at 0.6360, with a target price of 0.7500, indicating a bullish outlook. The pair has completed a falling wedge breakout, a strong reversal pattern signaling a potential upward trend. This breakout suggests that selling pressure has weakened, allowing buyers to take control. Additionally, CADCHF is breaking a key resistance level, further confirming bullish momentum. A successful breakout above this resistance could lead to a price surge, targeting over 500 pips in gains. Traders should watch for volume confirmation to ensure the breakout is valid. A strong push above resistance with high volume increases the likelihood of sustained movement. Pullbacks or minor corrections may occur, but the overall trend remains bullish. Risk management strategies, including stop-loss placement, are essential to protect against unexpected reversals. Monitoring economic events affecting CAD and CHF will also help in assessing future price movements.

CAD/CHF SHORT FROM RESISTANCE
Hello, Friends!
CAD/CHF pair is trading in a local downtrend which know by looking at the previous 1W candle which is red. On the 6H timeframe the pair is going up. The pair is overbought because the price is close to the upper band of the BB indicator. So we are looking to sell the pair with the upper BB line acting as resistance. The next target is 0.628 area.
✅LIKE AND COMMENT MY IDEAS✅


CADCHF " BUY "Medium support Break out and retest.
Volume line of Fixed range volume break out and retest.

Bullish Opportunity on CADCHFCADCHF has been moving sideways for some time now and it seems ready for a breakout, the overall look is an upward breakout movement, it might have a short retest in key support zones as marked on the chart above or just breakout upward instantly without retesting the support zones
let's watch the market these coming weeks
comment, share and like

CADCHF Potential UpsidesHey Traders, in today's trading session we are monitoring CADCHF for a buying opportunity around 0.63100 zone, CADCHF is trading in an uptrend and currently is in a correction phase in which it is approaching the trend at 0.63100 support and resistance area.
Trade safe, Joe.

Market Analysis & Trading Opportunity | CAD/CHFToday's market opened with a clear risk-off sentiment, leading to a decline in most risk-sensitive assets. Considering the launch of Deepseek, funded with $6 million, it's likely that major investments by the Magnificent 7 in OpenAI could face significant setbacks.
In a risk-off market, one of the strongest options is the Swiss Franc, known as a safe haven currency. Currently, the CAD/CHF pair is positioned perfectly to capitalize on this opportunity. 📊
💡 What are your thoughts on this analysis? Do you also see the Swiss Franc strengthening in today’s market?

CADCHF Long on Regression BreakThe CAD strength theme is continuing as more CAD pairs start to move into a long bias.
I am considering this pair for a EA going long only

CAD/CHF "Canadian vs Swiss" Forex Market Bullish Heist Plan🌟Hi! Hola! Ola! Bonjour! Hallo!🌟
Dear Money Makers & Thieves, 🤑 💰🐱👤
Based on 🔥Thief Trading style technical and fundamental analysis🔥, here is our master plan to heist the CAD/CHF "Canadian vs Swiss" Forex market. Please adhere to the strategy I've outlined in the chart, which emphasizes long entry. Our aim is the high-risk Red Zone. Risky level, overbought market, consolidation, trend reversal, trap at the level where traders and bearish robbers are stronger. 🏆💸Be wealthy and safe trade.💪🏆🎉
Entry 📈 : "The heist is on! Wait for the breakout (0.63300) then make your move - Bullish profits await!"
however I advise placing Buy Stop Orders above the breakout MA or Place Buy limit orders within a 15 or 30 minute timeframe. Entry from the most recent or closest low or high level should be in retest.
Stop Loss 🛑: Thief SL placed at the recent / nearest low level Using the 3H timeframe,
SL is based on your risk of the trade, lot size and how many multiple orders you have to take.
Target 🎯: 0.64400 (or) Escape Before the Target
Scalpers, take note 👀 : only scalp on the Long side. If you have a lot of money, you can go straight away; if not, you can join swing traders and carry out the robbery plan. Use trailing SL to safeguard your money 💰.
📰🗞️Fundamental, Macro, COT, Sentimental Outlook:
CAD/CHF "Canadian vs Swiss" Forex Market market is currently experiencing a bullish trend,., driven by several key factors.
📝 Fundamental Analysis
The CAD/CHF pair is influenced by the economic conditions of both Canada and Switzerland. Canada's economy is expected to grow at a moderate pace, driven by a strong labor market and rising oil prices. Switzerland's economy is also expected to grow, driven by a strong banking sector and a highly skilled workforce.
📝 Macro Economics
The global economic slowdown is expected to continue, with a forecast of 3.0% global GDP growth rate for 2025. This slowdown may impact both the Canadian and Swiss economies, leading to a potential decrease in demand for their currencies.
📝 COT Report
The latest COT report shows that non-commercials (speculators) are net long 5,000 contracts, indicating a bullish sentiment. Commercials (hedgers) are net short 3,000 contracts, indicating a bearish sentiment.
📝 Sentimental Market
Retail traders have a bullish sentiment towards CAD/CHF, with 55% being long. Institutional investors have a bearish sentiment towards CAD/CHF, with 52% being short.
📝 Positioning
Institutional traders are holding short positions in CAD/CHF, indicating a bearish sentiment. Retail traders are holding long positions in CAD/CHF, indicating a bullish sentiment.
📝 Overall Outlook
CAD/CHF is expected to trend bullish in the short term, driven by the bullish sentiment among retail traders and the increasing demand for the Canadian dollar. However, the pair may experience a short-term correction due to the bearish sentiment among institutional traders.
📝 Trend-Based Analysis
The 3-hour chart shows that CAD/CHF is trading above its 200-period moving average, indicating a bullish trend. The Relative Strength Index (RSI) is above 50, indicating a bullish momentum.
⚠️Trading Alert : News Releases and Position Management 📰 🗞️ 🚫🚏
As a reminder, news releases can have a significant impact on market prices and volatility. To minimize potential losses and protect your running positions,
we recommend the following:
Avoid taking new trades during news releases
Use trailing stop-loss orders to protect your running positions and lock in profits
📌Please note that this is a general analysis and not personalized investment advice. It's essential to consider your own risk tolerance and market analysis before making any investment decisions.
📌Keep in mind that these factors can change rapidly, and it's essential to stay up-to-date with market developments and adjust your analysis accordingly.
💖Supporting our robbery plan will enable us to effortlessly make and steal money 💰💵 Tell your friends, Colleagues and family to follow, like, and share. Boost the strength of our robbery team. Every day in this market make money with ease by using the Thief Trading Style.🏆💪🤝❤️🎉🚀
I'll see you soon with another heist plan, so stay tuned 🤑🐱👤🤗🤩

CADCHF 4H short trade planThe plan is based on ERL to IRL. After sweeping the liquidity and taping into D Fvg the price retraced perfectly 70.5% and on its way to its purported target.

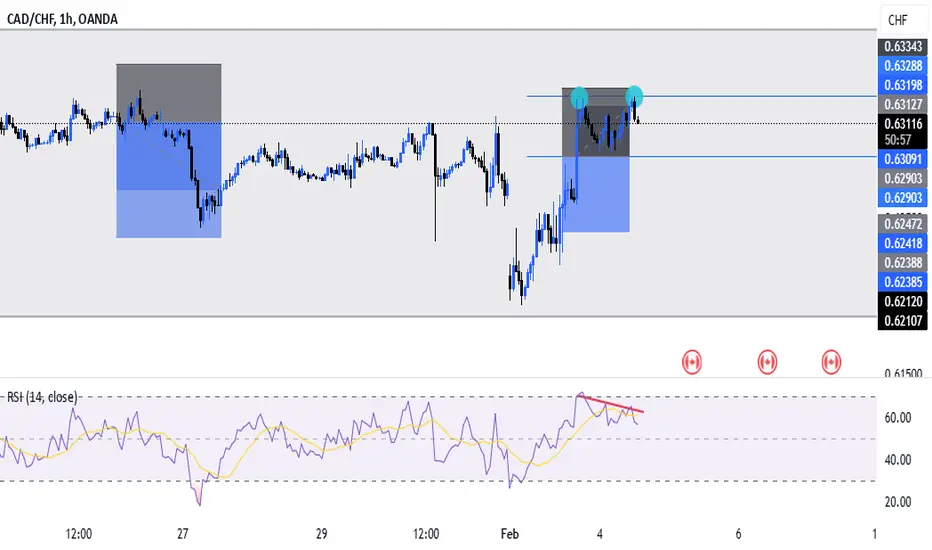
CADCHF Will Go Down! Short!
Please, check our technical outlook for CADCHF.
Time Frame: 1h
Current Trend: Bearish
Sentiment: Overbought (based on 7-period RSI)
Forecast: Bearish
The market is testing a major horizontal structure 0.631.
Taking into consideration the structure & trend analysis, I believe that the market will reach 0.627 level soon.
P.S
Overbought describes a period of time where there has been a significant and consistent upward move in price over a period of time without much pullback.
Like and subscribe and comment my ideas if you enjoy them!

cadchf new york trade idea set up form :
sweep sellside in 4h after 4h bisi failled to expande and run the sellside .i anticpate the price will bach to trade in the 4h bisi and it is my dol after makin a fva in 1h .
the only reason making me cancel this trade is price sweeping the 4h candle and make a displacment up.

CADCHF SHORT TERM REVERSALTechnically:
CADCHF printing double top.
CADCHF printing bullish divergence.
CADCHF "📉 CADCHF Trade: Missed Entry by Pips, Awaiting Re-Entry 🎯
Missed my initial entry on CADCHF by a few pips. Now patiently waiting for a re-entry opportunity at a favorable price point. Sticking to the plan and staying disciplined. Let's see how it unfolds. 🔄
#Forex #CADCHF #TradingPatience"
Sources
