CADCHF Technical & Order Flow AnalysisOur analysis is based on a multi-timeframe top-down approach and fundamental analysis.
Based on our assessment, the price is expected to return to the monthly level.
DISCLAIMER: This analysis may change at any time without notice and is solely intended to assist traders in making independent investment decisions. Please note that this is a prediction, and I have no obligation to act on it, nor should you.
Please support our analysis with a boost or
comment!
CADCHF trade ideas
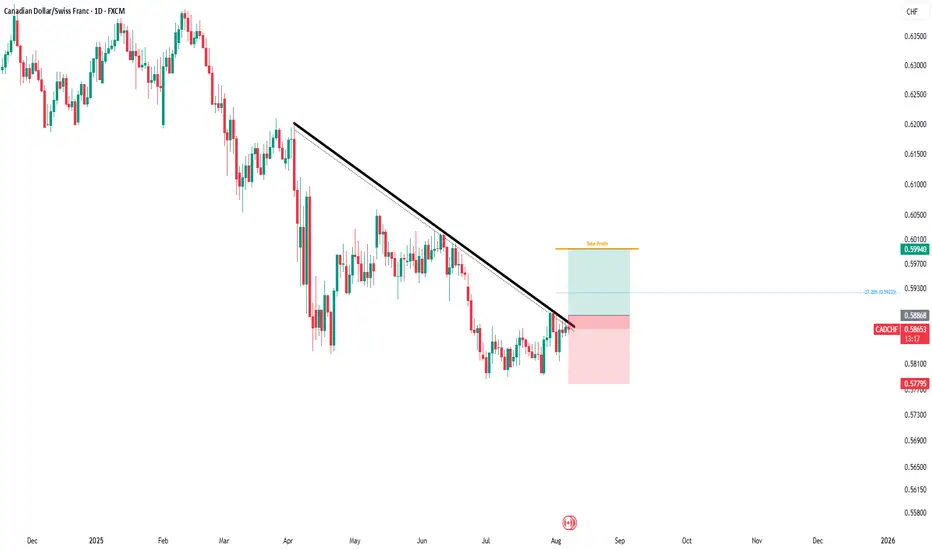
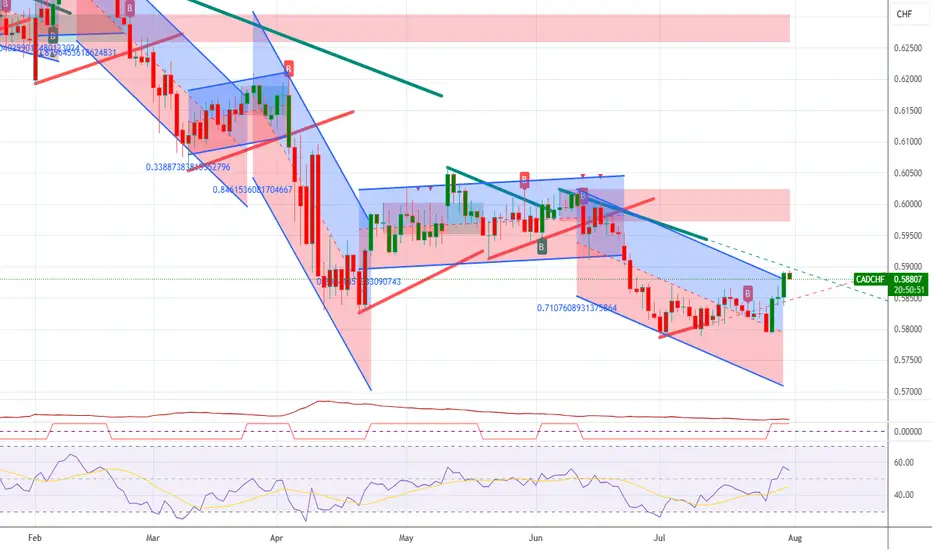
CAD/CHF - LongCAD/CHF has established a well-defined bullish channel, with price action suggesting further upside momentum. Technical projections indicate a probable advance toward the –27% Fibonacci extension level, which aligns with our breakeven target and serves as the immediate upside objective.
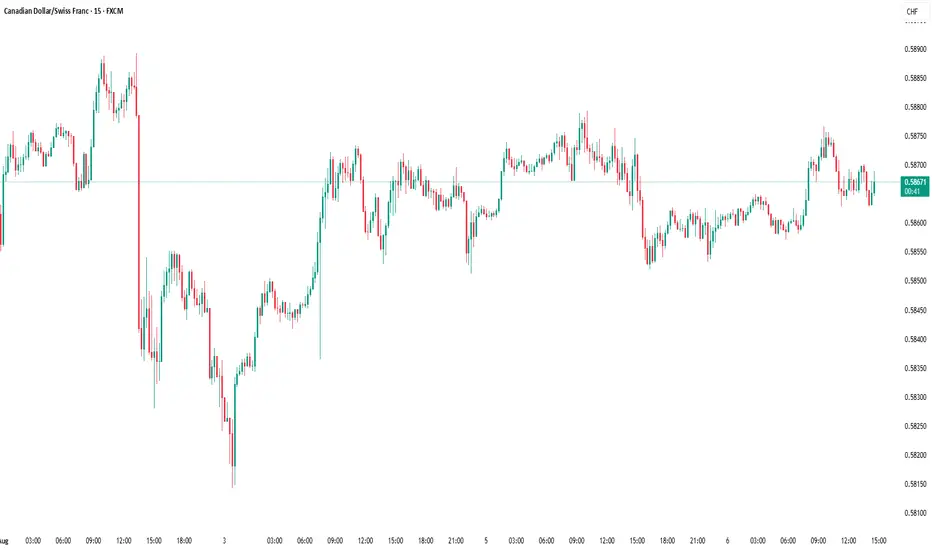
Shorting CADCHF from current price 0.5865 with a very tight stopMy stop loss is 0.5872, roughly 6 pips from entry price. Take profit is open for now. The 4 Hour candle is bearish, and this idea is also supported by minor resistance on 15 minutes.
CADCHF Bearish IdeaPrice has recently tapped a supply zone on the 1-hour timeframe and is now forming a Distribution Schematic Phase 2. Based on current market structure and order flow, we expect a continuation to the downside.

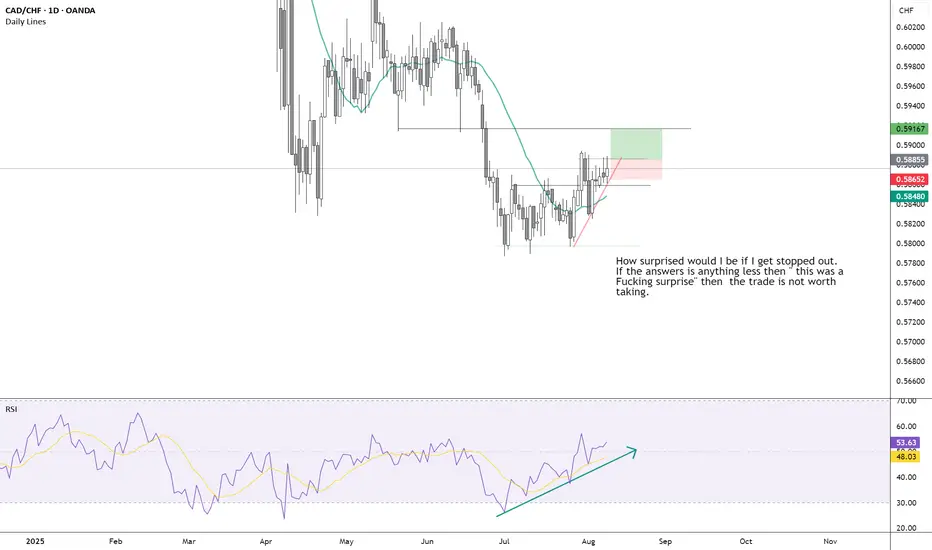
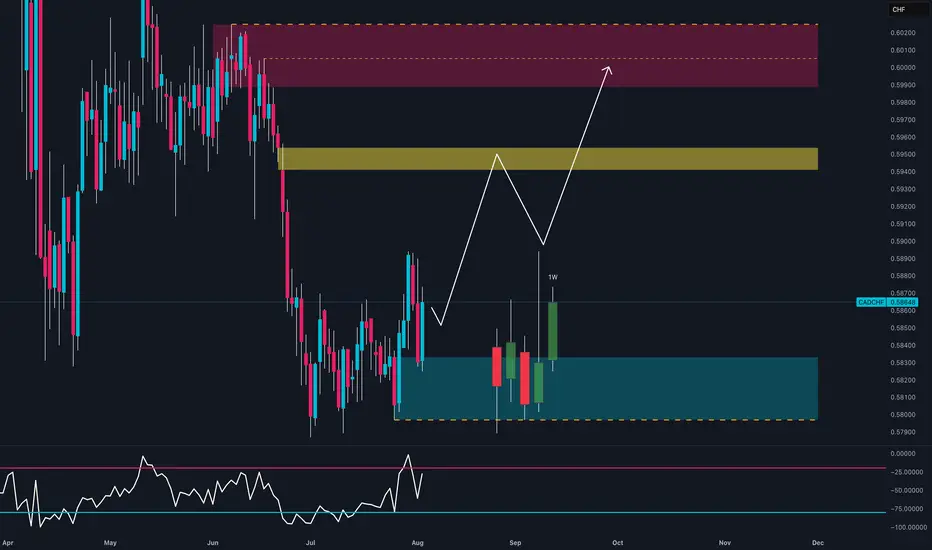
Everyone’s Short on CAD… But This Is Why I’m Going Long📊 CAD/CHF – August 4th, 2025 | Tactical Long Bias
🔹 Technical Outlook
The daily chart shows:
Strong bullish reaction within a weekly demand zone (0.5800–0.5830), confirmed by multiple lower wicks → growing buying pressure.
Weekly RSI bouncing out of oversold → potential mid-term reversal signal.
Structure may be shifting with a first target at 0.5950 (intermediate zone) and second target at 0.6000–0.6030 (major supply).
Recent bullish engulfing broke out of inside candle sequence → active technical trigger.
🧠 Commitment of Traders (COT) – July 29
Non-Commercials:
CAD: Aggressive increase in shorts (+3,888) and reduction in longs (-2,222) → heavily bearish speculative positioning.
CHF: Increase in longs (+936) and decrease in shorts (-1,095) → net bullish sentiment on CHF.
📌 However, CAD’s overstretched short positioning may lead to technical short-covering, especially if CHF starts to lose momentum.
📈 Seasonality – August
CHF: Range-bound or weak in August across all timeframes (20y, 15y, 10y).
CAD: Mild seasonal strength in August, especially on the 2y and 5y outlook.
➡️ Seasonal bias supports a tactical long on CAD/CHF during the first half of August.
✅ Trading Outlook
📌 Tactical Bias: LONG
🎯 First Target: 0.5950 → mid-level reaction zone.
🛑 Invalidation: below 0.5800 (demand breakdown).
🧠 Confluences: demand zone + RSI reversal + extreme COT positioning + seasonal support.
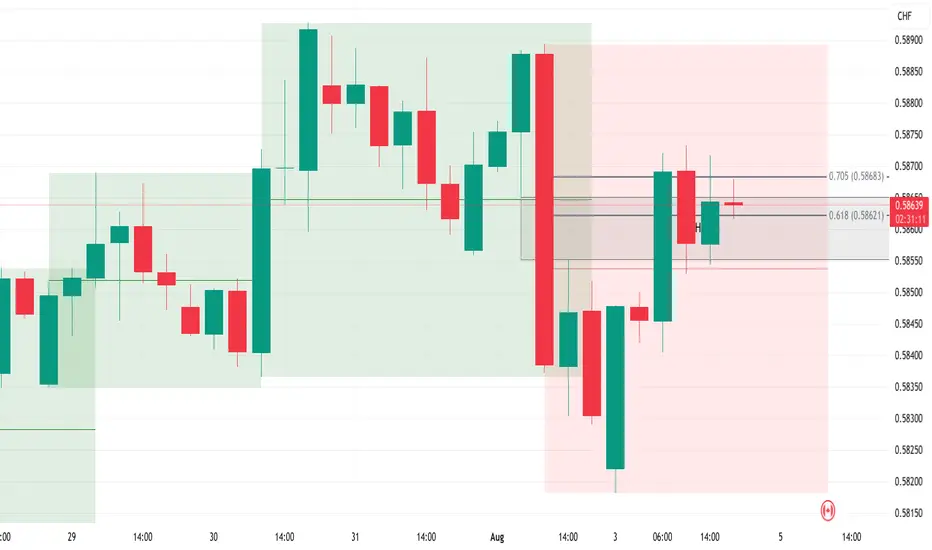
SELL trade using FVG and FIB levelSELL Opportunity on , price is currently within the 4hFVG and has r reacted to the .705 fib level , looking for lower time frame confirmation to go short
Bullish Trade Idea for ^CADCHFBullish Case
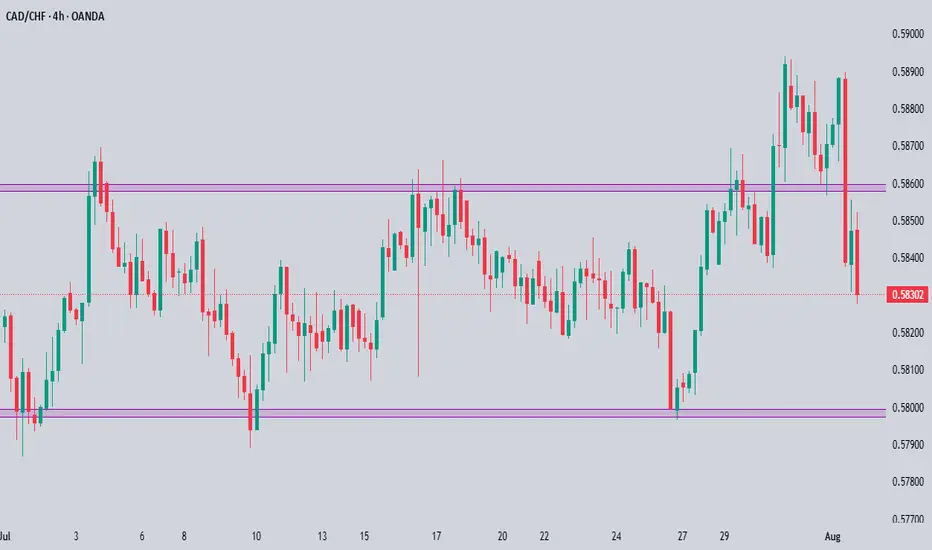
Consolidation at Key Support: Price has been consolidating between 0.579-0.583 for several weeks, showing resilience at this level. This suggests a potential exhaustion of the downtrend.
Higher Lows Formation: Looking at the recent 4-hour chart, we can see a series of higher lows forming since July 30th, indicating increasing buying pressure.
Potential Double Bottom: The price action in late July shows a potential double bottom formation around 0.579-0.580, which is a classic reversal pattern.
Momentum Shift: Recent price action shows increased volatility with bullish candles gaining more ground than bearish ones, suggesting a potential shift in momentum.
Trade Setup
Entry Strategy:
Primary Entry: Buy at current market price (0.585-0.586)
Alternative Entry: Wait for a pullback to 0.582-0.583 support zone and enter on signs of bullish rejection (hammer, engulfing)
Stop Loss:
Place stop loss below the recent low at 0.578 (approximately 0.577 for buffer)
This represents a risk of about 80-90 pips
Take Profit Targets:
First Target: 0.595 (Key resistance level) - 100 pips profit
Second Target: 0.608-0.614 (Strong demand zone identified earlier) - 230-290 pips profit
Final Target: 0.628-0.635 (Supply zone) - 430-500 pips profit
Risk-to-Reward Ratio:
First target: 1:1.25
Second target: 1:2.9
Final target: 1:5.4
Trade Management
Partial Profit Taking: Consider taking 50% off at first target, 30% at second target, and let 20% run for the final target.
Stop Loss Adjustment: Move stop loss to breakeven after price reaches halfway to first target (around 0.590).
Time Frame: This is a medium-term swing trade with an expected duration of 3-8 weeks.
Catalysts to Watch
Swiss National Bank Policy: Any dovish signals from the SNB could weaken CHF and accelerate the bullish move.
Canadian Economic Data: Strong Canadian economic data, particularly in energy and commodities sectors, could strengthen CAD.
Risk Sentiment: Improvement in global risk sentiment typically benefits CAD over the safe-haven CHF.
Warning Signs to Exit Early
Break Below Support: If price decisively breaks below 0.578 with increased momentum.
Failure to Make Higher Highs: If price action fails to continue the pattern of higher highs and higher lows on the 4-hour chart.
Rejection at 0.590: Strong rejection at the 0.590 level could indicate the bullish momentum is fading.
This bullish trade idea for ^CADCHF is based on technical evidence of a potential trend reversal after a prolonged downtrend. The favorable risk-to-reward ratio makes this an attractive opportunity, with multiple profit targets allowing for flexible trade management.

CAD/CHF REASONS FOR PASSINGThis was one of those “almost” trades — the kind that looks good at first glance and tempts most traders to jump in.
We had:
✅ A strong, clearly respected support zone
✅ A breakout and retest
✅ A solid bullish engulfing candle
But with the VMS strategy, that’s not enough.
We also require volume and momentum confirmation — and in this case, those critical signals were missing. No alignment, no trade.
Early in my journey, the almost trades were the ones that kept catching me. They look close enough to take — until you realize they don’t meet all your criteria. That’s where discipline makes the difference.
By requiring volume and momentum to confirm the setup, you're not just trading a pattern… you're trading with strength and intention.
This is the kind of pass that protects your edge.

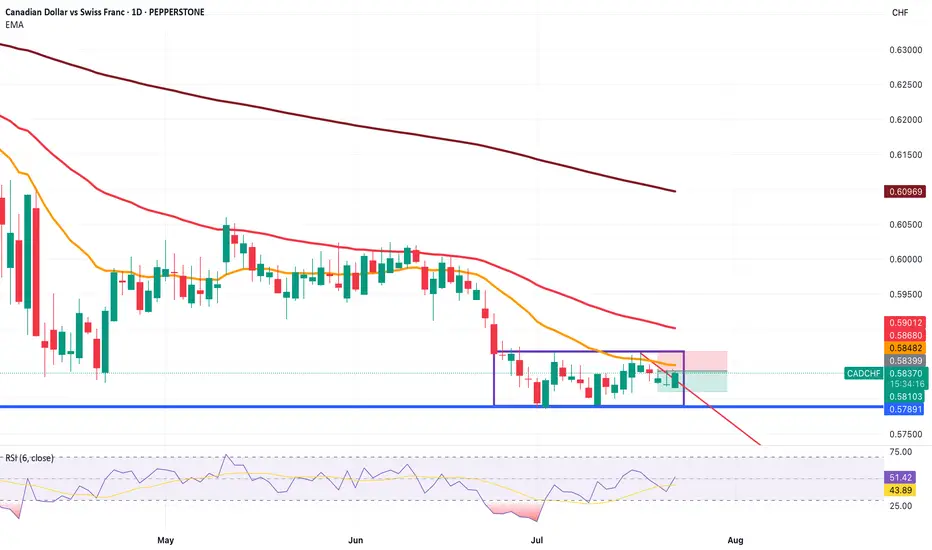
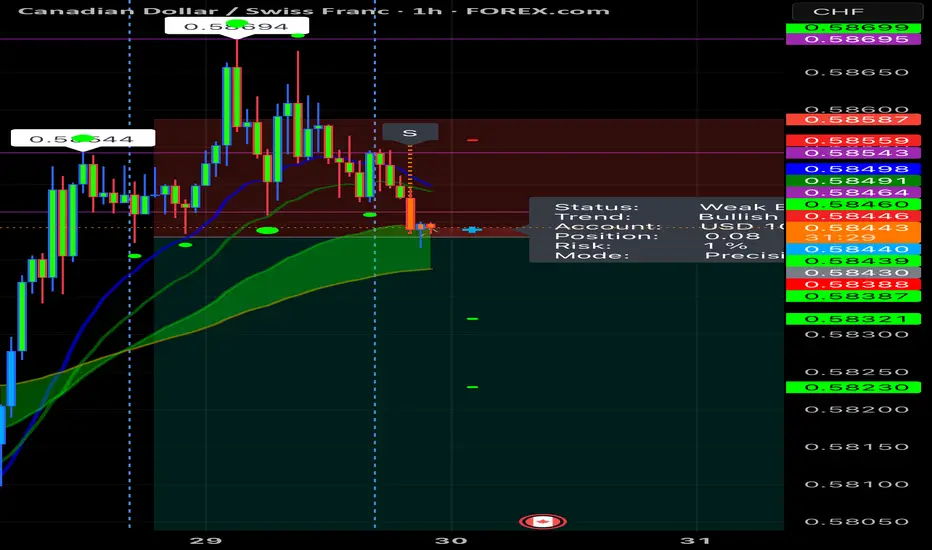
CADCHF sell trade taken to continue the downtrendCADCHF has been in a nice downtrend for a while now.
Once I saw that price bounced off the 20 EMA, I entered into a sell trade.
I've marked my entry, SL and TP.
Let's see how this trade plays out.
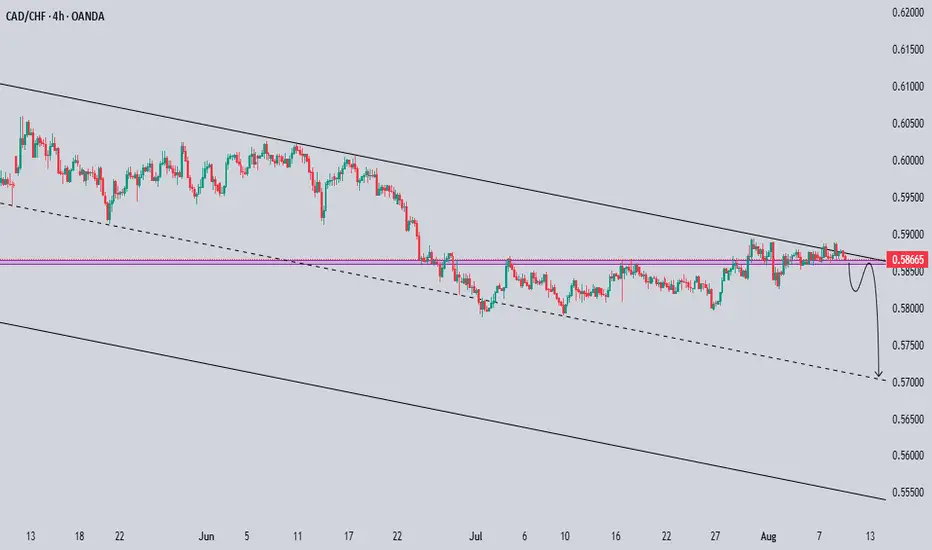
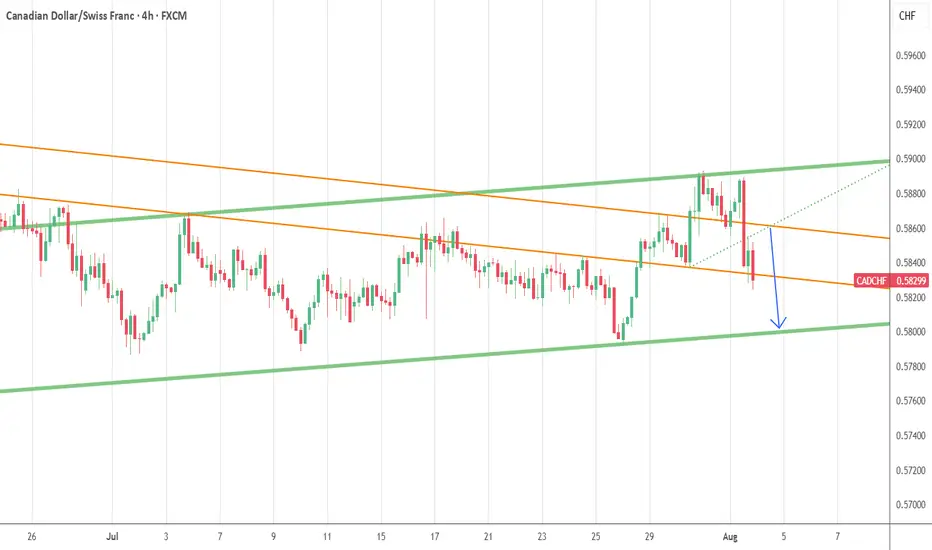
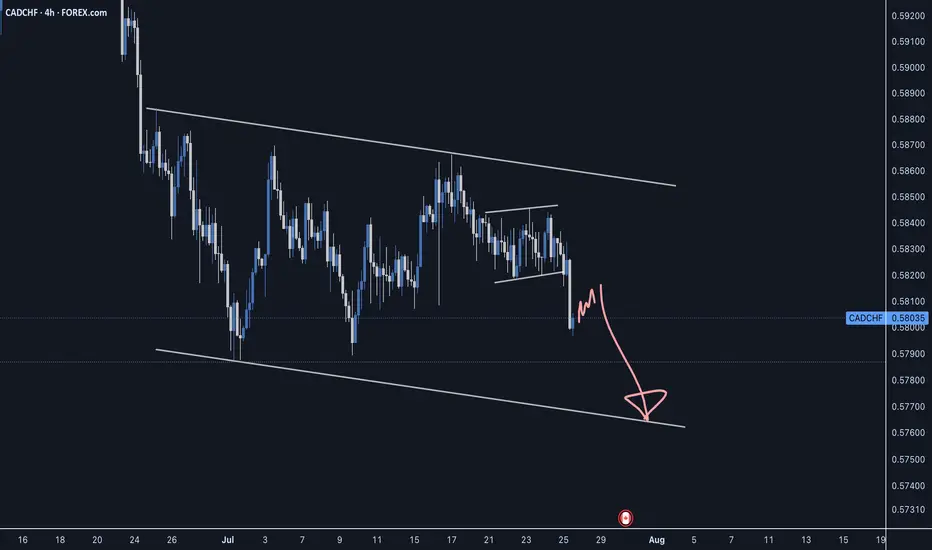
CADCHF--SHORT--02_08_25--Short term SELL opportunity
--entry: from upper side of orange channel
--TP: bottom side of green channel
CADCHF Technical & Order Flow AnalysisOur analysis is based on a multi-timeframe top-down approach and fundamental analysis.
Based on our assessment, the price is expected to return to the monthly level.
DISCLAIMER: This analysis may change at any time without notice and is solely intended to assist traders in making independent investment decisions. Please note that this is a prediction, and I have no obligation to act on it, nor should you.
Please support our analysis with a boost or comment!
sell cadchfwe reach to a resistance and then break the last low and pullback to broken low and then we enter....
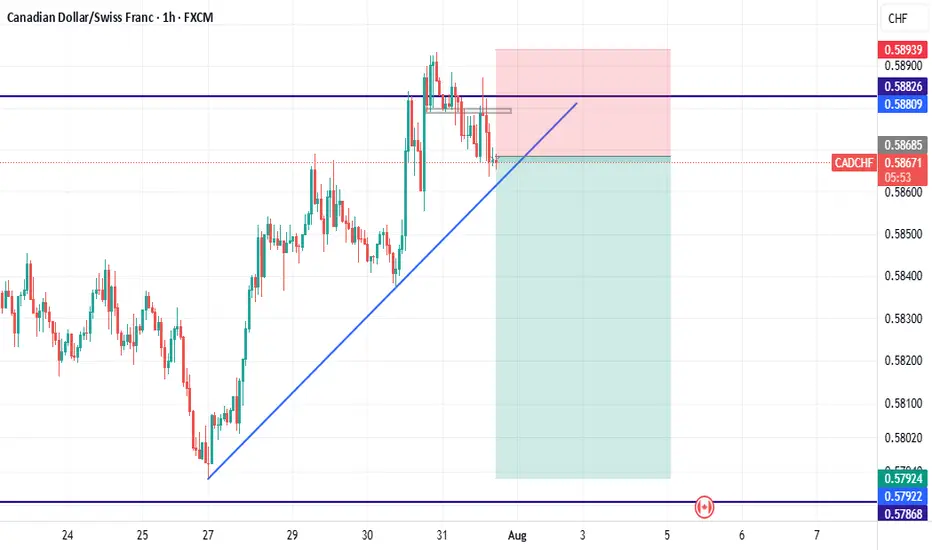
CADCHF 4HThis CADCHF 4H chart shows a clear market structure shift (MSS) from bearish to bullish, confirming a possible trend reversal. Price has broken structure to the upside and is now pulling back into a bullish order block zone.
What’s likely to happen:
- Price is expected to retest one of the order blocks (preferably the second/lower one) before continuing upward.
- The green zone marks the potential take profit or target area.
What to do next:
1. Wait for a bullish reaction from one of the order blocks — like a bullish engulfing candle or a strong rejection wick.
2. Once confirmed, enter a buy trade with SL below the order block and TP around the top of the green zone.
3. Manage your risk wisely — don’t rush the entry. Wait for confirmation.
This setup is clean and shows smart money interest. Let the market come to your zone. Patience = precision.

Cad/chf sellI can see a stall in the cad dollar at this zone and is looking set for a pullback , I will be selling at 58,500 and looking for profits down at 57.876 a 0.74% profit 📈

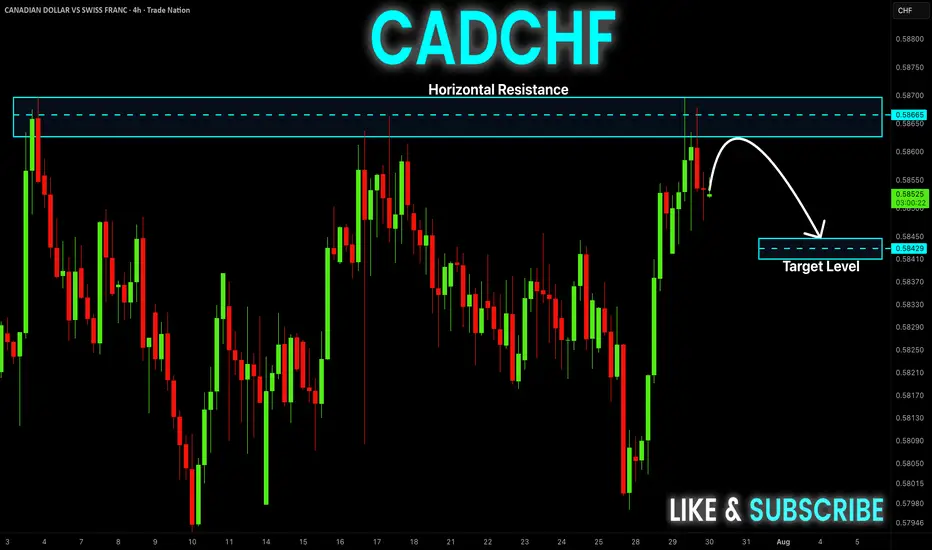
CAD-CHF Local Short! Sell!
Hello,Traders!
CAD-CHF went up and
Made a retest of the
Horizontal resistance
Around 0.5870 and we
Are already seeing a bearish
Pullback so we will be
Expecting a further
Bearish correction
Sell!
Comment and subscribe to help us grow!
Check out other forecasts below too!
Disclosure: I am part of Trade Nation's Influencer program and receive a monthly fee for using their TradingView charts in my analysis.
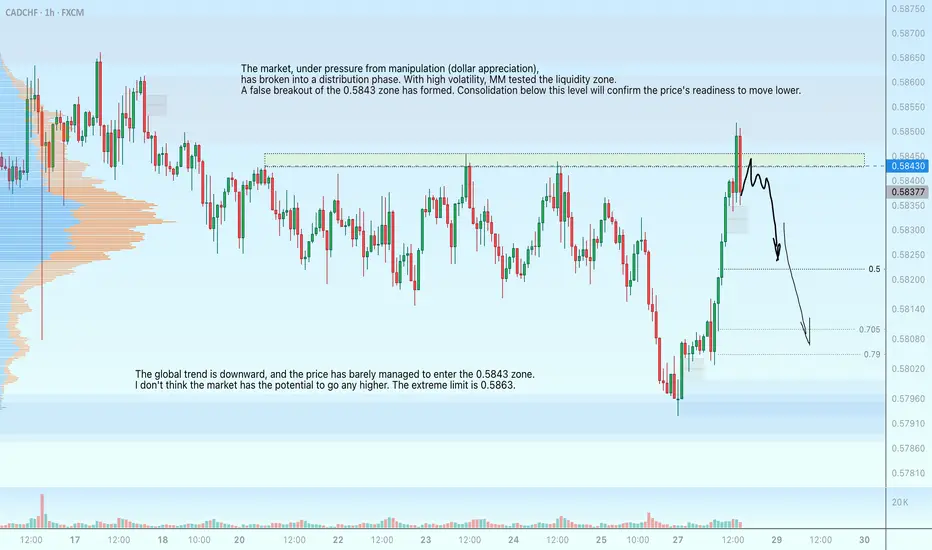
CADCHF - manipulative liquidity grab at 0.5843 before the dropThe market, under pressure from manipulation (dollar appreciation), has entered a distribution phase. Amid high volatility, MM tested the liquidity zone. A false breakout of the 0.5843 zone has formed. Consolidation below this level will confirm the price's readiness to move lower.
The global trend is downward, and the price has barely managed to enter the 0.5843 zone. I don't think the market has the potential to go any higher. The extreme limit is 0.5863.
CADCHF: Market of Sellers
The recent price action on the CADCHF pair was keeping me on the fence, however, my bias is slowly but surely changing into the bearish one and I think we will see the price go down.
Disclosure: I am part of Trade Nation's Influencer program and receive a monthly fee for using their TradingView charts in my analysis.
❤️ Please, support our work with like & comment! ❤️

CAD/CHF Falling Toward 0.5740–0.5720: Buyers May Step In1. Trend Direction :
CADCHF is currently bearish — the price is going down consistently.
2. Price Action :
The pair is still falling and has not shown signs of reversing yet.
3. Target Area for Drop :
I expect the price to continue falling toward the 0.5740 to 0.5720 zone.
→ This is a support area, where price may slow down or bounce.
4. Support Level Importance :
This zone has acted as support in the past, meaning buyers might step in again here.
5. Buy Interest Zone :
If the price holds above 0.5720 and shows signs of strength, buying interest could return.
6. Possible Reversal :
From this support zone, there's a chance that CAD/CHF may reverse and move back up.
7. What to Watch For :
Look for bullish price action (like strong candles or a break of minor resistance) in the support area before considering long (buy) positions.

CADCHF - Sellers still in controlCADCHF has been moving within a reversal structure which could make another swing low to complete this pattern before the next move up.
Good Luck
CAD-CHF Local Rebound Ahead! Buy!
Hello,Traders!
CAD-CHF made a retest
Of the horizontal support
At 0.5797 from where we
Are already seeing a bullish
Reaction so we will be
Expecting a further local
Bullish move up
Buy!
Comment and subscribe to help us grow!
Check out other forecasts below too!
Disclosure: I am part of Trade Nation's Influencer program and receive a monthly fee for using their TradingView charts in my analysis.
