CADCHF LongThe Canadian Dollar (CAD) presents a strong long opportunity against the Swiss Franc (CHF) heading into Q1 2025. Supported by higher interest rates (BoC at 3.25% vs. SNB at 1.75%), stronger GDP growth forecasts (1.8% for Canada vs. 1.3% for Switzerland), and rising commodity prices, CAD stands to benefit from global economic optimism. Additionally, Canada's reliance on oil exports aligns well with improving demand in global markets. However, risks remain, including potential oil price declines, a dovish pivot by the BoC, or heightened geopolitical uncertainty, which could favor the CHF as a safe-haven asset. We will look to monitor oil price trends, central bank communications, and global risk sentiment closely. Overall, the macroeconomic backdrop supports a bullish bias for CADCHF, offering an attractive long setup
What’s your take on CADCHF? Share your thoughts below! 💬
#CADCHF #ForexTrading #MacroAnalysis #ForexStrategy #TradingView #CurrencyTrading #CanadianDollar #SwissFranc #TechnicalAnalysis #FundamentalAnalysis #FXTrading
CADCHF trade ideas


CAD_CHF WILL FALL|SHORT|
✅CAD_CHF has retested a
Resistance level of 0.6260
And we are already seeing a
Bearish reaction so we will
Be expecting a further
Bearish move down
SHORT🔥
✅Like and subscribe to never miss a new idea!✅

CADCHF BULLISHWe have high opportunity for bullish because of:
-We have Bat harmonic pattern.
-Have a downtrade channel which broken before touch lower side.
-The price bounced back from liquidity area.

The Bigger PictureThis pair has been depreciating for years, but I think 2025 at least will be a strong year for CAD.

we waiting for the correction to completeif the price corrects about 35 pips to the upside, when it reaches the key zone, we'll wait for a sell setup confirmation to take a sell trade....

CADCHF sells!!!Supply zone following sufficient drop with well established bearish trend. engulf spotted in region to confirm presence of sellers

CAD-CHF Local Bullish Bias! Buy!
Hello,Traders!
CAD-CHF will soon hit a
Horizontal support of 0.6190
And as it is a strong key
Level we will be expecting
A local bullish rebound
Buy!
Comment and subscribe to help us grow!
Check out other forecasts below too!

CAD_CHF LONG FROM SUPPORT|
✅CAD_CHF fell again to retest the support of 0.6190
But it is a strong key level
So I think that there is a high chance
We will see a bullish rebound and a move up
LONG🚀
✅Like and subscribe to never miss a new idea!✅

CADCHF BUY OPPORTUNITY!Price currently traded and closed at 0.62135 (support level) i anticipate a buy opportunity to develop away from this level. Our target profit is 0.64037

SHORT BUY/LONGER TERM SELLPrice headed for LL and LH tested 62611 area and continued to form new lows. Right now price is heading back to 62611/62381 areas for liquidity to build momentum for a long drop down.
Target 61904 as take profit

CADCHF POSSIBLE BUY OPPORTUNITY!Price trades at 0.62294 and this is a good opportunity to go long from the current market price. Our take profit target is 0.62612

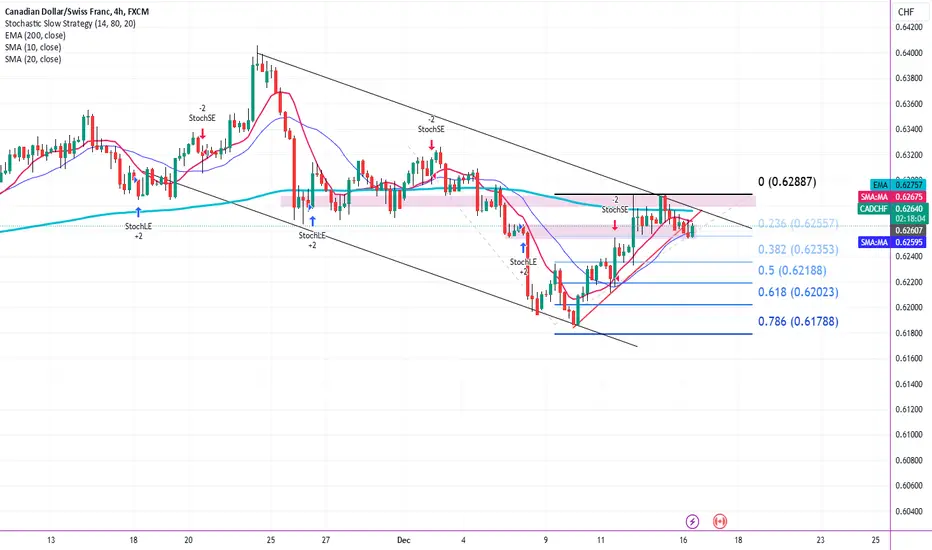
CADCHF 19/12/2024Weekly:
-Expecting a bearish continuation lower to the next PD array.
Daily:
-Bearish W pattern.
-Order flow leg.
4H:
-Bearish W pattern.
-Order flow leg.
1H:
-Previous FVA is acting as resistance,

CADCHF - Short from bearish OB !!Hello traders!
‼️ This is my perspective on CADCHF.
Technical analysis: Here we are in a bearish market structure from 4H timeframe perspective, so I look for a short. After break of structure I expect price to make a retracement to fill the imbalance higher and then to reject from bearish OB.
Like, comment and subscribe to be in touch with my content!

Sell cadchef at cmpPrice broke a significant sand resistant we are going down with good risk management

Buy cadchefThe pair approaching our demand zone wich ha s confluence of quasimodo level buying there is good

CADCHF Smart Money Concepts (SMC)In modern trading, especially within the Smart Money Concepts (SMC) methodology, terms such as Order Blocks, Imbalances, Breaker Blocks, and Inverted FVG (Fair Value Gaps) are widely used. Below is a detailed explanation of each:
---
1. Order Blocks
An Order Block is a zone on the chart where large institutional investors have left "traces" of their operations, meaning a place where there was a concentration of buying or selling activity. It is typically the last candle before a significant price movement.
Bullish Order Block: The last bearish candle before a strong upward movement.
Bearish Order Block: The last bullish candle before a strong downward movement.
How to use:
Price often returns to order blocks before continuing the trend.
Order blocks are used as potential entry or exit zones.
Example:
If the market is falling and a sharp reversal upwards begins, the last red candle before this rise is the bullish order block.
---
2. Imbalances
An Imbalance is a zone on the chart where demand and supply were sharply uneven, creating "gaps" in the market structure.
These zones are often referred to as FVG (Fair Value Gaps)—an area between the wicks of the first and last candles of three consecutive candles, where the middle candle does not overlap with the first or third.
It is believed that the market tends to fill these gaps, meaning the price often returns to these zones before continuing its movement.
How to use:
Imbalances can serve as a reference for identifying potential retracement zones.
Enter a position when the gap is filled.
Example:
In an uptrend, if the price rises sharply, creating a gap between the wicks of candles, traders can expect the price to return to this area.
---
3. Breaker Blocks
A Breaker Block is a zone that forms when the market breaks a key support or resistance level and begins moving in the opposite direction. They appear where an order block was "broken."
Breaker Blocks indicate that the previously dominant trend has been broken, and the market is preparing for a new movement.
They can also be used to filter valid order blocks.
How to use:
After an order block is broken, the former support/resistance zone can serve as an entry point after a retest.
Used to identify trend reversals.
Example:
In an uptrend, if the price breaks below the previous bullish order block, it becomes a bearish breaker block.
---
4. Inverted FVG (Inverted Fair Value Gap)
An Inverted FVG is a zone where the market provides excessive liquidity in the opposite direction, creating an opportunity for "smart money" to trap traders in the wrong movement.
An Inverted FVG occurs when the market "absorbs" liquidity, making traders believe the trend is continuing, but it is actually a manipulation before a reversal.
It is used to analyze price manipulation and find entry points against the "trap."
How to use:
Enter after the price has covered the FVG zone and confirmed a reversal.
Inverted FVGs often appear in zones that collect stop losses.
Example:
In an uptrend, the price sharply breaks a resistance zone (creating an FVG) but then reverses back and moves downward.
---
Conclusion
Order Blocks and Breaker Blocks help identify zones where large players may enter the market.
Imbalances highlight areas where the price might return to balance demand and supply.
Inverted FVGs help traders avoid traps set by large players and enter the market more strategically.

CAD/CHF (Trade Recap), AUD/JPY Short, NZD/JPY Short and EUR/JPYAUD/JPY Short
Minimum entry requirements:
• Tap into area of value.
• 1H impulse down below area of value.
• If tight 5 min continuation follows, reduced risk entry on the break of it.
• If tight 15 min continuation follows, 5 min risk entry within it, or reduced risk entry on the break of it.
NZD/JPY Short
Minimum entry requirements:
• If tight 15 min continuation forms, 5 min risk entry within it, or reduced risk entry on the break of it.
EUR/JPY Short
Minimum entry requirements:
• 1H impulse down below area of value.
• If tight 15 min continuation follows, 5 min risk entry within it, or reduced risk entry on the break of it.

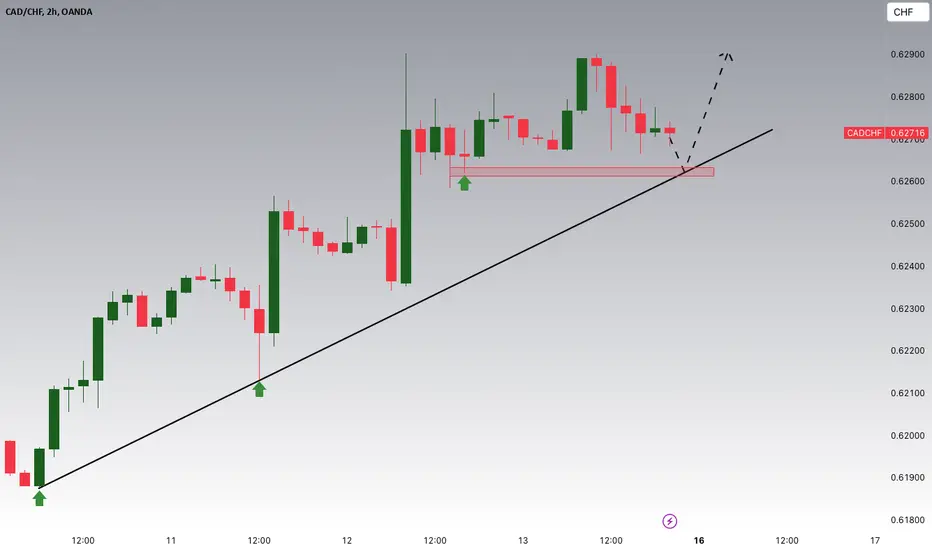
CADCHF 16/12/2024Weekly:
-Sellside liquidity taken.
Daily:
-Price found support at the previous FVA.
-Next target could be the daily high.
4H:
-Bullish Order flow.
-Inverse H&S pattern.
-IC.

CADCHF POSSIBLE SELL OPPORTUNITY!Price just completed a pullback and it’s set to drop back to a low level of 0.61721 a sell opportunity is envisaged from the current price. Stop loss is set 30pip above entry price.

CADCHF - POTENTIAL SHORTPotential short idea building here.
Area of 0.6280 providing resistance here in areas of previous support in November
Descending channel
Before entry, I am looking for the area of support at 0.6020 to be broken to suggest strong bearish continuation
Also looking for the small uptrend support line (red trend line) within the channel to be broken as a further suggestion of bearish movement
Entry at 0.6250 with stop at 0.6300
#009 NEW DCA CADCHF Buy Higher High Higher LowPrice is making higher highs and higher lows as seen on the chart and so I bought.
It seems that price is also at the minor resistance area, but all is fine.
TP and positions will be shown in the screenshot below.
1603SGT 13122024

CADCHF Potential UpsidesHey Traders, in the coming week we are monitoring CADCHF for a buying opportunity around 0.62600 one, CADCHF is trading in an uptrend and currently is in a correction phase in which it is approaching the trend at 0.62600 support and resistance area.
Trade safe, Joe.