CAD/CHF LONG FROM SUPPORT
Hello, Friends!
We are now examining the CAD/CHF pair and we can see that the pair is going down locally while also being in a downtrend on the 1W TF. But there is also a powerful signal from the BB lower band being nearby indicating that the pair is oversold so we can go long from the support line below and a target at 0.650 level.
✅LIKE AND COMMENT MY IDEAS✅
CADCHF trade ideas

Signal Alert: CAD/CHF Move - BuyDear Traders,
We have identified a promising opportunity in the CAD/CHF currency pair based on our analysis using the EASY Quantum Ai strategy. Below are the specifics for the recommended trade:
Direction: Buy
Enter Price: 0.63847
Take Profit: 0.64038333
Stop Loss: 0.63614333
Justification:
1. Technical Analysis: Recent price action shows a strong bullish pattern, indicating the potential for upward movement. Key support and resistance levels have been respected, reinforcing a positive trend direction.
2. Fundamental Factors: The Canadian economy has shown resilience in recent economic reports, while Switzerland's outlook remains stable. Monetary policy divergence between the Bank of Canada and the Swiss National Bank also supports a bullish outlook for CAD/CHF.
3. Market Sentiment: Traders' sentiment data shows an increase in long positions in CAD, suggesting that market participants expect the Canadian dollar to strengthen against the Swiss franc.
Our sophisticated AI-driven strategy considers these factors to generate high-probability trading signals. Adhering to the recommended entry, take profit, and stop loss levels can help manage risk and maximize potential returns.
Happy Trading!
EASY Quantum Ai Team

CADCHFaccording to SMC cad chf is going down but i think it may re test the FVG so i want to buy it to make point from the retest then i will sell from FVG for long term.

buyGood area for buy
Do not read the rest of the text,
I am writing this only to confirm the trading view
It seems that if we don't write a few words, our analysis will not be confirmed
So ICT
IFC
DTG
LMF
And......

CADCHF - Bearish BehaviorThe currency pairs are telling that the pair is still going down with no serious trend divergence. The trade plan is set accordingly. Let's hope the plan works!


CAD/CHF Buy Trade OpportunityAttention Traders!
Here's an exciting trade setup for the CAD/CHF currency pair. This opportunity involves a buy trade with a well-defined entry range and profit targets to maximize your potential gains.
Trade Details:
Buy Range: Enter the trade when the price is between 0.6488 and 0.6490 .
Profit Targets:
First Target: 0.65750 . Set this as your initial level to take some profits.
Second Target: 0.65900 . Aim for this level to maximize your returns.
Key Points to Consider:
Entry: Ensure you enter the trade within the specified range of 0.6488 to 0.6490 to optimize your potential profits.
Profit-Taking Strategy: Setting two profit targets allows for effective risk management and maximized gains. Close part of your position at 0.65750 to secure initial profits and aim for 0.65900 for additional gains.
Risk Management: Always consider your risk tolerance and use appropriate stop-loss orders to protect your investment in case the market moves against your position.
This structured approach ensures you have a clear plan for entering and exiting the trade, balancing potential profits with effective risk management.
Happy Trading!

Importance of zones!Hey traders, here is a great example of why I set specific zones for all my trades. When I do my analysis for the day, I create zones based off of strict support and resistance zones and trend line breaks as well. These zones and all my trades are based off the daily candle close. I choose to drop down to the 15 min chart but you can just go off the 4hr chart if it’s easier but you might not get as many trades. I always shoot for 5 pips but 8 out of 10 times price moves way farther. With 3 crazy kids I have to set targets and they are either gonna hit or stop out. I really hate losing so I try my damn best to make sure momentum is in my favor. For my trade set ups, typically what I would like to see is a daily candle closing bearish and the 4 hour candle closing bearish and vice versa. Discipline is a major key factor in my trading strategy something that I have acquired over the years. Stick to the plan and WAIT FOR IT! OANDA:CADCHF I could have 20 great trades lined up for the day and not one of them break my zone. It’s ok though, there’s always tomorrow. If price doesn’t break my zone by the end Tokyo session I’m out cuz the London session is just a bully that likes to go the opposite direction. I also cleaned up my chart so it’s easier to read both for you and myself. If I ever post an idea, I might just post my trade then go back into the comments and explain the details later. Happy trading. Aloha and much love

2607FRI - watchlist updatequick update on the 3 positions I am looking to execute on today should they shape up

Scalp em!So based on my analysis of price closes below 0.63718 we are looking to scalp! Scalp as much as you like. Even though price closed below my trend line it’s still not in my zone. Gotta stick with my strategy but don’t worry and be patient. Wait for it and it will come! OANDA:CADCHF

SHORT 7/25/24Daily downtrend, daily level of supply entry into December 2023 lows. 5.7:1 Risk/Reward.

CADCHF Going DownToday's Canada Economic Numbers were released:
CPI m/m - Actual below forecast
CPI y/y - Actual below forecast
We have seen CAD pairs move lower since the CPI numbers were released.
With further Swiss Franc strength, I expect this pair to target the 0.65 price level. Continued bearish pressure will lead to price moving towards 0.64.
Good luck guys :)

CADCHF - Look for a short !!Hello traders!
‼️ This is my perspective on CADCHF.
Technical analysis: Here we are in a bearish market structure from daily timeframe perspective, so I look for a short. My point of interest is if price make a retracement to fill the imbalance higher and then to reject from bearish order block + institutional mid figure 0.64500.
Like, comment and subscribe to be in touch with my content!

Harmonic PatternIn a long-term ascending trend and repeated correction that shows the pattern of three peaks. Now we see that the correction of this process has reached a key resistance, and according to the Fibonacci range, there is a possibility of correction in the opposite direction. Is it settlement time?

CADCHF BearishDaily Bias Bearish
Fundamental
CAD reduced interest rate to 4.5% , CHF with a lower interest rate but their currency is bullish.
CAD is bearish now.
Price action
Price breakout of Daily SR level to for a lower low. In H4 TF, there is a double top pattern formed before the breakout happened.
Setup short trade at broken H1 support level with SL above the swing high of double top pattern. Targeting next daily SR level below.

SELL TO BUY The pair is currently in a downtrend and heading to rest the previous all time low. For Now we are bearish

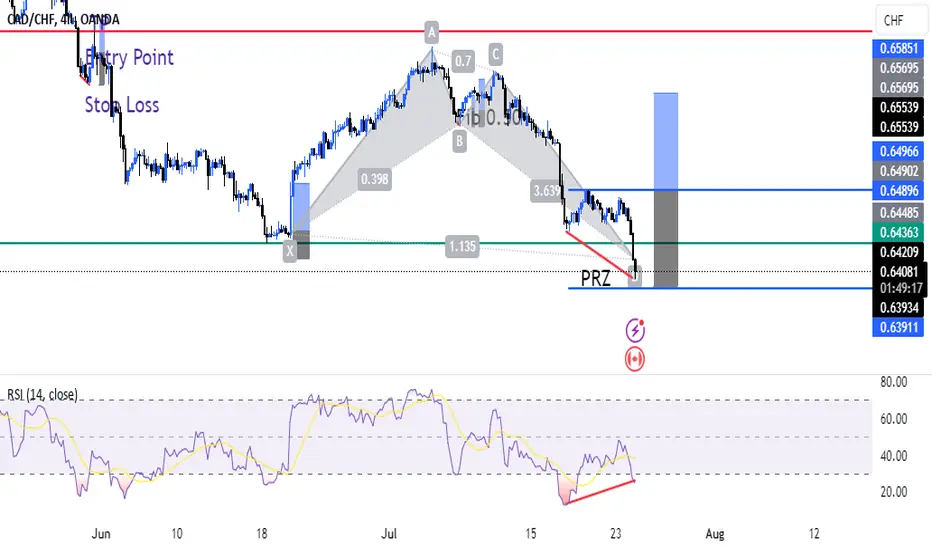
CADCHF IS PRINTING BEARISH HARMONIC CADCHF is printing bearish harmonic (CRAB) Pattern Point D is PRZ it also print bullish divergence so my trade plane is when it break the last lower high my buy stop placed
CAD/CHF BULLS WILL DOMINATE THE MARKET|LONG
Hello, Friends!
CAD/CHF downtrend evident from the last 1W red candle makes longs trades more risky, but the current set-up targeting 0.652 area still presents a good opportunity for us to buy the pair because the support line is nearby and the BB lower band is close which indicates the oversold state of the CAD/CHF pair.
✅LIKE AND COMMENT MY IDEAS✅

CAD/CHF BEARS ARE GAINING STRENGTH|SHORT
Hello,Friends!
We are now examining the CAD/CHF pair and we can see that the pair is going up locally while also being in a uptrend on the 1W TF. But there is also a powerful signal from the BB upper band being nearby, indicating that the pair is overbought so we can go short from the resistance line above and a target at 0.642 level.
✅LIKE AND COMMENT MY IDEAS✅

CADCHFThis pair has formed and Inverted CUP & HANDLE pattern.
In the context of a downtrend, it is continuation pattern.
To look at the projected target , consider the measured move.
Wait for confirmation of a downside break of the handle, before considering a short trade.

CADCHF MARKET CONDITION AHEAD OF BoC MONETARY POLICY REPORT!Price currently trade at 0.64608 level ahead of BoC monetary policy report coming up today by 2:30pm. A fall below 0.64354 could provide a buy opportunity at 0.63538

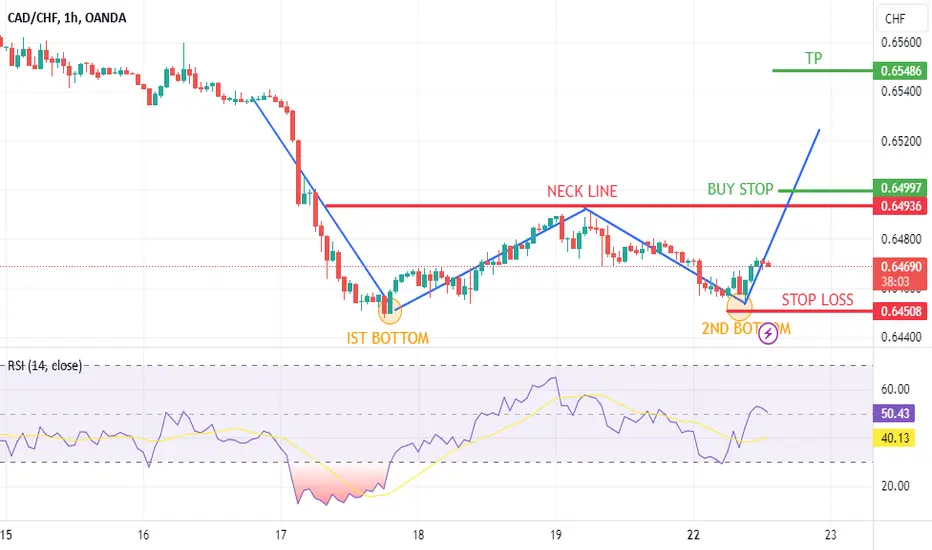
CADCHF DOUBLE BOOTOM REVERSAL PATTERNCADCHF was in downtrend on one hour time frame know the price has make double bottom pattern which is a reversal pattern buy stop order placed near neck line risk to reward ration is 1:1.
still sellDrawing the future path of this currency pair
The designated PRZ area is where I enter into buy
