Related currencies

EURCAD: More Growth Ahead 🇪🇺🇨🇦
EURCAD broke a resistance line of a bullish flag pattern yesterday.
A consequent confirmed Break of Structure BoS indicates
that the rise will most likely continue.
The next strong resistance is 1.61.
The market is going to reach that soon.
❤️Please, support my work with like, thank you!❤️
I

06.08.25 Morning ForecastPairs on Watch -
FX:GBPAUD
FX:EURAUD
FX:EURUSD
FX:EURCAD
A short overview of the instruments I am looking at for today, multi-timeframe analysis down to what I will be looking at for an entry. Enjoy!

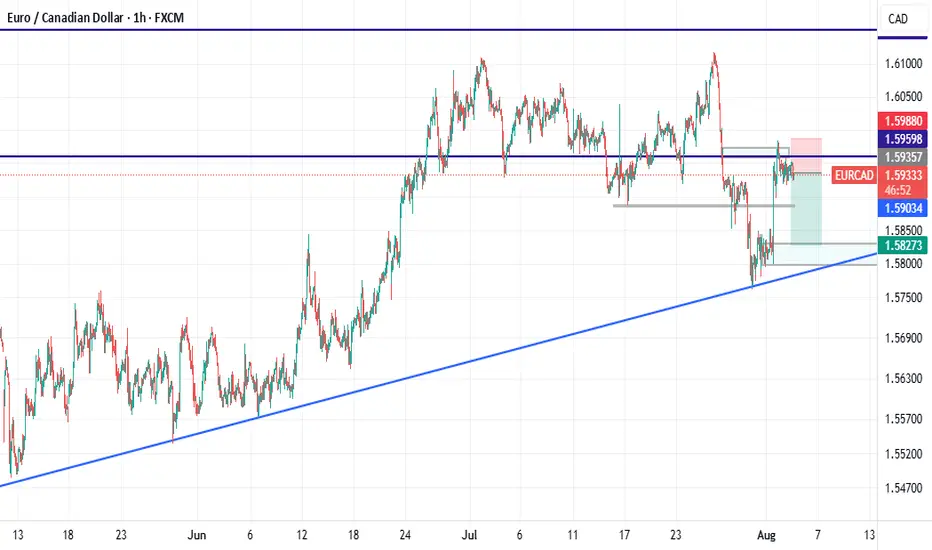
Could the price bounce from here?EUR/CAD has bounced off the pivot which is a pullback support, and could rise to the 1st resistanc,e which is a multi-swing high.
Pivot: 1.58922
1st Support: 1.57671
1st Resistance: 1.61066
Risk Warning:
Trading Forex and CFDs carries a high level of risk to your capital and you should only trad

EURCAD SELL SETUPWe should see continuations on this EURCAD to the down side from this breaker blck by next week
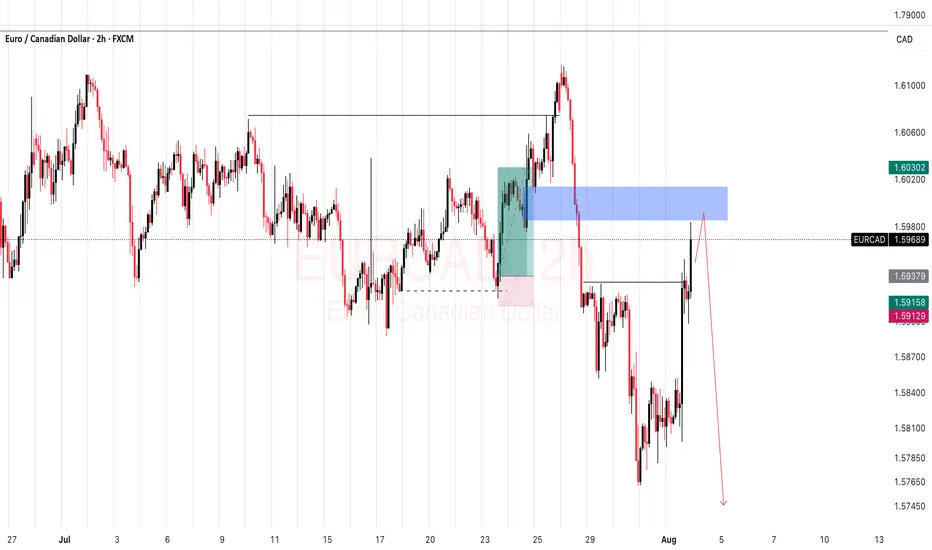
EURCAD ShortConfluence
1. Break and retest of the trendline
2. Order block in 1H
3. 61.8% Fib zone
It's a good spot to catch a clean 1:2. Wait for confirmation on either 1H or 2H timeframe to enter.
Good luck...

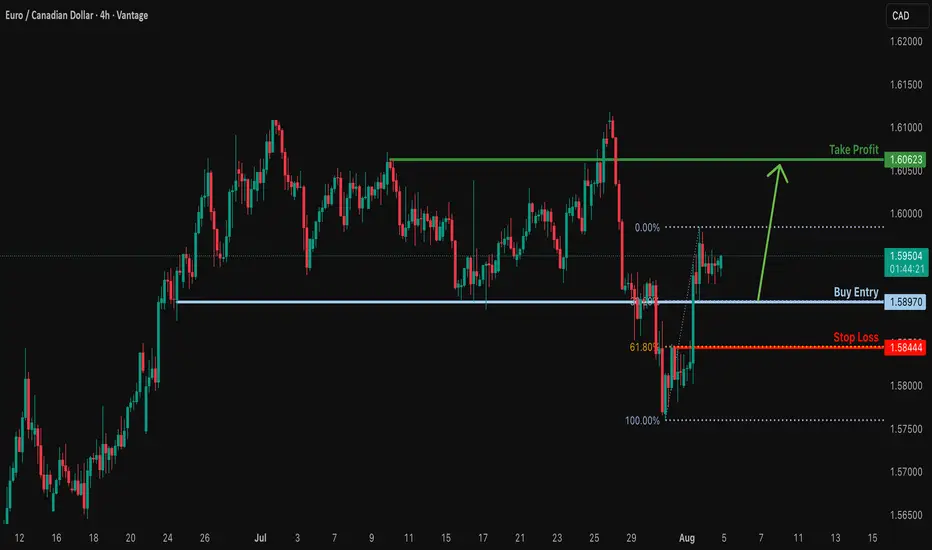
Bulllish bounce off?EUR/CAD is falling towards the support level which is a pullback support that aligns with the 38.2% Fibonacci retracement and could bounce from this level to our take profit.
Entry: 1.5897
Why we like it:
There is a pullback support that lines up with the 38.2% Fibonacci retracement.
Stop loss: 1.
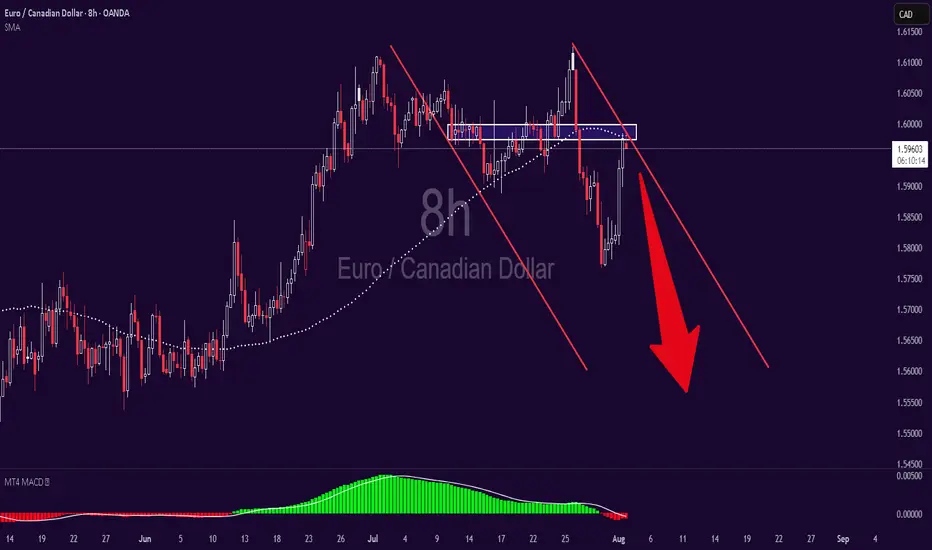
short of eurcadthe up trend is reversing and last HL broke and price pullback to it and we reach to a supply zone too...
EUR/CAD..ShortPrice retraced back to a major level that once was support now resistance multiple times in the past.
EURCAD Is Overbought!
HI,Traders !
#EURCAD is trading in a
Strong uptrend and the pair
Will soon hit a horizontal
Resistance of 149.200
So after the retest a
Local bearish pullback
Is to be expected !
Comment and subscribe to help us grow !

See all ideas
Summarizing what the indicators are suggesting.
Oscillators
Neutral
SellBuy
Strong sellStrong buy
Strong sellSellNeutralBuyStrong buy
Oscillators
Neutral
SellBuy
Strong sellStrong buy
Strong sellSellNeutralBuyStrong buy
Summary
Neutral
SellBuy
Strong sellStrong buy
Strong sellSellNeutralBuyStrong buy
Summary
Neutral
SellBuy
Strong sellStrong buy
Strong sellSellNeutralBuyStrong buy
Summary
Neutral
SellBuy
Strong sellStrong buy
Strong sellSellNeutralBuyStrong buy
Moving Averages
Neutral
SellBuy
Strong sellStrong buy
Strong sellSellNeutralBuyStrong buy
Moving Averages
Neutral
SellBuy
Strong sellStrong buy
Strong sellSellNeutralBuyStrong buy
Displays a symbol's price movements over previous years to identify recurring trends.
Frequently Asked Questions
The current rate of CADEUR is 0.62365 EUR — it has increased by 0.10% in the past 24 hours. See more of CADEUR rate dynamics on the detailed chart.
The value of the CADEUR pair is quoted as 1 CAD per x EUR. For example, if the pair is trading at 1.50, it means it takes 1.5 EUR to buy 1 CAD.
The term volatility describes the risk related to the changes in an asset's value. CADEUR has the volatility rating of 0.09%. Track all currencies' changes with our live Forex Heatmap and prepare for markets volatility.
The CADEUR showed a −1.46% fall over the past week, the month change is a 0.09% rise, and over the last year it has decreased by −6.28%. Track live rate changes on the CADEUR chart.
Learn how you can make money on rate changes in numerous trading ideas created by our community.
Learn how you can make money on rate changes in numerous trading ideas created by our community.
CADEUR is a minor currency pair, i.e. a popular pair that is not associated with USD. Such pairs are also called cross currency pairs.
Currencies are usually traded through forex brokers — choose the one that suits your needs and go ahead. You can trade CADEUR right from TradingView charts — just log in to you broker account. Check out the list of our integrated brokers and find the best one for your needs and strategy.
When deciding to buy or sell currency one should keep in mind many factors including current geopolitical situation, interest rates, and other. But before plunging into a deep research, you can start with CADEUR technical analysis. The technical rating for the pair is sell today, but don't forget that markets can be very unstable, so don't stop here. According to our 1 week rating the CADEUR shows the sell signal, and 1 month rating is sell. See more of CADEUR technicals for a more comprehensive analysis.