EURCAD Double BottomThis is how you treat a double bottom using this model I learned recently. Everything on the chart is illustrated on the drawing. Whenever you see a double bottom, it should be easy money.
CADEUR trade ideas

EURCAD: True Bearish Reversal?!EURCAD formed a classic head and shoulders pattern following a retesting of an important historical resistance level.
A break below the neckline, accompanied by a strong bullish candle, confirms a bearish signal.
I anticipate a corrective movement, potentially reaching as low as 1.5555.

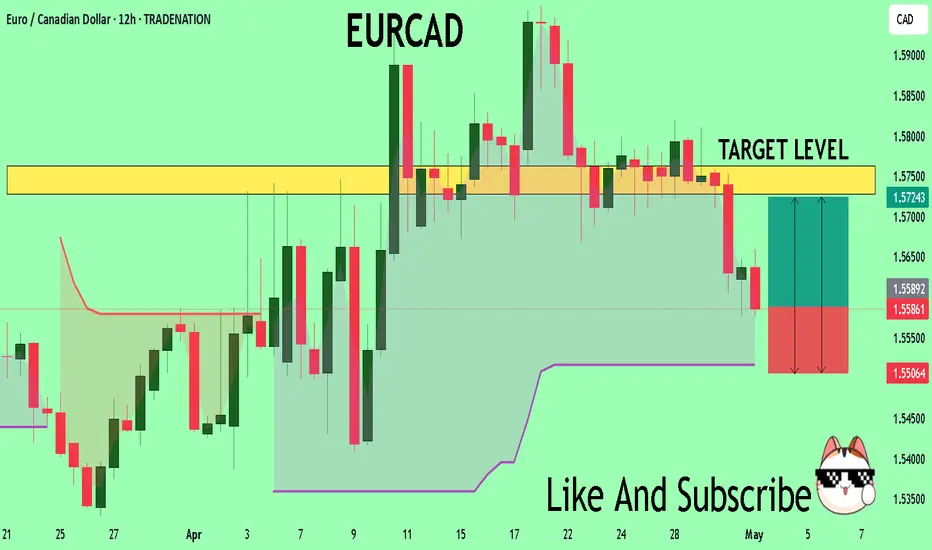
EUR_CAD BEARISH BREAKOUT|SHORT|
✅EUR_CAD made a bearish
Breakout of the support
Cluster of the rising and
Horizontal support lines
Around 1.5672 and the
Breakout is confirmed so
We are bearish biased and
We will be expecting a
Further bearish move down
SHORT🔥
✅Like and subscribe to never miss a new idea!✅
Disclosure: I am part of Trade Nation's Influencer program and receive a monthly fee for using their TradingView charts in my analysis.

EURCAD Sellers In Panic! BUY!
My dear friends,
My technical analysis for EURCAD is below:
The market is trading on 1.5585 pivot level.
Bias - Bullish
Technical Indicators: Both Super Trend & Pivot HL indicate a highly probable Bullish continuation.
Target - 1.5728
Recommended Stop Loss - 1.5506
About Used Indicators:
A pivot point is a technical analysis indicator, or calculations, used to determine the overall trend of the market over different time frames.
Disclosure: I am part of Trade Nation's Influencer program and receive a monthly fee for using their TradingView charts in my analysis.
———————————
WISH YOU ALL LUCK
EURCAD H4 Timeframe Potential Impulsive UpwaveEURCAD in the 4 hours timeframe potentially corrective structure completed for the next impulsive wave. Impulse - Correction - Impulse.

EURCAD Is Bearish! Sell!
Please, check our technical outlook for EURCAD.
Time Frame: 12h
Current Trend: Bearish
Sentiment: Overbought (based on 7-period RSI)
Forecast: Bearish
The market is approaching a key horizontal level 1.564.
Considering the today's price action, probabilities will be high to see a movement to 1.543.
P.S
Please, note that an oversold/overbought condition can last for a long time, and therefore being oversold/overbought doesn't mean a price rally will come soon, or at all.
Disclosure: I am part of Trade Nation's Influencer program and receive a monthly fee for using their TradingView charts in my analysis.
Like and subscribe and comment my ideas if you enjoy them!

EURCAD TOP DOWN ANALYSIS 4HR TIMEFRAMEOn the 4hr timeframe, we noted the key zone + breakout of the rising wedge and the trendline + confirmation candles for the breakout candle that formed afterwards hence we take a quick entry short in this short term retracement and our stoploss above the trendline etc. May the gains be with us all!!

EURCAD TOP DOWN ANALYSIS DAILY TIMEFRAME On the Daily, we established the key zone still lining perfectly on the daily time frame + another wide daily divergence right at the key level + price breaking out from the rising wedge and the trend line all signaling bearish and confirming the monthly and weekly bearish bias!!

EURCAD TOP DOWN ANALYSIS BEARISH BIASON THE WEEKLY, we established the major key monthly and weekly zone + momentum loss of candles and appearance of bearish candles followed by multiple candle rejection on the weekly right at the key zone + wide weekly divergence right at the key zone which is very rare!! a week all signaling bearish hence we move to the daily timeframe!!

Heading into 50% Fibonacci resistance?EUR/CAD is falling towards the pivot and could reverse to the 1st support which is a pullback support.
Pivot: 1.57044
1st Support: 1.54315
1st Resistance: 1.57990
Risk Warning:
Trading Forex and CFDs carries a high level of risk to your capital and you should only trade with money you can afford to lose. Trading Forex and CFDs may not be suitable for all investors, so please ensure that you fully understand the risks involved and seek independent advice if necessary.
Disclaimer:
The above opinions given constitute general market commentary, and do not constitute the opinion or advice of IC Markets or any form of personal or investment advice.
Any opinions, news, research, analyses, prices, other information, or links to third-party sites contained on this website are provided on an "as-is" basis, are intended only to be informative, is not an advice nor a recommendation, nor research, or a record of our trading prices, or an offer of, or solicitation for a transaction in any financial instrument and thus should not be treated as such. The information provided does not involve any specific investment objectives, financial situation and needs of any specific person who may receive it. Please be aware, that past performance is not a reliable indicator of future performance and/or results. Past Performance or Forward-looking scenarios based upon the reasonable beliefs of the third-party provider are not a guarantee of future performance. Actual results may differ materially from those anticipated in forward-looking or past performance statements. IC Markets makes no representation or warranty and assumes no liability as to the accuracy or completeness of the information provided, nor any loss arising from any investment based on a recommendation, forecast or any information supplied by any third-party.

EURCAD: Strong Bearish Pattern Spotted 🇪🇺🇨🇦
EURCAD formed a huge head and shoulders pattern on a daily time frame.
Its neckline was broken yesterday with a high momentum bearish candle.
I guess that the pair may drop much lower now.
Next support - 1.55
❤️Please, support my work with like, thank you!❤️
I am part of Trade Nation's Influencer program and receive a monthly fee for using their TradingView charts in my analysis.

Short on EURCAD- 1:2.5 Risk RewardConfluence of weekly EBP (Engulfing Bar Play) and daily FVG inversion for a 1:2.5 risk reward on EURCAD. Trade taken at 50% fib retracement level.

(A contrarian Re-Entry) EUR CAD #0015 Short Swing Trade- Trade heavily relies on the liquidity pools, the failed breakout of the Price Action along the Liquidity pools, and the presence of Order Block (ie, a reversal indication and a sign of exhaustion in Selling Sentiment - Short Term).
- We aimed to profit from the pip difference between the lower order block and the Fair Value Gap (FVG) during the correction phase.
- The correction phase is inevitable.
- The order block marked yellow is our place of entry.
- Holding Period will be between 1 day to 3 days

EURCAD Wave Analysis – 30 April 2025
- EURCAD reversed from resistance level 1.5880
- Likely to fall to support level 1.5495
EURCAD currency pair recently reversed down from the pivotal resistance level 1.5880 (which has been reversing the price from the start of July) intersecting with the upper daily Bollinger Band and the resistance trendline of the daily up channel from 2022.
The downward reversal from the resistance level 1.5880 created the weekly Shooting Star – a strong sell signal for EURCAD.
Given the overbought daily Stochastic and the strength of the resistance level 1.5880, EURCAD currency pair can be expected to fall to the next support level 1.5495.

EUR/CAD H4 AnalysisPrice has been in a correction pattern recently after the start of a bearish impulse from 1.5959
Now price has broken out and began the next impulse lower.
Look for a sell setup to target the -27% Fib and then potentially the -61.8% Fib.
This is an idea of what may happen. Always trade with a profitable strategy and good risk management.

EUR-CAD Bearish Breakout! Sell!
Hello,Traders!
EUR-CAD made a bearish
Breakout of the key horizontal
Level of 1.5700 and the
Breakout is confirmed
So we are bearish biased
And we will be expecting
A further bearish move down
Sell!
Comment and subscribe to help us grow!
Check out other forecasts below too!
Disclosure: I am part of Trade Nation's Influencer program and receive a monthly fee for using their TradingView charts in my analysis.

EUR/CAD – Bearish Momentum ContinuesEUR/CAD – Bearish Momentum Continues
EUR/CAD remains in a strong bearish trend, consistently printing a series of Lower Highs (LHs) and Lower Lows (LLs). The market structure confirms ongoing downward momentum.
The recent candle also closed bearish, reinforcing the trend. Since the bearish structure is still intact, this could be a good opportunity to open a new short position, following the trend.
Trade Suggestion:
Entry: Sell at market price
Stop Loss & Take Profit: As indicated in the chart

EUR/CAD is in bearish trend.EUR/CAD is currently in a clear bearish trend, consistently forming a series of Lower Highs (LH) and Lower Lows (LL) — a strong indication of ongoing downward momentum.
The most recent candle closed bearish (red), reinforcing selling pressure. This provides a suitable opportunity to enter a short position at the current market price.
Trade Suggestion:
Entry: Sell at market
Stop Loss & Take Profit: As marked on the chart

EURCAD: Free Trading Signal
EURCAD
- Classic bullish pattern
- Our team expects retracement
SUGGESTED TRADE:
Swing Trade
Buy EURCAD
Entry - 1.5687
Stop - 1.5644
Take - 1.5778
Our Risk - 1%
Start protection of your profits from lower levels
Disclosure: I am part of Trade Nation's Influencer program and receive a monthly fee for using their TradingView charts in my analysis.
❤️ Please, support our work with like & comment! ❤️

Eurcad long position On the EURCAD currency pair, I opened a long position with a target of 1.59. The range and direction were based on my analysis and supported by oscillators.

EURCAD BEARISH BIASON THE MONTHLY TIMEFRAME, We just established a key monthly level/zone/resistance which is on interest to us.

EURCAD bearish view
#EURCAD several times bounces on trend line, having view price is saturated on this point, currently we are in zone, from here expecting break of zone/trend line and bearish trend till RES zones.
SUP zone: 1.58500
RES zone: 1.55400, 1.54400

EURCAD Short 4/29/2025EUR/CAD Short – Multi-Week Weekly Rejection + Bearish Continuation Setting Up
Taking a short on EUR/CAD after sustained weekly rejection, daily structure shift, and intraday bearish continuation signs.
Weekly Chart:
Strong rejection off a key weekly supply level — multiple weeks confirming resistance:
Initial rejection week of March 10th.
Three back-to-back rejections again during April 7th, April 14th, and April 21st.
Clear seller control at this zone, with the latest weekly candle forming a bearish hammer — priming the setup for continuation lower.
Daily Chart:
Yesterday, we gapped down, tapped a daily level, and closed bearish — signaling sellers are firmly stepping in.
Momentum has shifted toward the downside cleanly.
4H Chart:
Three candles of bearish behavior after an initial bullish impulse:
Bearish hammer, doji, and strong bearish hammer sequence printed.
Price is now stalling at trendline support but showing signs of pressure building for a breakdown.
1H Chart:
Some minor bullish bounce off trendline support, but the structure is weakening — supply consistently capping rallies.
Trade Thesis:
Expecting a trendline break soon, accelerating momentum to the downside once 1.5700 gives way.
Targets:
First target: 1.5700 (structure break)
Second target: 1.5500
Third target (extended): 1.5330
Risk Management:
Conservative management until 1.5700 breaks.
Aggressive partials after clearing 1.5500 toward long-term target.
