EURCAD BuyOverall EURCAD is currently on a Bullish trend. Price action on the 1hr chart just recently retested the bullish trendline. On the lower time frame (3 minute) there was a bullish change of character, and price is currently above the 200ema. Market execution buy with SL at recent low.
CADEUR trade ideas

EURCAD Is Going Down! Short!
Take a look at our analysis for EURCAD.
Time Frame: 5h
Current Trend: Bearish
Sentiment: Overbought (based on 7-period RSI)
Forecast: Bearish
The market is on a crucial zone of supply 1.591.
The above-mentioned technicals clearly indicate the dominance of sellers on the market. I recommend shorting the instrument, aiming at 1.578 level.
P.S
We determine oversold/overbought condition with RSI indicator.
When it drops below 30 - the market is considered to be oversold.
When it bounces above 70 - the market is considered to be overbought.
Disclosure: I am part of Trade Nation's Influencer program and receive a monthly fee for using their TradingView charts in my analysis.
Like and subscribe and comment my ideas if you enjoy them!

This 7 Step Analysis Reveals How To Buy Forex PairsHere is another chart example.
Now in this one you will notice the difference.
The last one [reference below CAPITALCOM:EURJPY ]
Had a whipsaw of about -0.2%
This whipsaw f'd me up.I stared doubting the strategy.
Now in all fairness day trading is hard.
So just about now i was watching
a video from Tim Sykes.
And he said "Focuss on big percent gainers"
I say focuss on the trend
Do you remember that the last forex
pair CAPITALCOM:EURJPY had no percent gain?
At the point of entry?
In my case it had no gap.
So lets look at this chart.And notice the following:
👉The price is above the 50 EMA
👉The price is above the 200 EMA
👉 The price has "gapped" up
✅In this case the price has "gapped" up -
✅In this case The ema's have crossed
✅In this case its followed the rocket booster strategy
❌In this case i have failed to recognise the candlestick pattern
As you can see my analysis is not perfect.
But what i love about this one
is the "Green performance" .
Also it follows the rocket booster strategy.
Rocket boost this content to learn more.
Disclaimer:Trading is risky please learn risk management
and profit taking
strategies.And feel free to use a simulation
trading account before you trade with real money.

EURCAD Long 4/23/2025EUR/CAD Long Setup – Doji Reversal off Daily Support + Clean Intraday Double Bottom
Looking to go long on EUR/CAD after a strong multi-timeframe confluence of structure, liquidity sweep, and bullish intent.
4H Chart:
A beautiful doji formed after a stop hunt, clearing out long-side liquidity built up since the consolidation zone starting around April 14th.
The following three 4H candles have respected that doji's low and are all bouncing cleanly off the key daily support zone at 1.57544 — a strong sign of buyer defense.
Daily Chart:
Price tapped into a well-established demand zone, holding firm and reacting with precision.
1H Chart:
We've got a double bottom forming, but what makes it cleaner is that the second leg didn’t even touch the previous low — early buyers stepped in faster. That’s a sign of strength and absorption.
Trade Plan:
Entry: Around current level, just above 1.57544
Target 1: 1.58572 (.82R, and also a weekly level)
Target 2: Swing high beyond 1.5900
Stop: Just below the doji wick on the 4H
This setup combines a clear liquidity sweep, price reaction from daily structure, and intraday bullish intent. If we reclaim 1.5800 with momentum, the high should be in reach.

EURCAD BuyBUY opportunity on EURCAD. I see an inverted head and shoulder's pattern. Also a breakout on this bullish channel

EURCAD - SHORTAfter a long time studying and going over price action, I think I am now finally starting to see high probability set ups...lets see how this plays out. Price took equal highs and traded into an OB...

Strong sell eurcadMonthly sell structure weekly buy trend broken and retested successful
Monthly daily and weekly overbought pair

(A re-entry) EUR CAD #0013 Short Swing Trade- A trade limit order was initiated after a failed breakout occurred on the daily time frame against the last month's HIGH.
- This indicates exhaustion of the Buyers' interest.
- The presence of orderblock on the false breakout zone indicates a reversal pattern.
- However, not to be taken frankly, INDUCEMENT is going on at the moment (April 17) in the sideways/accumulation zone.
- This represents a bulk of Retail Traders' Stop Losses creating "Liquidity Pools", in addition to the Liquidity Pool on the last Monthly HIGH.
- We are anticipating a Liquidity Hunt to occur, absorbing all stop limit orders around the sideways/accumulation (after orderblock) to occur, hence initiating a Buy Order in abundance, where SMART MONEY can take advantage of by initiating a large Sell Order (hence absorbing all liquidity).
- This trade is CONTRARIAN in nature and Swing Trading.
- The holding period is expected to be between 3 days to 1 week

EUR/CAD Trying To Breakout Strong Support , Be Ready For Sell !Here is my opinion about EUR/CAD , The price at very strong support and can`t close below it , so if we have a clear closure below it we can enter a sell trade with the retest and targeting 150 pips at least . just wait for the breakout and for bearish Price Action and then we can go down hard with it ! if we have not a closure below so this idea should be canceled .

EURCAD: Bearish Continuation & Short Signal
EURCAD
- Classic bearish pattern
- Our team expects retracement
SUGGESTED TRADE:
Swing Trade
Sell EURCAD
Entry - 1.5898
Stop - 1.5970
Take - 1.5735
Our Risk - 1%
Start protection of your profits from lower levels
Disclosure: I am part of Trade Nation's Influencer program and receive a monthly fee for using their TradingView charts in my analysis.
❤️ Please, support our work with like & comment! ❤️

EURCAD..LONGOANDA:EURCAD
Price is testing a level that has proven significant in the past. Will it hold or break this time? The market always tells a story — we just have to listen.
A confirmed breakout and retest of this level could shift the bias and offer a new opportunity.

EURCAD Short 4/21/2025EUR/CAD Short Setup – Stop Run and Weekly Reversal in Play
We started the week with a burst of bullish activity on EUR/CAD — but it’s looking more like a liquidity grab than genuine strength.
Sunday Open: Within 12 hours of the weekly open (during thin liquidity), price broke last week’s high — a level that held all of last week — hinting at a possible engineered stop run.
Backdrop: The ECB’s 25bps rate cut last Thursday (April 17) continues to pressure the euro fundamentally. This morning's move likely reflects faux volume aimed at clearing out late sellers before a reversal.
Session Structure:
Asia: Extended the highs slightly.
London: Delivered a sharp drive up, breaking the weekly high mid-session — likely the final liquidity tap before reversing.
Now: London has closed. We’re heading into New York with momentum slowing and key reversal patterns forming.
Technical Confluence:
15-Min Chart: Clear double top.
1H Chart: Inside bar fakeout forming — breakout failed, candle about to close bearish.
These formations align with a classic market maker reversal model following a stop raid.
Bias: Bearish.
Targeting a move down to 1.53319 — a clean demand zone and structural target.
Stops above 1.6000 would be ideal for institutions to aim at, but I don’t believe we’ll reach that high. The signs of exhaustion are already visible.
Macro View: With euro weakness post-ECB and potential dollar strength building this week (especially with Trump pressuring global trade again), this may be the start of a decisive trend move to the downside.
Let’s see how New York handles this. If momentum confirms, we may be at the very beginning of a significant shift.

EURCAD Short 4//17/2025EUR/CAD Short (Re-entry After Rate Cut Reversal)
Got stopped out on the previous attempt — but this re-entry offered a stronger, higher-timeframe confirmation.
Daily Chart: We printed a long-tailed hammer rejecting hard off a key weekly zone. That wick tested liquidity and snapped back, giving early signs of euro exhaustion. Today, price is flipping into what looks like a bearish engulfing candle — pending the close — suggesting trend reversal pressure is real.
Catalyst: The ECB dropped a 25bps rate cut, a shift from my earlier post when no EU news was expected. This move added strong bearish sentiment, especially paired with continued U.S. trade pressure under Trump’s new tariffs. Macro + technicals aligned = clean setup.
4H Chart: Multiple rejections off the weekly zone after that liquidity sweep, followed by an inside bar setup — that was my re-entry trigger. I’ve been holding since yesterday and we’re now running a 1:6.27 R:R play toward a key downside target.
1H Chart: During and after the ECB announcement, price action got messy — hammers, dojis, and fake bullish pushes all turned into supply-heavy rejections. That’s typical “fade the news” behavior when the big players already had their direction.
Key Zone: 1.56800 is the final liquidity shelf before price enters clean air. Once we get a solid 4H close below that zone, I expect price to accelerate toward my target at 1.55727.
This one’s got weight behind it — technical structure, macro catalysts, and institutional pressure all aligned.

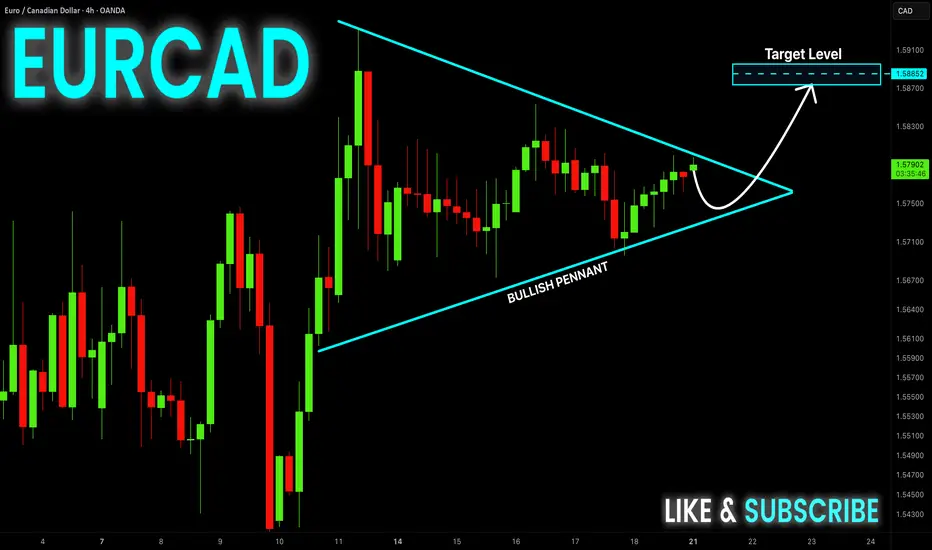
EUR-CAD Wait For Breakout! Buy!
Hello,Traders!
EUR-CAD has formed a
Bullish pennant pattern
While trading in an uptrend
So we are bullish biased and
IF we see a bullish breakout
We will be expecting a
Further bullish move up
Buy!
Comment and subscribe to help us grow!
Check out other forecasts below too!
Disclosure: I am part of Trade Nation's Influencer program and receive a monthly fee for using their TradingView charts in my analysis.
EURCAD SHORTPrice is at a very strong monthly and weekly resistance zone. Waiting to see if we break below H4 support moving lower to next H4 support around 1.54000. Long term target is 1.51500 where price broke out of a major resistance.

EUR_CAD BULLISH PENNANT|LONG|
✅EUR_CAD is trading in an
Uptrend and the pair has
Formed a bullish pennant
Pattern so IF we see a
Bullish breakout on Monday
We will be able to go long
On the pair
LONG🚀
✅Like and subscribe to never miss a new idea!✅
Disclosure: I am part of Trade Nation's Influencer program and receive a monthly fee for using their TradingView charts in my analysis.

EURCAD at 2009 Highs – Is a Massive 1,000 Pip Sell-Off Imminent?It's been a while since my last idea! (Too busy traveling lately 😅)
Today, we're zeroing in on a high-probability short setup on EURCAD. This pair has surged strongly since the start of the year, fueled by all the Trump-related market chaos.
Once we smashed through 1.52—last year's key resistance (a level where we previously banked over 600 pips on a massive drop)—the market has been steaming towards the next major SELL zone between 1.58 and 1.615. This area has been rock-solid resistance since 2009, causing significant sell-offs each time we've tested it. Can history repeat itself? Let’s dive into the charts.
Weekly Chart:
After the initial spike into our key zone in early March, we saw an immediate 600-pip rejection, but buyers quickly regrouped and drove the pair to fresh highs near 1.60. Crucially, we're now seeing a lack of follow-through on recent highs, which is a classic sign of buyer exhaustion. Even more telling, this week's candle is a spinning top—a textbook reversal signal.
Daily Chart:
Zooming into the daily timeframe, price action is becoming increasingly choppy with multiple rejection candles at the highs—clear signs that sellers are starting to step in. Additionally, MACD divergence is glaringly obvious, reinforcing the bearish setup.
4-Hour Chart:
At the 4-hour level, the market is now trapped in a tight sideways range between 1.57 (floor) and just above 1.58 (ceiling). The MACD continues to signal divergence—another strong indication that the bullish momentum is losing steam and a reversal is likely imminent.
How I'm Trading It:
Given all these signals, I'm using my TRFX indicator to build a long-term short position, targeting sell signals on the 8-hour and daily charts. The daily chart alone has been flashing multiple sell signals already (see below):
One last thing: Don’t be surprised by a quick fake-out spike toward the upper bound at 1.615—it’s very common in setups like these. Any sharp spike up should get quickly rejected, giving us another great selling opportunity.
Targets:
First Target: Last year's major resistance at 1.52—expect a reaction and possibly a bounce here.
Second Target: Longer term, I'm eyeing a deeper move toward the major support level around 1.43, offering a huge profit potential if the reversal fully plays out.
That's my game plan—let me know your thoughts below! 😊

EURCADhello trader the price has reached the main support area with OB.. price is consolidating, price is still uptrend in HTF daily-wk, most likely correction for HTF.. no major breakout yet but wait for candle breakout or BOS in small tf and use proper risk management..
good luck

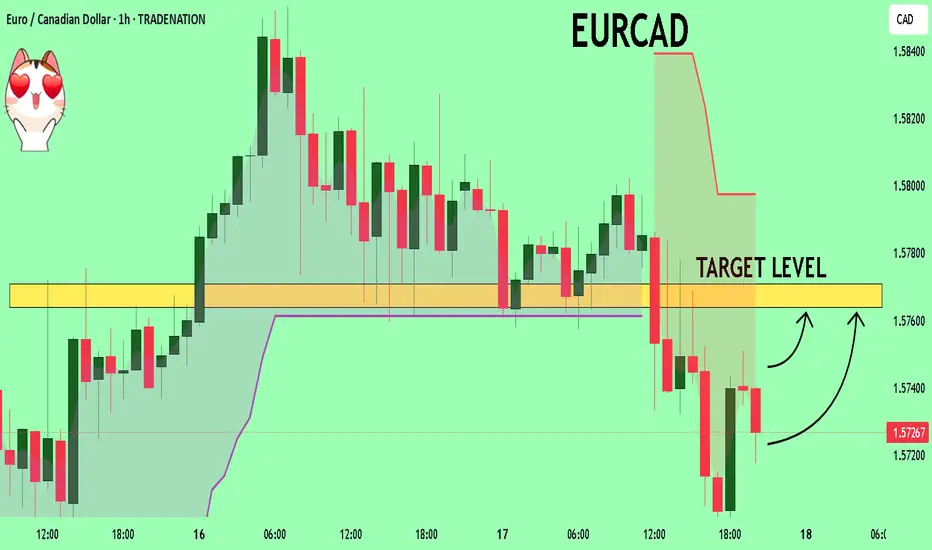
EURCAD What Next? SELL!
My dear followers,
I analysed this chart on EURCAD and concluded the following:
The market is trading on 1.5726 pivot level.
Bias - Bearish
Technical Indicators: Both Super Trend & Pivot HL indicate a highly probable Bearish continuation.
Target - 1.5763
About Used Indicators:
A super-trend indicator is plotted on either above or below the closing price to signal a buy or sell. The indicator changes color, based on whether or not you should be buying. If the super-trend indicator moves below the closing price, the indicator turns green, and it signals an entry point or points to buy.
Disclosure: I am part of Trade Nation's Influencer program and receive a monthly fee for using their TradingView charts in my analysis.
———————————
WISH YOU ALL LUCK
EURCAD Wave Analysis – 17 April 2025- EURCAD reversed from long-term resistance level 1.5840
- Likely to fall to support level 1.5400
EURCAD currency pair recently reversed down from the long-term resistance level 1.5840 (which has been reversing the price from the start of 2020) standing close to the upper daily Bollinger Band and the resistance trendline of the weekly up channel from 2022.
This is the 3rd consecutive failure to break above the major resistance level 1.5840 by this currency pair from the start of this year.
Given the strength of the resistance level 1.5840, overbought weekly Stochastic and the bullish Canadian dollar sentiment seen today, EURCAD currency pair can be expected to fall to the next support level 1.5400.

EUR CAD #0005 Short Position Trading - The hunt of liquidity is in process.
- Monthly Chart indicating an order block beneath the last Monthly HIGH
- The order block price to be fulfilled - making the basis of this position trading.
- The TP is subjective, however we emphasized pragmatism and work with the closest Liquidity Pool (LP) area - LP = closest HIGHS and LOWS.
-Weekly latest HIGHs previously penetrated the order Monthly Order Block.
- Position Trading limit order is in place.
- We're going for a long ride, comrade!

WHAT IS NEXT AHEAD OF ECB MONETARY POLICY REPORT?EURCAD has been maintaining its bullish outlook after a major breakout of the 1.52023 in the first quarter of the year. We have about 1% drop in value so far from the high price of 1.59210 considering the euro strength so far, we’re likely to see another round of impulse move to the upside as there’s no sign of weakness at the moment. I believe price is likely to trade more bullish.

