Is CAD tariff premium overpriced?Will Trump really go with 25% tariffs for Canada?
Still days before Feb 1st and too much uncertainty
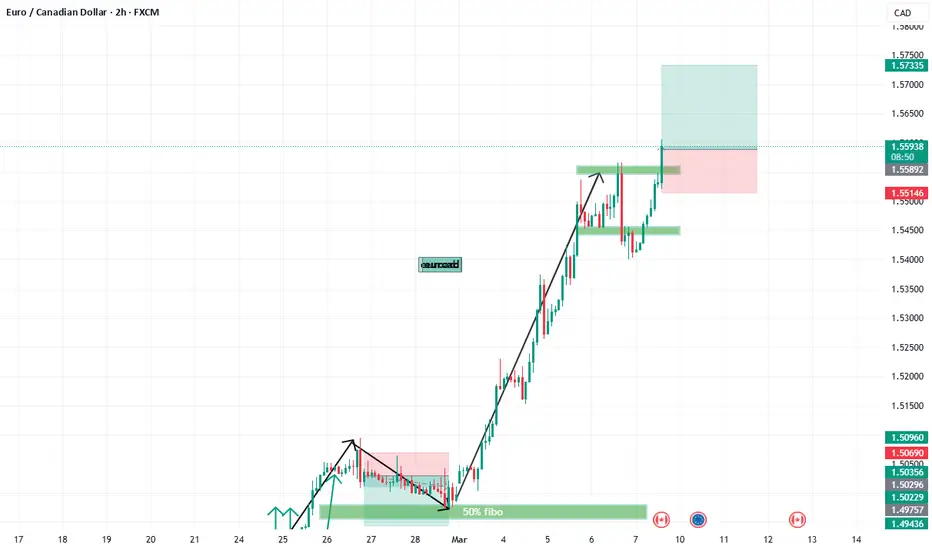
with current info available it does not justify tariff premium to be priced as such, waiting for EURCAD breakdown for a short
always wait for market to show u the signs and only enter with LTF confirmation
Note this is counter trend mean reversion trade idea so be mindful of potential pip and ATR range.
CADEUR trade ideas

Second hedgepoint setupsmacro traders will know what announcement we waiting for
second stacked hedge point after our shared eurusd
short hedges
same thing LTF breakdown or a wick up crash
already in hedge flow zone
Check out our socials for some nice insights.
Let us know if there're any pair you like to see or if this is something you like.
information created and published doesn't constitute investment advice!
NOT financial advice

EURCAD Daily Trade Setup – Targeting Buy-Side Liquidity! 🔹 Daily FVG Mitigation: Price is currently in a Fair Value Gap (FVG) on the daily timeframe, indicating potential institutional interest.
🔹 Change of Character (ChoCH) on Daily: A bullish shift in structure suggests that smart money may be accumulating positions for an upward move.
🔹 Liquidity Target: The next expected move is towards Buy-Side Liquidity, where stop-loss clusters and pending orders reside.
📊 Trade Plan:
✅ Entry Confirmation: Lower timeframe (H4/M15) Break of Structure (BOS) + Order Block (OB) Retest
✅ Stop Loss: Below the last swing low or OB for proper risk management
✅ Take Profit: Buy-side liquidity level / Key resistance zones
✅ Risk-to-Reward Ratio: Minimum 1:3 to maximize potential gains
🔍 Key Considerations:
📈 Volume Confirmation: Institutional volume alignment (POC, HVN) for strong confirmation
⏳ London & NY Sessions: Best execution timings for high-probability moves
📅 Upcoming News Events: Watch for high-impact events that may influence EUR or CAD
⚠️ Risk Disclaimer: This is for educational purposes only, not financial advice. Manage your risk accordingly!
📊 What’s your bias on EURCAD? Comment below! 👇💬
#EURCAD #SmartMoneyConcepts #SMC #ICT #ForexTrading #LiquidityHunt #OrderBlocks #FairValueGap #ForexAnalysis 🚀📉

EURCAD NEW SELL PLAN (UPDATED)📌 EUR/CAD TRADE ANALYSIS & EXECUTION PLAN 🎯
🔥 Primary Sell Trade – High-Conviction Institutional Setup
🔹 Entry Zone 1: Sell Limit at 1.5500 (Liquidity Grab + Supply Zone).
🔹 Entry Zone 2: Sell Limit at 1.5550 (Final liquidity sweep before rejection).
🔹 Confirmation Entry (H1/H4):
✅ H4 Bearish Engulfing Bar (Major sign of institutional selling).
✅ M30/H1 Bearish Divergence (Momentum weakening at highs).
✅ Volume Spike at Highs (Liquidity grab & Smart Money distribution).
📍 Stop Loss & Take Profits:
✅ Ultra-Safe SL: Above 1.5600 (Liquidity grab invalidation).
✅ Safe SL: Above 1.5570 (Structure invalidation).
✅ TP1: 1.5350 (First reaction zone – move SL to breakeven).
✅ TP2: 1.5250 (Institutional demand zone).
✅ TP3: 1.5150 (Full move completion).
🎯 Confidence Level: ✅✅✅✅ (80-90%) – High Probability Trade
📍 Why This Sell Setup?
🔹 H4 Bearish Engulfing Bar: Strong rejection with institutional sell momentum at highs.
🔹 Bearish Divergence (M30/H1): Momentum exhaustion as price made higher highs while RSI/MACD failed to confirm.
🔹 Liquidity Grab Above 1.5450: Stop hunts triggered before a selloff, confirming Smart Money involvement.
🔹 Key Resistance Zone (1.5500-1.5550): Historical supply area where previous reversals occurred.
🔹 Overextended Rally: Price surged from 1.4900 to 1.5500 with no proper retracement – high probability for correction.
🚨 Trade Invalidation Criteria:
❌ Close above 1.5600 (Ultra-Safe SL hit).
❌ H4 bullish structure shift (Break & close above 1.5620+).
❌ Fundamental shift favoring EUR strength (Major news event).
📢 H4 engulfing bar + M30/H1 divergence confirm Smart Money selling! Watch for reaction at 1.5500-1.5550! 🚀

eurcad look for short continuation in LTFeurcad look for short continuation in LTF
long cad or short eur
Check out our socials for some nice insights.
Let us know if there're any pair you like to see or if this is something you like.
Do ask if you have any question
Not as refined as our direct trade setups. More for advanced active traders.
information created and published doesn't constitute investment advice!
NOT financial advice

Digesting the US & Canada job numbers The numbers are out and, so far, the market is reacting logically. Let's dig in!
NASDAQ:AMD
NASDAQ:AVGO
NASDAQ:NVDA
MARKETSCOM:GOLD
MARKETSCOM:EURUSD
MARKETSCOM:DOLLARINDEX
MARKETSCOM:USDCAD
Let us know what you think in the comments below.
Thank you.
74.2% of retail investor accounts lose money when trading CFDs with this provider. You should consider whether you understand how CFDs work and whether you can afford to take the high risk of losing your money. Past performance is not necessarily indicative of future results. The value of investments may fall as well as rise and the investor may not get back the amount initially invested. This content is not intended for nor applicable to residents of the UK. Cryptocurrency CFDs and spread bets are restricted in the UK for all retail clients.

EURCAD POSSIBLE BUY CONTINUATION Price just broke a resistance level of 1.55469 a retest to this level will provide a good opportunity to go long. Fundamentally, the just released Canada unemployment rate came out worse than expected which further increase the probability of buy opportunity to emerge.

"Euro Gains Strength Over Canadian Dollar"EUR has shown us the potential to be bullish. This setup in EURCAD can be potential opportunity based on the historic bullish bias. CAD has shown significant weakness based on the correlation.
do share your views.

EURCAD Is Very Bullish! Long!
Please, check our technical outlook for EURCAD.
Time Frame: 45m
Current Trend: Bullish
Sentiment: Oversold (based on 7-period RSI)
Forecast: Bullish
The price is testing a key support 1.552.
Current market trend & oversold RSI makes me think that buyers will push the price. I will anticipate a bullish movement at least to 1.561 level.
P.S
We determine oversold/overbought condition with RSI indicator.
When it drops below 30 - the market is considered to be oversold.
When it bounces above 70 - the market is considered to be overbought.
Like and subscribe and comment my ideas if you enjoy them!


EURCAD FORECASTINGTraders! We have this pair on watch today; however, we need to see more price development before we make a decision on the market. In this video, I explain all the areas that you can take advantage of. I suggest you watch it to the end to gain clarity on how you can tackle every scenario that the market will undergo.

EURCAD Wave Analysis – 6 March 2025
- EURCAD broke multi-year resistance 1.5100
- Likely to rise to resistance level 1.5770
EURCAD currency pair is rising sharply after the earlier breakout of the powerful multi-year resistance 1.5100, which has stopped all upward impulses from the start of 2021.
The breakout of the resistance 1.5100 accelerated the short-term impulse wave 3 of the longer-term upward impulse sequence (3) from the end of 2024.
Given the clear multiyear uptrend, EURCAD currency pair can be expected to rise to the next resistance level 1.5770, the former major price barrier from 2020 and the target for the completion of the active weekly impulse wave 3.


EUR/CAD SENDS CLEAR BEARISH SIGNALS|SHORT
Hello, Friends!
We are going short on the EUR/CAD with the target of 1.528 level, because the pair is overbought and will soon hit the resistance line above. We deduced the overbought condition from the price being near to the upper BB band. However, we should use low risk here because the 1W TF is green and gives us a counter-signal.
✅LIKE AND COMMENT MY IDEAS✅

EUR/CAD Technical Analysis – Price Rejection at Key ResistanceEUR/CAD has reached its highest level since August 2024, touching a major resistance zone. However, instead of breaking higher, the price has faced strong rejection, indicating that sellers have stepped in with force.
The pair tested a critical resistance level but failed to break through, signaling a potential shift in momentum.
The rejection suggests that buyers may be losing control, giving sellers an opportunity to push prices lower
Downside Targets:
The next potential target for sellers is 1.50000, a psychological and technical support level.
If selling pressure remains strong, the second downside target is 1.48800

EURCAD SELL / BUY TRADE PLANS🔻 PRIMARY TRADE – SELL SETUP (1.5300 – 1.5350)
SELL ENTRY
🔹 Aggressive Entry: Sell Limit at 1.5300 – 1.5350 (Institutional Supply Zone).
🔹 Confirmation Entry: Wait for bearish rejection (Fakeout, Engulfing, or Pin Bar) below 1.5300.
🔹 SL: 1.5380 (Above liquidity grab & invalidation zone).
🔹 TP1: 1.5220 (Nearest support, move SL to breakeven).
🔹 TP2: 1.5150 (Liquidity target).
🔹 TP3: 1.5080 – 1.5050 (Full bearish target).
✅ Risk-Reward Ratio: 1:3+
🎯 Confidence Level: ✅✅✅✅ (Strong Technical & Liquidity Confluence).
📌 Reasons for confidence level:
🔹 Price is overextended into key resistance & supply zone (1.5300 – 1.5350).
🔹 Multiple rejections near 1.5300, indicating institutional selling.
🔹 Bearish divergence forming on volume (weakening buyers).
🔹 Potential liquidity grab above 1.5300 before reversal.
🟢🔄 Ultra-Refined Buy Trade Plan
🔹 Aggressive Entry: Buy Limit at 1.5020 – 1.4980 (Refined Institutional Demand Zone).
🔹 Confirmation Entry: Wait for bullish rejection (Wick Rejection, Bullish Engulfing, or Fakeout) above 1.5000.
🔹 SL: 1.4950 (Below liquidity grab & invalidation zone).
🔹 TP1: 1.5080 (Nearest resistance, move SL to breakeven).
🔹 TP2: 1.5150 – 1.5180 (Extended move based on liquidity).
🔹 TP3: 1.5250 – 1.5300 (Full bullish target).
✅ Risk-Reward Ratio: 1:3+
🎯 Confidence Level: ✅✅✅✅ (High, due to strong liquidity grab confluence).
📌 Why consider buying here?
🔹 Price would retrace deeper into institutional demand at 1.5020 – 1.4980.
🔹 Fair Value Gap (FVG) + 50% – 61.8% Fibonacci retracement align in this area.
🔹 Previous liquidity grab zone confirms high-probability reaction.
🔹 Potential smart money accumulation area before reversal.

EURCAD 30M TimeFrame BuyWe just saw good bullish movements from EURCAD now there is good potential for another bullish movements

EURCAD BULLISH FOR 200PIPS1. Technical Analysis
Trend Indicators: If EURCAD is in an uptrend on the 4-hour or daily charts, you might expect continued bullish momentum.
Support Levels: Look for key support levels that the pair has held above recently. If EURCAD is bouncing off a support zone (such as a moving average or horizontal support), it may provide a strong signal for a bullish move.
Resistance Levels: The pair should be approaching a resistance zone for you to consider the potential for 200 pips higher. If it breaks through a significant resistance level, that could signal further upward movement.
Technical Indicators: Bullish signals on indicators like the Relative Strength Index (RSI) or moving average crossovers might support a bullish outlook. Look for signs of momentum, such as higher highs or MACD signals.
2. Fundamental Analysis
Economic Data: EURCAD’s movement is influenced by economic reports from both the Eurozone and Canada. Strong economic data (like GDP, inflation, or employment reports) from the Eurozone could give EUR a boost, while weaker economic performance in Canada (such as falling oil prices or weaker employment reports) could drag down the CAD.
Central Bank Policies: Look at the interest rate decisions or any commentary from the European Central Bank (ECB) and the Bank of Canada (BoC). A more dovish stance from the BoC or a more hawkish stance from the ECB could influence EURCAD upwards.

EURCAD Is Bullish! Buy!
Here is our detailed technical review for EURCAD.
Time Frame: 9h
Current Trend: Bullish
Sentiment: Oversold (based on 7-period RSI)
Forecast: Bullish
The market is trading around a solid horizontal structure 1.501.
The above observations make me that the market will inevitably achieve 1.509 level.
P.S
Overbought describes a period of time where there has been a significant and consistent upward move in price over a period of time without much pullback.
Like and subscribe and comment my ideas if you enjoy them!

Bullish bounce?EUR/CAD is falling towards the pivot which is a pullback support and could bounce to the 1st resistance.
Pivot: 1.5106
1st Support: 1.4993
1st Resistance: 1.5258
Risk Warning:
Trading Forex and CFDs carries a high level of risk to your capital and you should only trade with money you can afford to lose. Trading Forex and CFDs may not be suitable for all investors, so please ensure that you fully understand the risks involved and seek independent advice if necessary.
Disclaimer:
The above opinions given constitute general market commentary, and do not constitute the opinion or advice of IC Markets or any form of personal or investment advice.
Any opinions, news, research, analyses, prices, other information, or links to third-party sites contained on this website are provided on an "as-is" basis, are intended only to be informative, is not an advice nor a recommendation, nor research, or a record of our trading prices, or an offer of, or solicitation for a transaction in any financial instrument and thus should not be treated as such. The information provided does not involve any specific investment objectives, financial situation and needs of any specific person who may receive it. Please be aware, that past performance is not a reliable indicator of future performance and/or results. Past Performance or Forward-looking scenarios based upon the reasonable beliefs of the third-party provider are not a guarantee of future performance. Actual results may differ materially from those anticipated in forward-looking or past performance statements. IC Markets makes no representation or warranty and assumes no liability as to the accuracy or completeness of the information provided, nor any loss arising from any investment based on a recommendation, forecast or any information supplied by any third-party.
