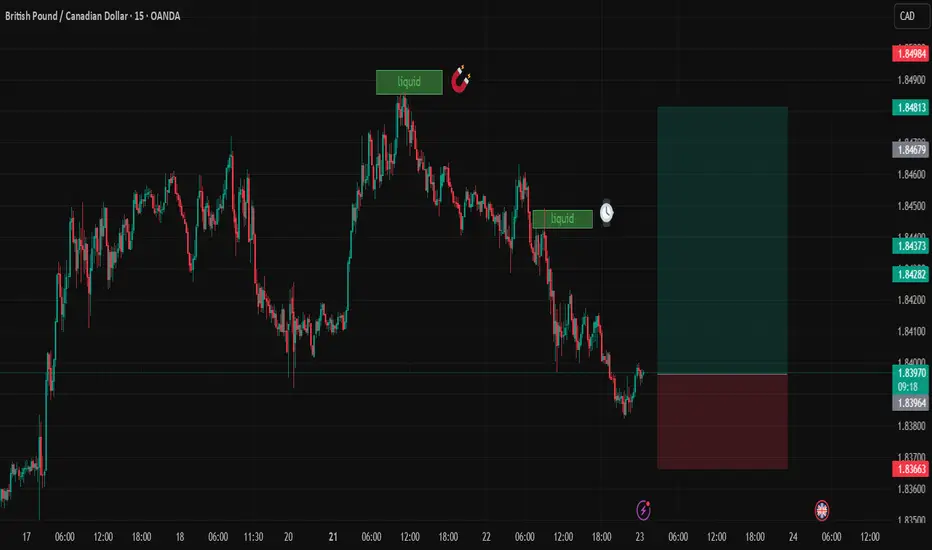
BUY GBPCADGBPCAD finally reaches an area of demand where we should see price steadily climb back to the resistance. We can expect some aggressive bullish moves from the pair.
CADGBP trade ideas

GBPCADDate:
July 23,2025
Session:
Tokyo and London session
Pair:
GBPCAD
Bias:
Long
2 liquidity pools that are waiting to be swept this week. Looks like price is gonna be magnetized towards these levels during London and Tokyo. The trade may even stretch into NYC.
Entry: 1.83970
Stop Loss: 1.83674
Target: 1.84811
RR: 2.82
BUY GBPCADHere is an opportunity to reenter buy positions on GBPCAD. The bullish trend has officially began.

GBPCAD SHORTMarket structure bearish on HTFs DW
Entry at both Weekly and Daily AOi
Weekly Rejection at AOi
Previous Weekly Structure Point
Daily Rejection at AOi
Daily EMA retest
Around Psychological Level 1.85000
H4 Candlestick rejection
Levels 5.3
Entry 90%
REMEMBER : Trading is a Game Of Probability
: Manage Your Risk
: Be Patient
: Every Moment Is Unique
: Rinse, Wash, Repeat!
: Christ is King.

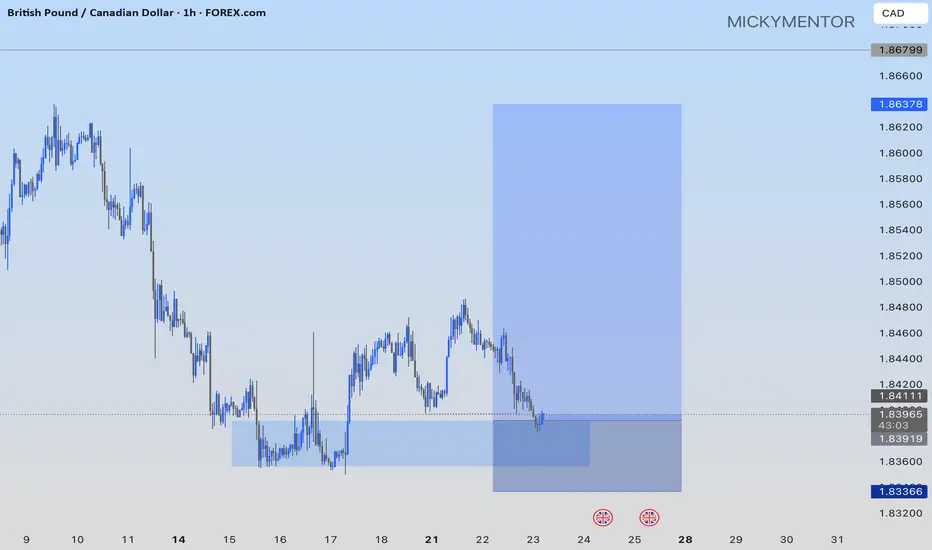
GBPCAD: I’M BUYING NOW!!!OANDA:GBPCAD I’m buying at the current market price with my target at 1.86378
GBPCAD Q3 | D24 | W30 | Y25📊GBPCAD Q3 | D24 | W30 | Y25
Daily Forecast🔍📅
Here’s a short diagnosis of the current chart setup 🧠📈
Higher time frame order blocks have been identified — these are our patient points of interest 🎯🧭.
It’s crucial to wait for a confirmed break of structure 🧱✅ before forming a directional bias.
This keeps us disciplined and aligned with what price action is truly telling us.
📈 Risk Management Protocols
🔑 Core principles:
Max 1% risk per trade
Only execute at pre-identified levels
Use alerts, not emotion
Stick to your RR plan — minimum 1:2
🧠 You’re not paid for how many trades you take, you’re paid for how well you manage risk.
🧠 Weekly FRGNT Insight
"Trade what the market gives, not what your ego wants."
Stay mechanical. Stay focused. Let the probabilities work.
FRGNT

GBPCAD new bearish expecting
OANDA:GBPCAD last analysis we are be accurate (attached), currently continuation type, RAISING WEDGE pattern visible, we are have strong bearish push, and still expectations are bearish.
SUP zone: 1.85000
RES zone: 1.83000, 1.82200

GBPCAD--BUY4h timeframe
--break of descending line (orange line)
--BUY at level around 1.84350
--TP is at upper line of ascending channel

GBPCAD H4 TIMEFRAME. BIG MOVE IS EXPECTED!From the H4 timeframe, price aggressively pushed to the support level of 1.83460 we’re waiting for the next update on price to either see a rebound around the support level or a break below the level. We keep a close watch.

GBPCAD Moving UpAs per our previous analysis GBPCAD has taken off. We can expect a reversal to breakeven point, do not hesitate to add more positions.

LONG ON GBP/CADGBP/CAD is now at a major key area/demand zone after completing its pullback phase.
I expect price to now rise to the next level of supply or previous high.
looking to catch 200-400 pips throughout the week.

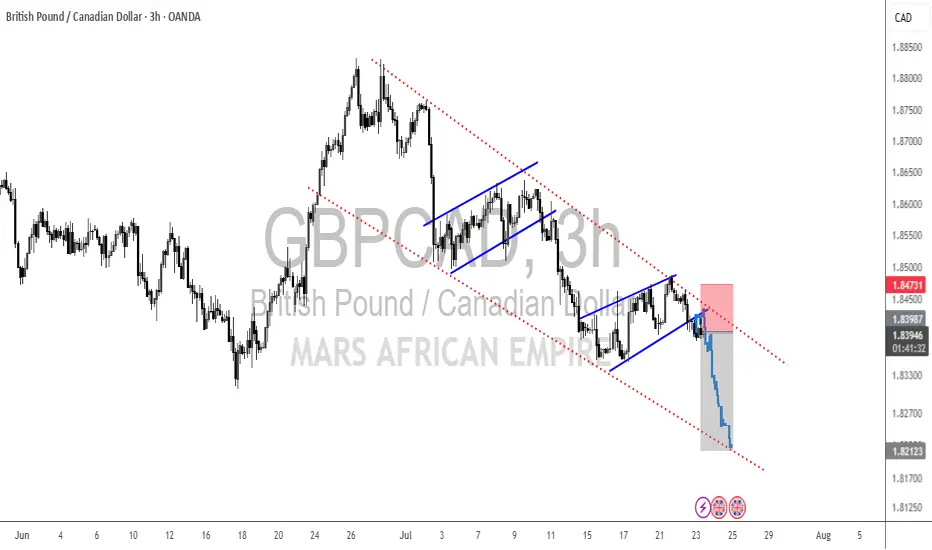
GBP/CAD Downtrend Setup – Clean Heist Entry Strategy🔥💷💣 THE GBP/CAD FOREX HEIST PLAN 💣💷🔥
Thief Trader Style – "Rob the Market, Not Each Other"
🧠 Smart Strategy | 🔍 Deep Analysis | 🎯 High Probability Plays | ⚔️ Risk-Controlled Attack
🌍 Hi! Hola! Ola! Bonjour! Hallo! Marhaba!
Dear Money Makers & Market Robbers, 🤑💰✈️
Welcome to another legendary forex robbery mission – this time, we’re planning the ultimate Pound vs. Loonie Heist (GBP/CAD). Powered by Thief Trading’s precision analysis (both technical & fundamental), this setup is designed for disciplined, stealthy traders who know how to attack at the right moment. Let’s take what’s ours from the market – the Thief way.
🔫 THE SETUP: GBP/CAD MARKET RAID
We’re eyeing a Short Entry near 1.83700 after the Moving Average Breakout Confirmation.
This ain’t just any pullback – this is a trap zone, a Police Barricade ATR Blue Zone, where liquidity fakes out the greedy bulls and invites a high-probability short for those with a thief’s vision.
Chart structure screams: overbought, slowing momentum, divergence + confluence = Bear Attack.
📍 Entry Plan:
💥 “The Heist is ON! Wait for the MA break… Then make your move at 1.83700!”
☑️ Sell Stop Orders – Just above the Moving Average or after key Support Break
☑️ Sell Limit Orders – For pullbacks at 15m or 30m TF near SWING H/L
☑️ Layered Entries / DCA Style – Multiple small entries for maximum control
☑️ Set Alerts! – Chart alarms keep your eyes sharp, your entries sharper.
🚨 Stop Loss Protocol (SL):
🛑 “No SL before breakout. You place early – you get burned.”
🗡️ After Breakout ONLY: SL near 1.84500, 4H Swing High
🛡️ Adapt based on your risk %, lot size, and number of open orders
🤫 Pro Tip: Smart SLs protect you, not limit you. Be like a ghost in the market.
🎯 Target Zone (TP):
📉 Initial Target: 1.82100
💨 “Get in, grab the bag, get out.”
You’re a thief – no greed, just precision. Exit before the alarms ring if the market flips!
🔎 Macro Factors Fueling the Bear Trend:
📉 Hawkish BOC tones down, GDP data contraction vibes
📈 GBP sentiment mixed; technical overbought signals dominate
🎭 Consolidation breakdown = High-Reward Entry Window
📰 News Awareness = Smart Survival:
⚠️ Avoid New Trades During Major News
📍 Use Trailing SLs to Protect Open Profits
🧨 Don’t get caught in the volatility trap – let the chaos work for you, not against you.
💥 BOOST THIS HEIST PLAN – ROBBERS UNITE 💥
Smash the “Boost” Button to power up our Thief Gang's momentum. Your support sharpens the edge for all fellow robbers in this daily market hustle.
🧠 Precision Plan
🧭 Risk-Aligned Entry
📈 Profitable Exit
That’s how Thief Traders operate.
🤑 Stay ready for the next drop. Another Forex bank is about to get robbed clean.
💣💰Let’s rob the charts – not each other.
— Thief Trader, Robbin’ with Logic & Style
🏴☠️📉📲

SHORT in GBPCADHello Fellows,
I’m opening a SHORT position on GBPCAD, supported by the sustained downtrend we've been observing. This move is further reinforced by signs of economic slowdown in the UK, which could continue to weigh on the pound.

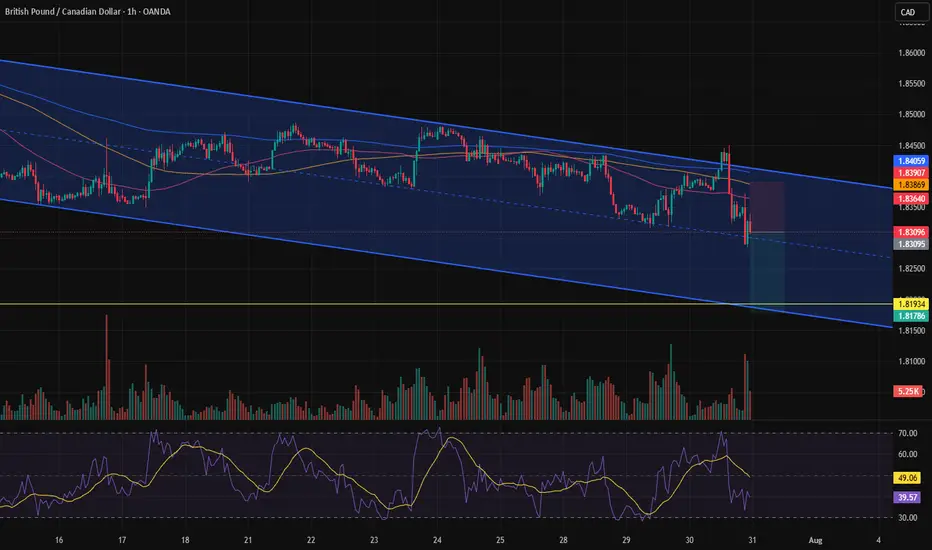
GBPCAD Forming Descending ChannelGBPCAD is currently trading within a well-defined descending channel on the 4H chart, and price action is showing early signs of a potential breakout to the upside. After multiple rejections from the lower boundary, the pair is now consolidating just beneath the channel resistance. If bulls manage to push above the upper trendline with strong volume, it would confirm a bullish breakout, offering a short-term trend reversal opportunity. A clean breakout could lead to a sharp rally toward the 1.8500–1.8600 levels, supported by momentum and market structure.
On the fundamental side, the British pound is gaining strength as markets continue to digest the Bank of England's recent tone, which remains relatively hawkish compared to other G7 central banks. With UK core inflation still elevated and wage growth running hot, the BoE is likely to remain cautious about rate cuts. Meanwhile, the Canadian dollar is under pressure, weighed down by falling oil prices and softer-than-expected Canadian employment data, which fuels expectations of a more dovish Bank of Canada. This divergence creates a bullish backdrop for GBPCAD in the near term.
Traders should watch for a clear break and candle close above the descending channel, especially above the 1.8350–1.8370 resistance zone. A breakout with follow-through would validate bullish continuation, and dips back toward the breakout zone could serve as a retest for new longs. Risk management remains key, with invalidation below recent swing lows around 1.8200. The setup aligns with trendline breakout strategies and could provide favorable risk-to-reward potential for buyers.
Overall, GBPCAD is setting up for a possible bullish reversal after weeks of steady downside. With technical structure aligning and fundamentals supporting GBP strength over CAD, this pair may offer a clean breakout play. Momentum traders should stay alert for confirmation signals and position accordingly to ride the next potential leg up.

GBP/CAD SENDS CLEAR BEARISH SIGNALS|SHORT
GBP/CAD SIGNAL
Trade Direction: short
Entry Level: 1.833
Target Level: 1.821
Stop Loss: 1.840
RISK PROFILE
Risk level: medium
Suggested risk: 1%
Timeframe: 3h
Disclosure: I am part of Trade Nation's Influencer program and receive a monthly fee for using their TradingView charts in my analysis.
✅LIKE AND COMMENT MY IDEAS✅

A move toward the bottom of the channel.After reaching the midline of the channel, a strong green shadow (wick) appeared and the price was rejected, but after that, there were no more green candles. It seems that the price is now inclined to move toward the bottom of the channel.
GBPCAD BUY OPPORTUNITY Price provides a buy opportunity from the current market price of 1.84002. As support level of 1.83192 remain unbroken and the recently formed triangular pattern which is a continuation pattern also get broken. Our buy target profit level is 1.84816.
Take advantage of this potential opportunity.

GBPCADI’m anticipating a price bounce on the daily level (higher timeframe), which looks like a solid buy opportunity to the upside.

GBPCAD waiting to shortbased on daily candle closed yesterday, i'm expecting another bearish move today.
i'm marked the possible resistant area and waiting lower timeframe to do reversal pattern.
calculate your own risk & reward.
Good luck

GBPCAD Will Go Down! Short!
Please, check our technical outlook for GBPCAD.
Time Frame: 1D
Current Trend: Bearish
Sentiment: Overbought (based on 7-period RSI)
Forecast: Bearish
The market is trading around a solid horizontal structure 1.833.
The above observations make me that the market will inevitably achieve 1.813 level.
P.S
Please, note that an oversold/overbought condition can last for a long time, and therefore being oversold/overbought doesn't mean a price rally will come soon, or at all.
Disclosure: I am part of Trade Nation's Influencer program and receive a monthly fee for using their TradingView charts in my analysis.
Like and subscribe and comment my ideas if you enjoy them!

gbpcadThe entry point of 1.83350 is strategically placed to catch the breakout above minor resistance.
The first target at 1.83480 captures a short-term price retracement zone with high probability.
The second target, 1.83610, aligns with the upper boundary of a recent consolidation range.
The third target, 1.83700, is placed just below a psychological resistance level, offering a solid reward.
A tight stop loss at 1.83200 limits downside risk while keeping the risk-reward ratio favorable (approximately 1:2+).

GBP_CAD RISKY SETUP|LONG|
✅GBP_CAD is going down to retest
A horizontal support of 1.8320
Which makes me locally bullish biased
And I think that we will see a rebound
And a move up from the level
Towards the target above at 1.8380
LONG🚀
✅Like and subscribe to never miss a new idea!✅
Disclosure: I am part of Trade Nation's Influencer program and receive a monthly fee for using their TradingView charts in my analysis.
