GBPCADThe price just tapped into a valid order block.
This suggests a potential long (buy) opportunity.
We may see bullish momentum from this zone.
Watch for confirmation like bullish engulfing or BOS or CHOCH.
Place stop loss just below the order block.
Target the next resistance or liquidity zone.
Wait for entry confirmation on lower timeframe.
CADGBP trade ideas

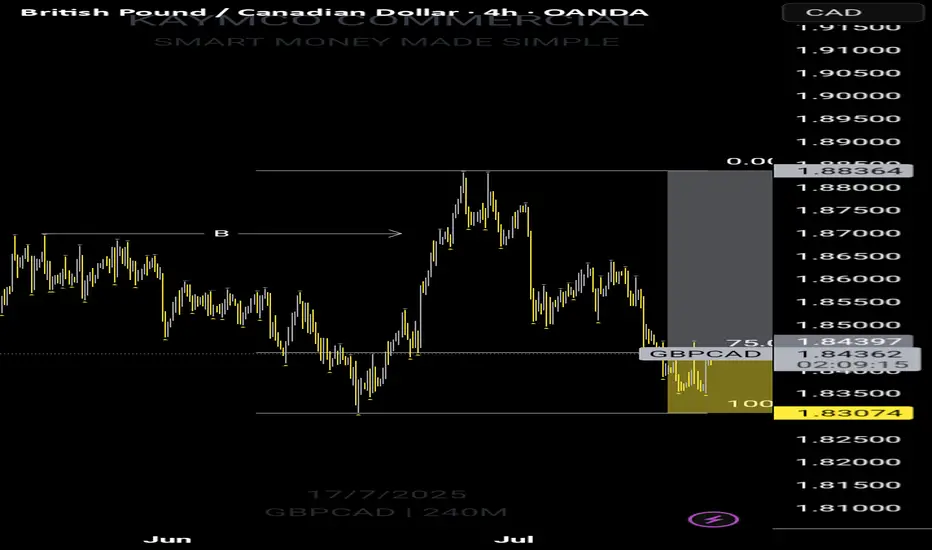
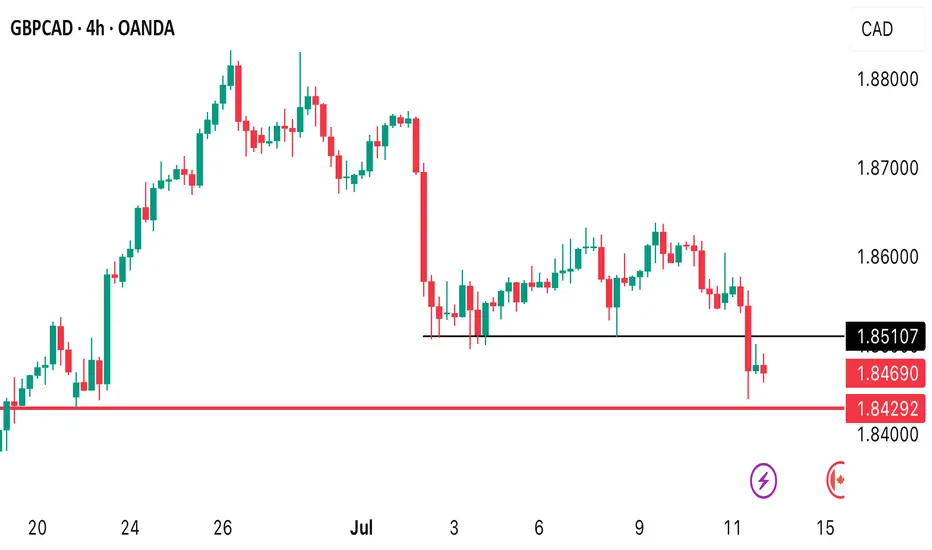
GBPCAD bearish take in place, prepare for sell CAPITALCOM:GBPCAD
4hr mind map
1. bearish momentum destroy the previous strong bullish momentum
2. considering over retest for a bullish
next action:
1. expecting a consolidation around 1.84950
2. need to have a strong bearish momentum in 15/30m TF
3. in 15/30m retest to sell, TP 1.83097

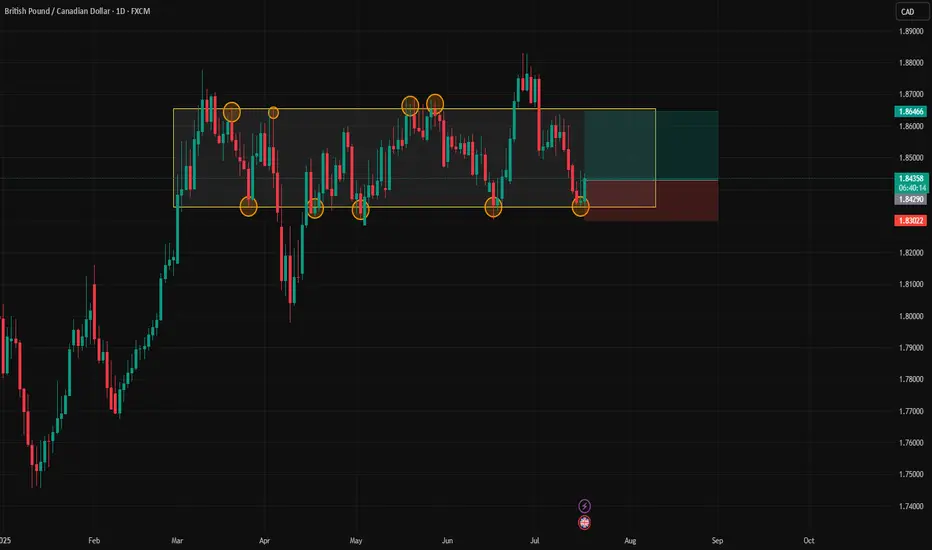
GBPCAD possible buys?Looking at the daily trend, GBPCAD has been bullish and using the fibonacci swing trading points that I usually use- I see potential buys (swing). My trade is strictly 1:3 rr
GBPCAD – Key Level, Buy Setup & Dual StrategyRight now, price is sitting on a major level.
📌 If a valid buy signal shows up, I’ll enter a long position.
But that’s not all…
🔁 If price reaches the next resistance level, I’ll:
Hold my long position
Open a short position there
This way: ✅ If price reverses → my long trade is closed by trailing stop
✅ And my short trade runs into profit
→ I profit both from below and above
⚠️ If my short trade’s SL hits, no worries —
My long is still open and growing in profit.
📈 But if the resistance breaks and we get a pullback,
➡️ I’ll activate pyramiding and build more position with zero added risk.

GBPCAD LONG & SHORT – DAILY FORECAST Q3 | D17/18 | W29 | Y25GBPCAD LONG & SHORT – DAILY FORECAST
Q3 | D17/18 | W29 | Y25
FUN COUPON FRIDAY INCOMING !
Professional Risk Managers 👋
Welcome back to another FRGNT chart update 📈
Today we’re diving into some fresh Forex setups, using a combination of higher time frame order blocks and confirmation through breaks of structure.
Let’s see what price action is telling us today 👀
💡 Key Trade Confluences 📝
✅ Daily order block identified
✅ 4H order block identified
✅ 1H order block identified
🔑 As always, trading involves a degree of risk. That’s why, as Professional Risk Managers, it’s essential that we stay disciplined—sticking to both our risk management plan and our trading strategy.
📈 The rest is left to the balance of probabilities.
💬 Fail to plan, plan to fail.
🏆 It really is that simple.
❤️ Wishing you the very best on your trading journey—I’ll see you at the top.
🎯 Trade consistent,
FRGNT X

GBP/CAD Clarity in Motion! Levels Are Locked In Hey everyone 👋
📌 BUY LIMIT ORDER / GBP/CAD Key Levels
🟢 Entry: 1,83873
🎯 Target 1: 1,84104
🎯 Target 2: 1,84372
🎯 Target 3: 1,85040
🔴 Stop: 1,83316
📈 Risk/Reward Ratio: 2.18
I double-checked the levels and put together a clean, focused analysis just for you. Every single like seriously boosts my motivation to keep sharing 📈 Your support means the world to me!
Huge thanks to everyone who likes and backs this work 💙 Our goals are crystal clear, our strategy is solid. Let’s keep moving forward with confidence and smart execution!

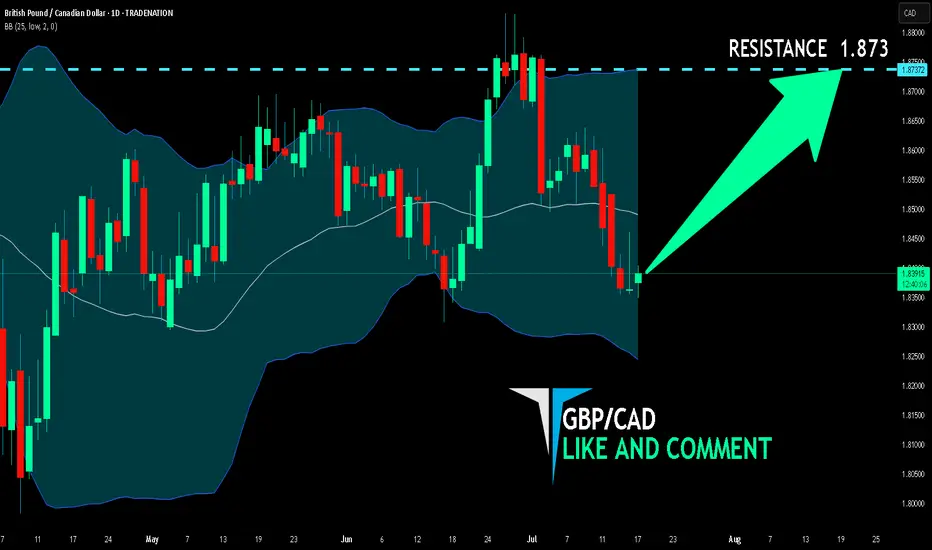
GBP/CAD BULLS ARE GAINING STRENGTH|LONG
Hello, Friends!
We are now examining the GBP/CAD pair and we can see that the pair is going down locally while also being in a downtrend on the 1W TF. But there is also a powerful signal from the BB lower band being nearby indicating that the pair is oversold so we can go long from the support line below and a target at 1.873 level.
Disclosure: I am part of Trade Nation's Influencer program and receive a monthly fee for using their TradingView charts in my analysis.
✅LIKE AND COMMENT MY IDEAS✅
GBPCAD FORMING BEARISH FLAG PATTERNGBPCAD forming bearish trend in 1 hour time frame.
Market is forming lower low which shows indicates bearish trend.
Price is also forming Bearish flag pattern.
Market is expected to remain bearish in upcoming trading sessions.
On lower side market can hit the target levels of 1.84500 & 1.83200
On higher side market may test the resistance level of 1.87700

GBPCAD FORMING BEARISH FLAG PATTERNGBPCAD Bearish Trend Analysis (1-Hour Time Frame)
The GBPCAD pair is currently exhibiting a bearish trend on the 1-hour chart, with the market forming lower lows, confirming a sustained downward momentum. This price action indicates that sellers are in control, and the bearish sentiment is likely to continue in the upcoming trading sessions.
Bearish Flag Pattern Signals Further Decline
The price is forming a bearish flag pattern, a continuation pattern that often leads to further downside movement. This pattern suggests that after a brief consolidation, the pair may resume its downward trajectory. Traders should watch for a breakdown below the flag’s support, which could accelerate the decline.
Key Support and Resistance Levels
- Downside Targets: If the bearish momentum continues, the pair could test 1.84500, followed by 1.83200. These levels may act as potential take-profit zones for short positions.
- Upside Resistance: On the higher side, 1.87700 remains a critical resistance level. A break above this level could temporarily halt the bearish trend, but as long as the price stays below it, the downtrend remains intact.
Trading Strategy
- Short positions could be considered near resistance levels, with stop-loss orders placed above 1.87700 to manage risk.
- A confirmed breakdown below the bearish flag may present additional selling opportunities.
- Traders should monitor price action around support levels (1.84500 & 1.83200) for potential pullbacks or continuation signals.
Conclusion
With the lower lows formation and the bearish flag pattern, GBPCAD is expected to remain under selling pressure. Traders should watch for breakdowns below key support levels while keeping an eye on resistance at 1.87700 for any trend reversal signals.

Buy GBPCADGBPCAD buy setup based on a falling channel pattern. Awaiting in anticipation a break out. Buy now

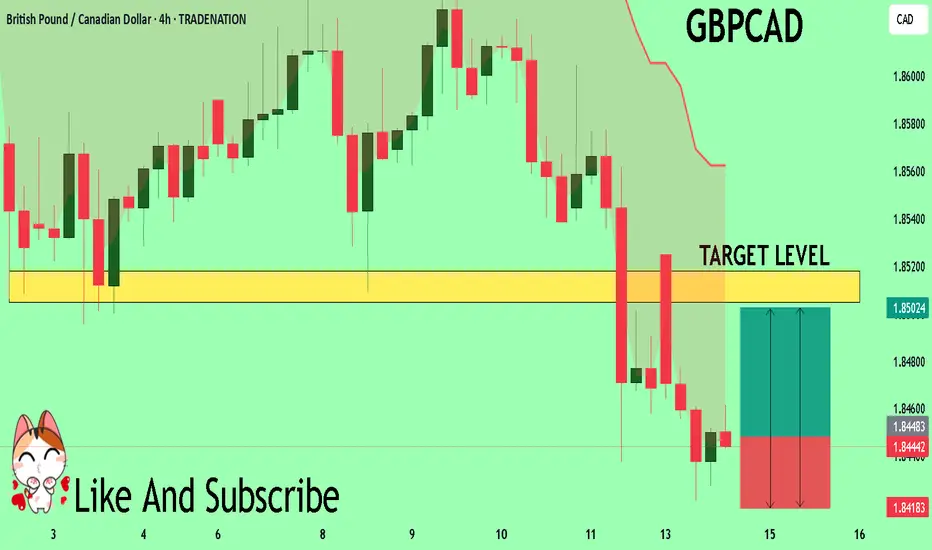
GBP/CAD BEARS ARE GAINING STRENGTH|SHORT
GBP/CAD SIGNAL
Trade Direction: short
Entry Level: 1.858
Target Level: 1.849
Stop Loss: 1.863
RISK PROFILE
Risk level: medium
Suggested risk: 1%
Timeframe: 3h
Disclosure: I am part of Trade Nation's Influencer program and receive a monthly fee for using their TradingView charts in my analysis.
✅LIKE AND COMMENT MY IDEAS✅

GBPCAD SHORT FORECAST Q3 D15 W29 Y25GBPCAD SHORT FORECAST Q3 D15 W29 Y25
Professional Risk Managers👋
Welcome back to another FRGNT chart update📈
Diving into some Forex setups using predominantly higher time frame order blocks alongside confirmation breaks of structure.
Let’s see what price action is telling us today! 👀
💡Here are some trade confluences📝
✅Daily Order block identified
✅4H Order Block identified
✅1H Order Block identified
🔑 Remember, to participate in trading comes always with a degree of risk, therefore as professional risk managers it remains vital that we stick to our risk management plan as well as our trading strategies.
📈The rest, we leave to the balance of probabilities.
💡Fail to plan. Plan to fail.
🏆It has always been that simple.
❤️Good luck with your trading journey, I shall see you at the very top.
🎯Trade consistent, FRGNT X

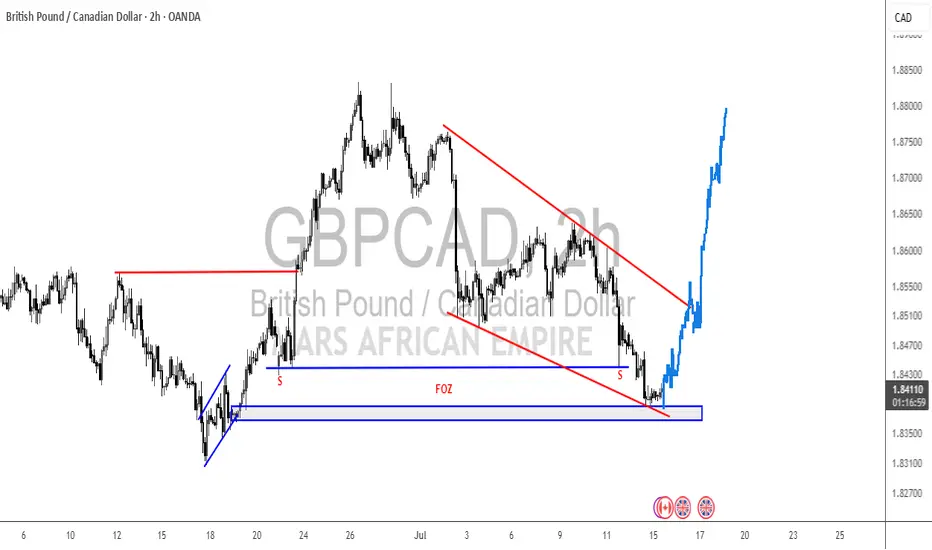
GBPCAD Bulls Preparing – Watching Break Above VWAP🔹 Current View:
The pair has formed a Double Bottom pattern around 1.8500 after a strong bearish drop from a Double Top near the 4H Supply Zone. This indicates a potential reversal.
🔹 VWAP Insight:
The blue line is VWAP, acting as dynamic resistance. Price is currently testing this area. A clean break above it could confirm bullish momentum.
🔹 My Trading Plan:
I’m waiting for the price to move above the VWAP and reach my key level at 1.86400 to enter a long trade.
➡️ Entry: 1.86400
➡️ Target: 1.87200 (near previous supply zone high)
🔹 Technical Summary:
- Bearish Pressure Origin: Double Top + 4H Order Block
- Bullish Signal: Double Bottom formation
- VWAP Breakout Watch: Key for confirming strength
If the price clears VWAP and hits the entry, I’ll look for a move toward the 1.87200 resistance zone.
GBP-CAD Support Ahead! Buy!
Hello,Traders!
GBP-CAD keeps falling down
But a strong horizontal support
Level of 1.8322 is ahead so after
The retest we will be expecting
A local bullish rebound
Buy!
Comment and subscribe to help us grow!
Check out other forecasts below too!
Disclosure: I am part of Trade Nation's Influencer program and receive a monthly fee for using their TradingView charts in my analysis.

GBPCAD SHORTMarket structure bearish on HTFs DH
Entry at both Weekly and Daily AOi
Weekly Rejection at AOi
Daily Rejection at AOi
Daily EMA retest
Previous Structure point Daily
Around Psychological Level 1.85500
H4 Candlestick rejection
Rejection from Previous structure
Levels 4.04
Entry 100%
REMEMBER : Trading is a Game Of Probability
: Manage Your Risk
: Be Patient
: Every Moment Is Unique
: Rinse, Wash, Repeat!
: Christ is King.

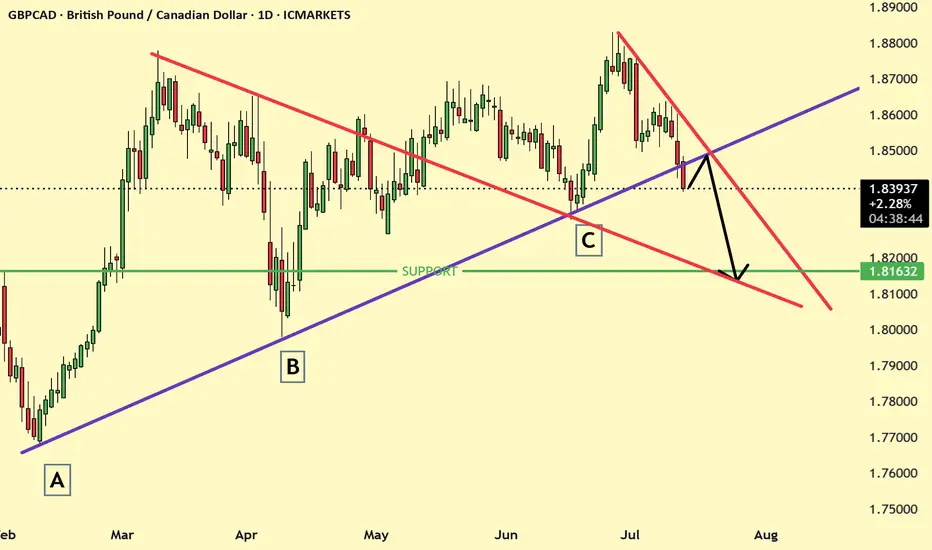
GBPCAD possible bearish set up GBPCAD is currently trending in a down trend and it broke the trend line support and soon may retest the resistance and may go down.
GBPCAD Massive Long! BUY!
My dear friends,
Please, find my technical outlook for GBPCAD below:
The instrument tests an important psychological level 1.8447
Bias - Bullish
Technical Indicators: Supper Trend gives a precise Bullish signal, while Pivot Point HL predicts price changes and potential reversals in the market.
Target - 1.8505
Recommended Stop Loss - 1.8418
About Used Indicators:
Super-trend indicator is more useful in trending markets where there are clear uptrends and downtrends in price.
Disclosure: I am part of Trade Nation's Influencer program and receive a monthly fee for using their TradingView charts in my analysis.
———————————
WISH YOU ALL LUCK
GBP/CAD: Smart Money Heist Strategy – Ready for the Breakout?💼💣 GBP/CAD Forex Bank Heist Plan 🚨 | "Thief Trading Style" 💹💰
🌟 Hi! Hola! Ola! Bonjour! Hallo! Marhaba! 🌟
Welcome to all strategic traders, market tacticians & opportunity seekers! 🧠💸
Here’s our latest Forex blueprint based on the exclusive “Thief Trading Style” – a blend of tactical technicals, smart fundamentals, and stealthy price action moves. We’re preparing for a potential breakout heist on the GBP/CAD a.k.a “The Pound vs Loonie”.
🗺️ Heist Strategy Overview:
The market is forming a bullish setup with signs of consolidation, breakout potential, and trend reversal dynamics. We're eyeing a long entry, but timing is everything. This setup seeks to "enter the vault" just as resistance is breached and ride the move until the ATR High-Risk Zone—where many market players may exit.
🎯 Entry Plan:
📈 Primary Trigger Zone: Watch for a break and close above 1.87000.
🛎️ Set an alert! You’ll want to be ready when the opportunity knocks.
📍Entry Tips:
Place Buy Stop orders above the moving average or
Use Buy Limit entries on pullbacks near recent 15/30min swing lows.
(Perfect for both scalpers and swing traders!)
🛑 Stop Loss Placement:
Thief Trading Style uses a flexible SL system:
Recommended SL at the nearest 4H swing low (~1.85700)
Adjust SL based on your lot size, risk appetite & number of orders
🎤 Reminder: Set SL after breakout confirmation for buy-stop entries. No fixed rule—adapt to your style but manage risk wisely.
🎯 Target Zone:
🎯 Primary TP: 1.89000
🏃♂️ Or exit earlier if price enters a high-risk reversal area
🧲 Scalpers: Stick to long-side trades only and protect your profits with a trailing SL.
🔍 Why GBP/CAD? (Fundamental Notes):
Current momentum is bullish, supported by:
📊 Quant & Sentiment Analysis
📰 Macro Fundamentals & COT Data
📈 Intermarket Trends & Technical Scoring
Get the full data klick it 🔗
⚠️ Caution During News:
To avoid volatility spikes:
Refrain from entering new positions during high-impact news
Use trailing SLs to protect running profits
❤️ Show Support & Stay Tuned:
Smash the 🔥Boost Button🔥 if you love this kind of analysis!
Support the strategy, strengthen our community, and let’s continue this journey of smart, stylish trading.
Stay tuned for the next “heist plan” update—trade smart, stay alert, and manage your risk like a pro. 🏆📈🤝

GBP/CAD H4 timeframe analysis!!Price slowed down in sell momentum just before market closed on Friday. Technical, price is at low level where I’d be anticipating either for price to break below it or we’re going to see a reversal in time from the H4. I’d be looking forward to seeing how price reacts in coming week.

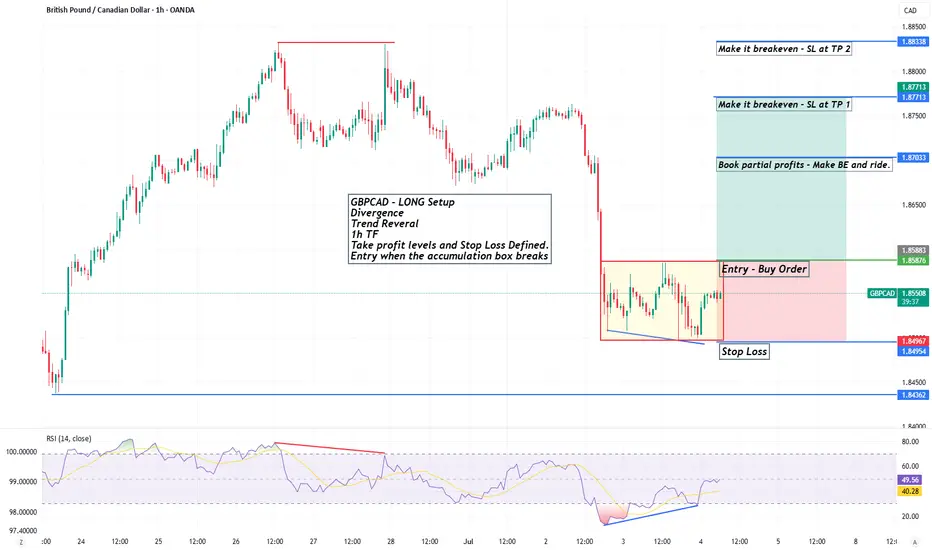
GBPCAD - LONG SetupGBPCAD - LONG Setup
Divergence
Trend Reveral
1h TF
Take profit levels and Stop Loss Defined with suggestion for breakeven and partial profits
Entry when the accumulation box breaks