GBPCAD → Retest the area of interest before growthFX:GBPCAD is closing the imbalance area as part of a countertrend correction and consolidating below the 0.5 Fibonacci level. What's next, growth or decline?
The global trend is upward, and the situation is classic: the market needs energy and liquidity to continue growing.
Locally, we see that as part of a countertrend correction, the market is closing the imbalance area, but at the same time forming consolidation below 0.5 Fibonacci, still leaving the zone of interest and order block below 1.84600 untouched.
Technically, there is a fairly high probability of continued growth, provided that the price ends its consolidation with a breakout of the 1.85690 resistance and consolidates above 0.5 Fibonacci.
Resistance levels: 1.85690, 1.8657
Support levels: 1.84986, 1.846, 1.8417
However, as an additional and, in my opinion, the most important scenario, I still consider a complete closure of the fvg and a retest of the 0.7-0.79 zone, within which the order block is located. A false breakdown of the zone of interest and the capture of liquidity could attract additional interest, which would trigger growth.
Best regards, R. Linda!
CADGBP trade ideas


Looking at a bearish marketWe have a clear dealing range with the dealing range high at 1.88296 and dealing range low at 1.83054. This appear to be a bearish market because the daily liquidity has been raided and the structure has been broken to the downside to mitigate the fair value gap around the equilibrium price. We are ideally anticipating price to rebalance the imbalance and active the fair value gap at the extreme premium and provide us with a selling opportunity to the discounted area…

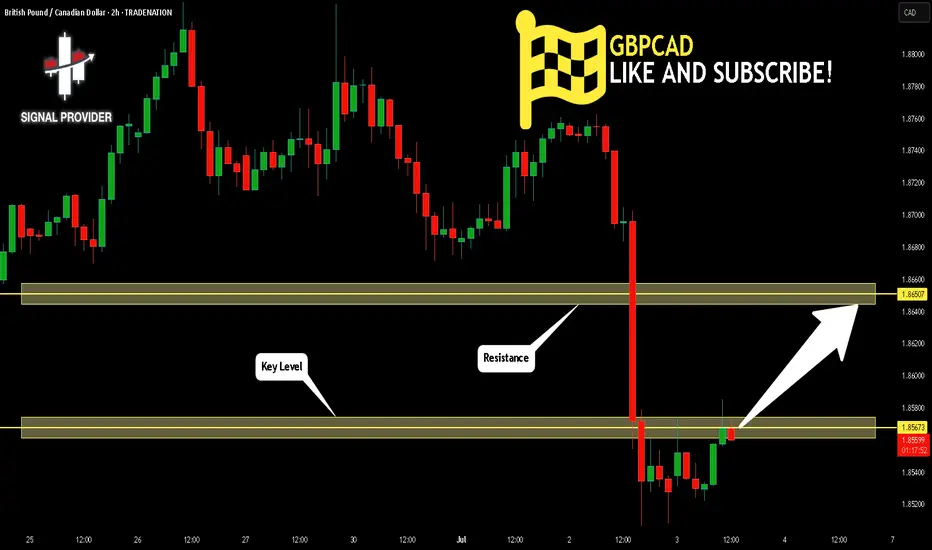
GBP_CAD BEARISH BREAKOUT|SHORT|
✅GBP_CAD broke the key structure level of 1.8580
While trading in an local downtrend
Which makes me bearish
And as the retest of the level is complete
Bearish continuation will follow
SHORT🔥
✅Like and subscribe to never miss a new idea!✅
Disclosure: I am part of Trade Nation's Influencer program and receive a monthly fee for using their TradingView charts in my analysis.

GBPCAD higher fall expecting
OANDA:GBPCAD strong bearish fall we are have, price currently on sup zone, expecting break of same and higher bearish here.
SUP zone: 1.85600
RES zone: 1.84000

GBPCAD corrective pullback, support retest at 1.8500The GBPCAD currency pair price action sentiment appears Bullish, supported by the current rising trend. The recent intraday price action seems to be a sideways consolidation breakout.
The key trading level is at the 1.8500 level, the previous consolidation price range. A corrective pullback from the current levels and a bullish bounce back from the 1.8500 level could target the upside resistance at 1.8890, followed by the 1.9000 and 1.9090 levels over the longer timeframe.
Alternatively, a confirmed loss of the 1.8500 support and a daily close below that level would negate the bullish outlook, opening the way for a further retracement and a retest of 1.8430 support level, followed by 1.83450 levels.
Conclusion:
As long as 1.8500 holds, the bias remains bullish, favouring continuation toward the 1.8900 zone. A confirmed break below this support would shift momentum, opening the door for a broader corrective decline.
This communication is for informational purposes only and should not be viewed as any form of recommendation as to a particular course of action or as investment advice. It is not intended as an offer or solicitation for the purchase or sale of any financial instrument or as an official confirmation of any transaction. Opinions, estimates and assumptions expressed herein are made as of the date of this communication and are subject to change without notice. This communication has been prepared based upon information, including market prices, data and other information, believed to be reliable; however, Trade Nation does not warrant its completeness or accuracy. All market prices and market data contained in or attached to this communication are indicative and subject to change without notice.

GBP/CAD Very Near Selling Area , Ready To Get 200 Pips ?Here is my daily chart on GBP/CAD , We have a very good res area the price very near it now and i`m waiting for touch for this res area and then i will enter a sell trade and targeting 200 pips at least , just waiting the price to give ma a good bearish price action from my res area and then i will enter . if the price close with daily candle above my res then this idea will not be valid .

GBPCAD Is Going Up! Long!
Here is our detailed technical review for GBPCAD.
Time Frame: 2h
Current Trend: Bullish
Sentiment: Oversold (based on 7-period RSI)
Forecast: Bullish
The market is trading around a solid horizontal structure 1.856.
The above observations make me that the market will inevitably achieve 1.865 level.
P.S
Please, note that an oversold/overbought condition can last for a long time, and therefore being oversold/overbought doesn't mean a price rally will come soon, or at all.
Disclosure: I am part of Trade Nation's Influencer program and receive a monthly fee for using their TradingView charts in my analysis.
Like and subscribe and comment my ideas if you enjoy them!
GBPCAD: Your Trading Plan Explained 🇬🇧🇨🇦
GBPCAD is coiling on an important daily support cluster.
To trade that with a confirmation, pay attention to
an inside bar pattern on a 4H.
1.8579 is the level of an upper boundary of its range.
Its breakout and a 4H candle close above will provide
a strong bullish signal.
A bullish movement will be expected to 1.865 level then.
❤️Please, support my work with like, thank you!❤️
I am part of Trade Nation's Influencer program and receive a monthly fee for using their TradingView charts in my analysis.

GBP/CAD💰Symbol: { GBP/CAD }
🟩Price: { 1.86824 }
🟥Stop: { 1.87682 }
1️⃣profit: { 1.85663 }
2️⃣profit: { 1.84413 }
3️⃣profit: { 1.83550 }
4️⃣profit: { 1.83156 }
📊Check your chart before entering.
🚨Check before use to make sure there is no important news.🚨

Solid TCB setup for GBPCAD✅ Trend (HTF Bias)
D1 and H4 are likely bullish (based on prior swing structure and channel direction).
The price was respecting the ascending channel until this sharp breakdown.
✅ Countertrend
A rising wedge / ascending channel is clearly visible.
The recent impulse down broke structure cleanly — textbook countertrend break.
✅ Breakout
Price has broken below the lower ascending trendline.
It’s now retesting the zone at ~1.8700–1.8710 (highlighted).
If this retest holds, it’s a high-probability sell setup.
📊 Total Score: ~95% TCB Trade Quality
🧾 Execution Thoughts:
Entry: Current price (~1.8701) after retest rejection.
SL: Just above 1.8730–1.8740 (above retest wick).
TP: ~1.8675 zone (bottom of the zone), for ~2R.
🔔 Verdict:
✅ It’s a solid TCB setup: Retest after clean break of structure, inside HTF channel break, with decent R:R.
You may wait for a confirming bearish candle
Trigger: Wait for bearish engulfing / rejection wick confirmation.

GBP_CAD WILL KEEP GROWING|LONG|
✅GBP_CAD is trading in an
Uptrend and the pair made a
Retest and a rebound from the
Horizontal support of 1.8675
So we are bullish biased and
We will be expecting a
Further bullish move up
LONG🚀
✅Like and subscribe to never miss a new idea!✅
Disclosure: I am part of Trade Nation's Influencer program and receive a monthly fee for using their TradingView charts in my analysis.

GBPCAD 4H long setupGBPCAD 4H Spring 💡 | Smart Money Accumulation Before Expansion
Watching a textbook Wyckoff spring unfold here on the 4H.
After a multi-day rally, price retraced, and liquidity built up just above 1.8713. What happened next?
🔻 We got a liquidity sweep, tagging below 1.8687 — then a sharp rejection wick back into the range. That’s the spring.
🧠 Why this matters:
Liquidity below the range is now likely cleared.
Smart money triggered stops and may now flip positioning.
Buyer momentum reclaiming the broken zone signals strength returning.
🎯 My Play:
Long entry after reclaim above 1.8713
Stop below 1.8687 wick low
Targeting 1.8828 > 1.8830 as TP1
Extended TP at 1.8928 — aligning with prior supply zone
⚠️ Invalidation if we lose 1.8685 with momentum and no absorption.
This is not a chase trade — it’s a calculated entry after weak hands were shaken out. Let the market prove strength, then ride the reversion.
📈 If this spring holds, I expect continuation toward prior highs.

GBPCADThe first level I’ve marked is a short-term zone.
If we get a strong buy signal there with good R/R, I’ll enter and trail aggressively.
The second level is a stronger demand zone and a better area for potential long setups.
❗️Remember: These are just scenarios — not predictions.
We stay ready for whatever the market delivers.

Bullish Trend in the GBPCAD chartChart showing bullish ternd and also a divergence which will change the trend and I am taking my trade as it will be bearish chart after divergence.
GBPCAD ENTER INTO DOWNTREND STRUCTUREGBPCAD ENTER INTO DOWNTREND STRUCTURE.
Price break the key support level and formed lower low.
Market is expected to remain Bearish in upcoming sessions.
On higher side market may test the resistance level of 1.8690.
On bearish side market may achieve target level of 1.8320.

GBP/CAD Turns Lower After Breaking 1.8709 SupportGBP/CAD broke below the 1.8709 support, and as of this writing, it is testing this level as resistance.
From a technical perspective, a new bearish wave could be on the horizon if the price holds below the previous day's high. In this scenario, the next bearish target could be the 1.8592 low.

Failed to break higher — now it’s time to crash.After a sharp rally, the market has hit its previous all-time high.
📌 A double top is now forming — signaling a potential short-term pullback.
Get ready for a possible dip — let’s go! 🚨
OANDA:GBPCAD

GBPCAD Set To Grow! BUY!
My dear friends,
GBPCAD looks like it will make a good move, and here are the details:
The market is trading on 1.8698 pivot level.
Bias - Bullish
Technical Indicators: Supper Trend generates a clear long signal while Pivot Point HL is currently determining the overall Bullish trend of the market.
Goal - 1.8728
About Used Indicators:
Pivot points are a great way to identify areas of support and resistance, but they work best when combined with other kinds of technical analysis
Disclosure: I am part of Trade Nation's Influencer program and receive a monthly fee for using their TradingView charts in my analysis.
———————————
WISH YOU ALL LUCK

GBPCAD Will Move Higher! Long!
Please, check our technical outlook for GBPCAD.
Time Frame: 12h
Current Trend: Bullish
Sentiment: Oversold (based on 7-period RSI)
Forecast: Bullish
The market is approaching a key horizontal level 1.842.
Considering the today's price action, probabilities will be high to see a movement to 1.855.
P.S
We determine oversold/overbought condition with RSI indicator.
When it drops below 30 - the market is considered to be oversold.
When it bounces above 70 - the market is considered to be overbought.
Disclosure: I am part of Trade Nation's Influencer program and receive a monthly fee for using their TradingView charts in my analysis.
Like and subscribe and comment my ideas if you enjoy them!

GBP/CAD BULLS ARE GAINING STRENGTH|LONG
Hello, Friends!
GBP/CAD is trending up which is evident from the green colour of the previous weekly candle. However, the price has locally plunged into the oversold territory. Which can be told from its proximity to the BB lower band. Which presents a beautiful trend following opportunity for a long trade from the support line below towards the supply level of 1.850.
Disclosure: I am part of Trade Nation's Influencer program and receive a monthly fee for using their TradingView charts in my analysis.
✅LIKE AND COMMENT MY IDEAS✅

GBPCAD - BearishGBPCAD has formed a double top on 1H timeframe. Taking sell entry on break of neckline.

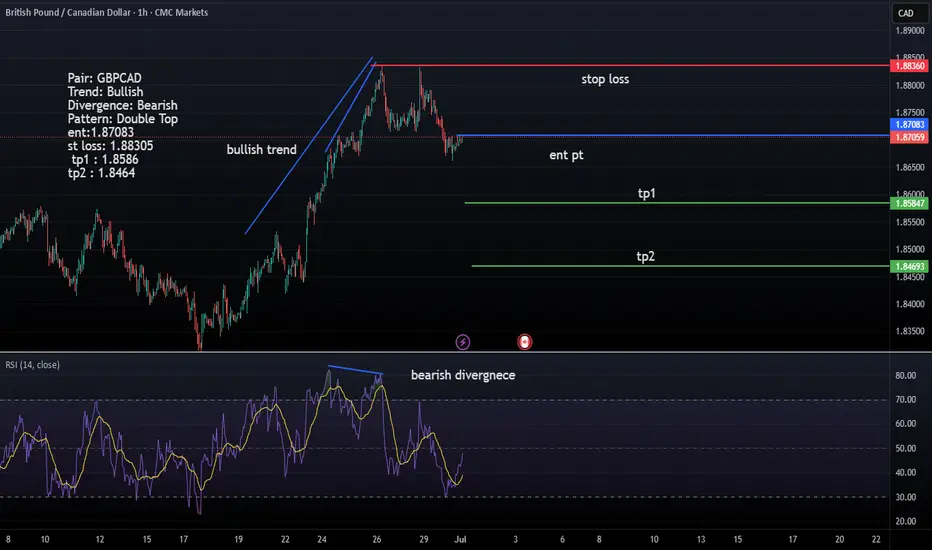
GBP/CAD – Bearish Reversal Setup (1H Timeframe)We’re currently observing the GBP/CAD pair, which has been in a strong bullish trend. However, clear signs of a potential reversal are now forming.
A classic Double Top pattern has emerged on the 1H chart, supported by bearish divergence — both indicating weakening bullish momentum. With this confluence, we anticipate a trend reversal from bullish to bearish and are preparing a sell trade setup accordingly.
🔹 Pair: GBP/CAD
🔹 Timeframe: 1H
🔹 Trend: Bullish (reversal expected)
🔹 Pattern: Double Top
🔹 Divergence: Bearish
🔹 Bias: Bearish
🔹 Entry (Sell Stop): 1.87077
🔹 Stop Loss: 1.88371
🔹 Take Profit 1: 1.85783
🔹 Lot Size: 0.21
🔹 Risk/Reward: 1:1
🔹 Risk: $200
🔹 Potential Reward: $200
🎯 Strategy: Entry will activate only after a confirmed break below the neckline of the double top. Risk is controlled with a clear stop-loss and 1:1 reward setup.
📌 #GBPCAD #ForexSignals #DoubleTop #BearishReversal #TechnicalAnalysis #DivergenceTrading #TrendReversal #SmartMoney #1HChart #ForexTradeIdeas #BearishSetup #RiskManagement #PriceAction
