CADJPY BIAS!!On the MONTHLY TIMEFRAME, We spotted a strong resistance currently acting as support of which price has reacted to in the past months by forming a strong wick rejection monthly candles right at the zone however we want to sit back and wait for this monthly candle close to give us a good rejection price action candle right at the zone before we can look at the weekly timeframe to establish a possible bullish bias and of course an entry long
CADJPY trade ideas

CAD/JPY Short SetupTechnical Analysis: CAD/JPY has surged to a resistance level around 107.75, which previously acted as a significant barrier. The pair is exhibiting signs of overbought conditions, and a pullback towards 105.50 is plausible. 
• Fundamental Factors: The Bank of Japan (BOJ) is expected to announce a rate hike soon, with markets already pricing in two 25bps increases by the end of 2025. This anticipation strengthens the JPY, potentially leading to a decline in CAD/JPY. 
• Market Sentiment: Recent statements from the U.S. administration suggest plans to impose a 25% tariff on imports from Canada and Mexico. This development could pressure the CAD, particularly against the JPY, as investors seek safe-haven assets. 

[CADJPY] Trade ideaLate entry on this asset but still a great scenario for me, going to try the first long entry there and manage it.
Great Trade !

CAD/JPY For Bullishyou can go long now
or
wait for pull-back near by entry point and then go long
general trend is up trend
have fun :)

USD/JPY Trade Recap, AUD/JPY Long, AUD/USD Short & CAD/JPY ShortAUD/JPY Long
Minimum entry requirements:
• 1H impulse up above area of interest.
• If tight non-structured 15 min continuation follows, 5 min risk entry within it if the continuation is structured on the 5 min chart or reduced risk entry on the break of it.
• If tight structured 15 min continuation follows, reduced risk entry on the break of it or 15 min risk entry within it.
AUD/USD Short
Minimum entry requirements:
• If tight non-structured 1H continuation forms, 15 min risk entry within it if the continuation is structured on the 15 min chart.
• If tight structured 1H continuation follows, 1H risk entry within it.
CAD/JPY Short
Minimum entry requirements:
• If structured 1H continuation forms, 1H risk entry within it.

Cadjpy scenario 29/04/2025English : According to our analysis, we anticipate a bearish scenario.
Morocan Darija : kanchofo d'apres l'analyse dyalna antsanaw hboot
ATENTION : I only share my ideas, not signals

CADJPYThis is what I would consider a "B" setup for myself. Second time this year I'm going for it. Although we are near a strong support level, I would like to see if price could retest the previous support range (color box on chart). Although price has been falling with the bearish activity simmering down a bit, maybe we have bears in the market that haven't fully closed and are still testing the lows before a true move up. Looking for a small target range as listed on the chart.


Longs ContinuationLooking to Hold this Trade for a continuation move.
The Canadian dollar shows strength against the Japanese yen, supported by stable oil prices and a firm Canadian economy.
The Japanese yen's weakness, amid decreasing safe-haven demand, further supports a bullish outlook for this pair.

Update on CADJPY set up.On my last post on CADJPY i had it dropping to 100. - 90. Levels, i still believe price is Bearish overall, been holding this trade for a while, im still holding even do price is already giving me signs of a possible reversal on the 102. Level, but i need more confluences, price did hit my Tp1 at the Market Low ( 101.500 ) if price starts breaking the 104. Level then most likely ill change my bias and give my analysis for a possible next move. Right now, im just holding all the pairs I've posted.

Bullish Week For CAD/JPYPrice traded above a short term high of 103.877 and created a Fair Value Gap that signals a possible Bullish Continuation towards the high made on 9 April 2025 of 105.056.
Pairs like AUD/JPY, EURJPY, GBPJPY, and USDJPY also traded into Fair Value Gaps on the 2H Timeframe

CADJPY Potential longsFX:CADJPY
🇨🇦/🇯🇵
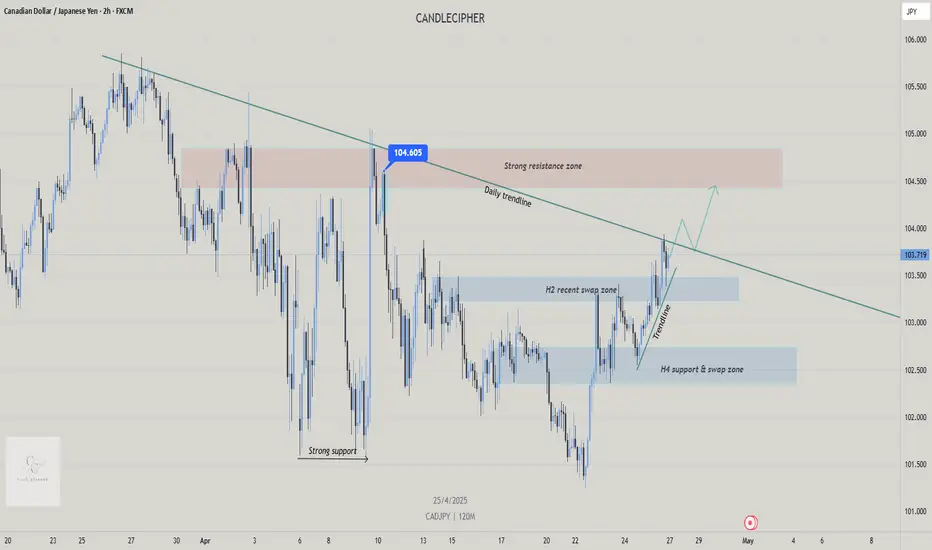
📝 Price spiked by 300 pips after tapping into the strong support on 9 April but lost its momentum shortly after without breaking the daily trendline, suggesting sellers still in control. Price has now reached its daily trendline zone again, on the current price on the day of market close, we see a rejection candle on the 2H chart and slight push upwards.
📝 The buy structures have retraced to its demand zones on each key levels before continuing to push price upwards, forming a compression. If price breaks above the daily trendline and closes above with good momentum, I may expect price to go back and contest the 104.604 candle that gave the bears control for 2 weeks. Therefore, we can use lower timeframe confirmation to hop on buys when price breaks upward and retest.
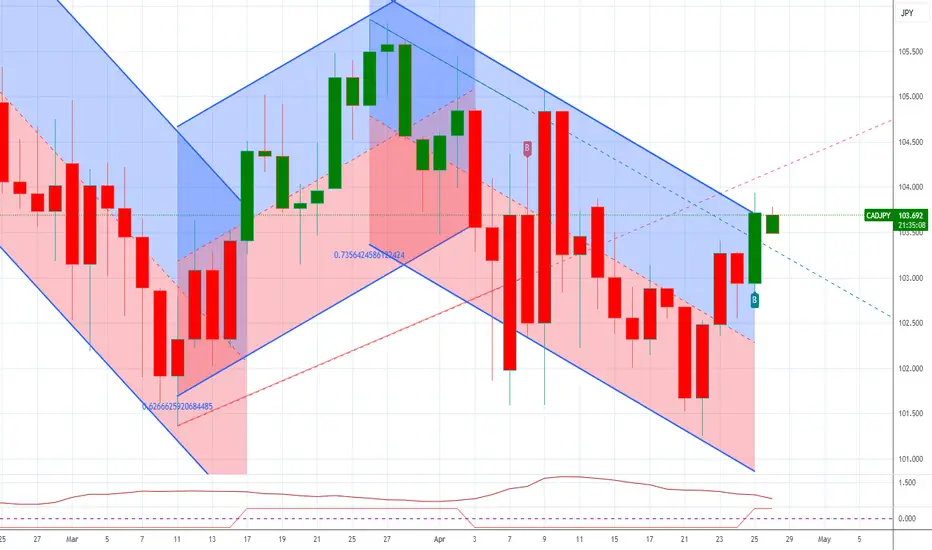
CAD/JPY 2 Day AnalysisOver March and April 2025, price has been trying to break the 101.50 to 102.00 zone which was support in August 2024.
The last 2 day candle in this area printed as a bullish Hammer candle which was followed by 2 more bullish candles.
We may possibly see price break out above the trendline and buyers taking control of the market.
This is an idea of what may happen. Also use a profitable trading strategy combined with good risk management.

CADJPY: Bearish Continuation & Short Trade
CADJPY
- Classic bearish setup
- Our team expects bearish continuation
SUGGESTED TRADE:
Swing Trade
Short CADJPY
Entry Point - 103.70
Stop Loss - 104.30
Take Profit - 102.64
Our Risk - 1%
Start protection of your profits from lower levels
Disclosure: I am part of Trade Nation's Influencer program and receive a monthly fee for using their TradingView charts in my analysis.
❤️ Please, support our work with like & comment! ❤️

CADJPY Technical Analysis! SELL!
My dear subscribers,
CADJPY looks like it will make a good move, and here are the details:
The market is trading on 103.88 pivot level.
Bias - Bearish
Technical Indicators: Both Super Trend & Pivot HL indicate a highly probable Bearish continuation.
Target - 103.40
About Used Indicators:
The average true range (ATR) plays an important role in 'Supertrend' as the indicator uses ATR to calculate its value. The ATR indicator signals the degree of price volatility.
Disclosure: I am part of Trade Nation's Influencer program and receive a monthly fee for using their TradingView charts in my analysis.
———————————
WISH YOU ALL LUCK

CADJPY: B trade A page from my trading journal. Please take it with a grain of salt, as I’m still learning and growing 🌟
Strength on 4H is real, but structure still early — need a pullback HL and follow-through to confirm trend resumption. No entry at current extended level.

CADJPY - Buy IdeaA bullish RSI divergence has formed on the CADJPY daily (1D) chart at a key resistance level, signaling a potential bullish reversal. Wait for a breakout above the descending trendline, followed by a retest of the trendline, to confirm the entry for a long position.

CAD/JPY for Bullishyou can go now
or
wait for pull-back near by entry point and then go long
general trend is up trend
have fun :)


CADJPY is in Bearish trend.CADJPY started printing series of LH and LL. Its a good time for a short trade and can earn a good amount of money.
