CAD/JPY pair may form a long-term BUY trendBased on the analysis, the CAD/JPY pair may form a long-term BUY trend. Based on this analysis, we can try to enter a Buy position with a small risk margin.
CADJPY trade ideas

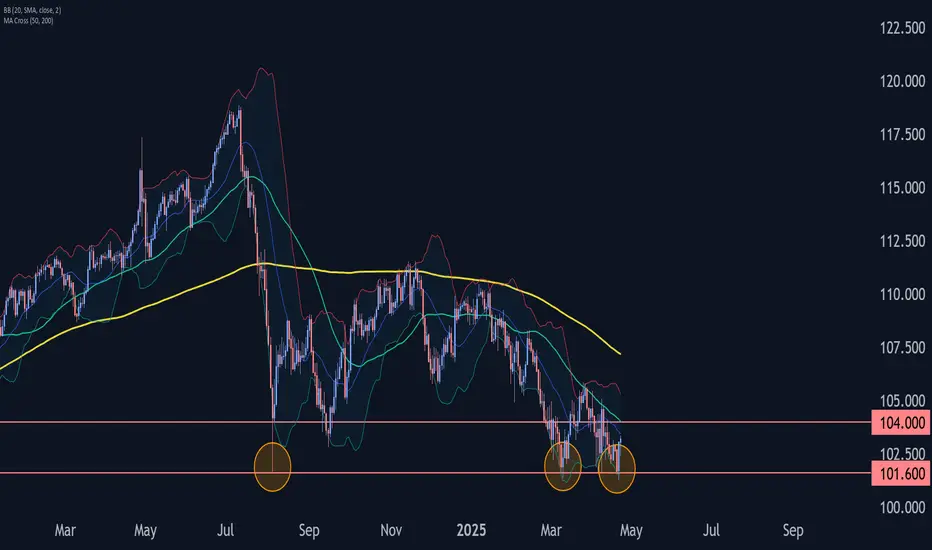
CADJPY Wave Analysis – 23 April 2025
- CADJPY reversed from strong support area
- Likely to rise to resistance level 104.00
CADJPY currency pair recently reversed from the strong support area between the long-term support level 101.60 (which stopped the sharp downtrend in August of 2024) and the lower daily Bollinger Band.
The upward reversal from this support area created the daily Japanese candlesticks reversal pattern Piercing Line.
Given the strength of the support level 101.60 and the bullish Canadian dollar sentiment seen today, CADJPY currency pair can be expected to rise toward the next resistance level 104.00.
CADJPY 30M TimeFrame BuyWe saw a big bullish move on 30M Timeframe and after a little correction another bullish movement may appear
dont use tight stoploss because of downtrend in higher timeframes.

CAD/JPY we reached bottom levels , great time to collect value!Hi guys we are going to take a look at the CAD/JPY Pair!
Technical analisys -
Currently the pair has reached a bottom level around the 101 zone whichwe can see big support from buyers, additionally the MACD is finishing a down turn momentum formulating a cross over towards an Ascending Channel , the RSI is sitting at neutral / oversold areas on 2H and 4H timeframes
Fundamentals - We are still looking into the monetary policy overlooeked from BoJ and additionally the expected economical data from Canada in the eyes of strong Retail Sales.
📌 Trade Plan
📈 Entry: 101.400
✅ Target 1 : 102.200
✅ Target 2 : 103.100
❌ SL: 100.500
R/R is 1:3

Bullish rebound?CAD/JPY is falling towards the pivot which is a pullback support and could bounce to the 1st resistance which acts as a pullback resistance.
Pivot: 100.55
1st Support: 98.99
1st Resistance: 104.88
Risk Warning:
Trading Forex and CFDs carries a high level of risk to your capital and you should only trade with money you can afford to lose. Trading Forex and CFDs may not be suitable for all investors, so please ensure that you fully understand the risks involved and seek independent advice if necessary.
Disclaimer:
The above opinions given constitute general market commentary, and do not constitute the opinion or advice of IC Markets or any form of personal or investment advice.
Any opinions, news, research, analyses, prices, other information, or links to third-party sites contained on this website are provided on an "as-is" basis, are intended only to be informative, is not an advice nor a recommendation, nor research, or a record of our trading prices, or an offer of, or solicitation for a transaction in any financial instrument and thus should not be treated as such. The information provided does not involve any specific investment objectives, financial situation and needs of any specific person who may receive it. Please be aware, that past performance is not a reliable indicator of future performance and/or results. Past Performance or Forward-looking scenarios based upon the reasonable beliefs of the third-party provider are not a guarantee of future performance. Actual results may differ materially from those anticipated in forward-looking or past performance statements. IC Markets makes no representation or warranty and assumes no liability as to the accuracy or completeness of the information provided, nor any loss arising from any investment based on a recommendation, forecast or any information supplied by any third-party.

CADJPY Possible Sell TradeHere's how I'm watching CADJPY for potential shorts . Trend continuation trade. Do Your Own Analysis.

CADJPY Expected Growth! BUY!
My dear friends,
Please, find my technical outlook for CADJPY below:
The instrument tests an important psychological level 102.02
Bias - Bullish
Technical Indicators: Supper Trend gives a precise Bullish signal, while Pivot Point HL predicts price changes and potential reversals in the market.
Target - 102.88
Recommended Stop Loss - 101.50
About Used Indicators:
Super-trend indicator is more useful in trending markets where there are clear uptrends and downtrends in price.
———————————
WISH YOU ALL LUCK

CAD/JPY "Loonie-Yen" Forex Bank Heist Plan (Scalping/Day)🌟Hi! Hola! Ola! Bonjour! Hallo! Marhaba!🌟
Dear Money Makers & Robbers, 🤑 💰💸✈️
Based on 🔥Thief Trading style technical and fundamental analysis🔥, here is our master plan to heist the CAD/JPY "Loonie-Yen" Forex Market. Please adhere to the strategy I've outlined in the chart, which emphasizes long entry. Our aim is the high-risk Yellow MA Line. Risky level, overbought market, consolidation, trend reversal, trap at the level where traders and bearish robbers are stronger. 🏆💸"Take profit and treat yourself, traders. You deserve it!💪🏆🎉
Entry 📈 : "The heist is on! Wait for the MA breakout (104.800) then make your move - Bullish profits await!"
however I advise to Place Buy stop orders above the Moving average (or) Place buy limit orders within a 15 or 30 minute timeframe most recent or swing, low or high level.
📌I strongly advise you to set an "alert (Alarm)" on your chart so you can see when the breakout entry occurs.
Stop Loss 🛑: "🔊 Yo, listen up! 🗣️ If you're lookin' to get in on a buy stop order, don't even think about settin' that stop loss till after the breakout 🚀. You feel me? Now, if you're smart, you'll place that stop loss where I told you to 📍, but if you're a rebel, you can put it wherever you like 🤪 - just don't say I didn't warn you ⚠️. You're playin' with fire 🔥, and it's your risk, not mine 👊."
📍 Thief SL placed at the nearest/swing low level Using the 1H timeframe (103.000) Day / Scalping trade basis.
📍 SL is based on your risk of the trade, lot size and how many multiple orders you have to take.
🏴☠️Target 🎯: 107.000 (or) Escape Before the Target
🧲Scalpers, take note 👀 : only scalp on the Long side. If you have a lot of money, you can go straight away; if not, you can join swing traders and carry out the robbery plan. Use trailing SL to safeguard your money 💰.
CAD/JPY "Loonie-Yen" Forex Market Heist Plan (Scalping / Day Trade) is currently experiencing a bullishness,., driven by several key factors.👇👇👇
📰🗞️Get & Read the Fundamental, Macro, COT Report, Quantitative Analysis, Sentimental Outlook, Intermarket Analysis, Future trend targets..., go ahead to check 👉👉👉🔗
⚠️Trading Alert : News Releases and Position Management 📰 🗞️ 🚫🚏
As a reminder, news releases can have a significant impact on market prices and volatility. To minimize potential losses and protect your running positions,
we recommend the following:
Avoid taking new trades during news releases
Use trailing stop-loss orders to protect your running positions and lock in profits
💖Supporting our robbery plan 💥Hit the Boost Button💥 will enable us to effortlessly make and steal money 💰💵. Boost the strength of our robbery team. Every day in this market make money with ease by using the Thief Trading Style.🏆💪🤝❤️🎉🚀
I'll see you soon with another heist plan, so stay tuned 🤑🐱👤🤗🤩

CAD_JPY RISKY LONG|
✅CAD_JPY fell again and will soon
Retest the support of 101.400
But it is a strong key level
So I think that there is a high chance
We will see a bullish rebound and a move up
LONG🚀
✅Like and subscribe to never miss a new idea!✅
Disclosure: I am part of Trade Nation's Influencer program and receive a monthly fee for using their TradingView charts in my analysis.

Short CADJPY - a little more patience requiredI have been waiting and watching this pair on the daily t/f for several weeks now. Like some people like to say "waiting like a sniper", lol.
Seriously, I became more interested since it formed a flat bottom because I like to trade BO (breakouts) or BO with a pullback. Note that this is a daily chart and price is below the 200sma.
I expect price to continue to make lower highs and break out to occur late this week, possibly next week. Hopefully, you have your own plan on how you trade breakouts. Good luck if you will trade this.
This is not a trade recommendation; it’s merely my own analysis. Trading carries a high level of risk, so only trade with money you can afford to lose and carefully manage your capital and risk. If you like my idea, please give a “boost” and follow me to get even more. Please comment and share your thoughts too!!
It’s not whether you are right or wrong, but how much money you make when you are right and how much you lose when you are wrong – George Soros

CAD/JPY "Loonie-Yen" Forex Bank Heist Plan (Swing Trade)🌟Hi! Hola! Ola! Bonjour! Hallo! Marhaba!🌟
Dear Money Makers & Robbers, 🤑 💰💸✈️
Based on 🔥Thief Trading style technical and fundamental analysis🔥, here is our master plan to heist the CAD/JPY "Loonie-Yen" Forex Bank. Please adhere to the strategy I've outlined in the chart, which emphasizes long entry. Our aim is the high-risk Red Zone. Risky level, overbought market, consolidation, trend reversal, trap at the level where traders and bearish robbers are stronger. 🏆💸Book Profits Be wealthy and safe trade.💪🏆🎉
Entry 📈 : "The heist is on! Wait for the MA breakout (105.100) then make your move - Bullish profits await!"
however I advise to Place Buy stop orders above the Moving average (or) Place buy limit orders within a 15 or 30 minute timeframe most recent or swing, low or high level.
📌I strongly advise you to set an alert on your chart so you can see when the breakout entry occurs.
Stop Loss 🛑:
Thief SL placed at the recent / nearest low level Using the 2H timeframe (103.300) swing trade basis.
SL is based on your risk of the trade, lot size and how many multiple orders you have to take.
🏴☠️Target 🎯: 108.500 (or) Escape Before the Target
🧲Scalpers, take note 👀 : only scalp on the Long side. If you have a lot of money, you can go straight away; if not, you can join swing traders and carry out the robbery plan. Use trailing SL to safeguard your money 💰.
CAD/JPY "Loonie-Yen" Forex Bank Heist Plan (Swing Trade) is currently experiencing a bullishness,., driven by several key factors.
📰🗞️Get & Read the Fundamental analysis, Macro Economics, COT Report, Quantitative Analysis, Intermarket Analysis, Sentimental Outlook, Positioning and future trend...
Before start the heist plan read it.👉👉👉
📌Keep in mind that these factors can change rapidly, and it's essential to stay up-to-date with market developments and adjust your analysis accordingly.
⚠️Trading Alert : News Releases and Position Management 📰 🗞️ 🚫🚏
As a reminder, news releases can have a significant impact on market prices and volatility. To minimize potential losses and protect your running positions,
we recommend the following:
Avoid taking new trades during news releases
Use trailing stop-loss orders to protect your running positions and lock in profits
💖Supporting our robbery plan 💥Hit the Boost Button💥 will enable us to effortlessly make and steal money 💰💵. Boost the strength of our robbery team. Every day in this market make money with ease by using the Thief Trading Style.🏆💪🤝❤️🎉🚀
I'll see you soon with another heist plan, so stay tuned 🤑🐱👤🤗🤩

CAD-JPY Long From Support! Buy!
Hello,Traders!
CAD-JPY is about to hit
A horizontal support level
Around 101.420 so despite
The pair trading in a downtrend
We will be expecting a local
Bullish rebound after the
Retest of the support
Buy!
Comment and subscribe to help us grow!
Check out other forecasts below too!
Disclosure: I am part of Trade Nation's Influencer program and receive a monthly fee for using their TradingView charts in my analysis.

Bearish Setup Valid While CAD/JPY Stays Below 106CAD/JPY is currently trading at 102.68, showing signs of rejection from the 106.00–104.00 resistance zone, which aligns with a bearish Ichimoku cloud (Span A at 105.36, Span B at 108.70). Price remains below the cloud, reinforcing the downtrend bias.
The market has not broken above previous swing highs, confirming that bearish structure is intact. The current move appears to be a retest of broken support turned resistance, now acting as a supply zone.
Both Trend Strength Index (TSI) indicators support downside momentum:
TSI(10): -0.68
TSI(20): -0.84
These values reflect persistent bearish pressure, though not yet fully oversold, leaving room for further downside before reversal signals arise.
The suggested plan is to wait for a retracement back into 104–106, offering better risk-to-reward entries for short positions, with a target at the next support near 96.43, where historical demand has previously stepped in.
Trade Setup Summary:
Entry Zone: 106.00 – 104.00 (resistance + cloud)
Stop Loss: Above 106.28 (recent structure)
Target: 96.43 (key support zone)
Bias: Bearish while below 106.00
As long as price holds below the cloud and fails to break previous highs, the downtrend remains valid.
The Canadian dollar remains tied to oil performance and BoC expectations, while the Japanese yen continues to trade weakly due to the Bank of Japan’s ultra-loose policy. However, CAD/JPY has shown technical exhaustion after a long bullish cycle, and unless oil regains momentum or the BoC shifts more hawkishly, the yen may regain some strength, particularly during risk-off periods. This environment supports short setups in CAD/JPY under technical confluence.
Disclaimer: This content is for educational and informational purposes only. It does not represent financial advice or a recommendation to buy or sell any financial instrument. Trading involves risk, and you should only trade with money you can afford to lose.

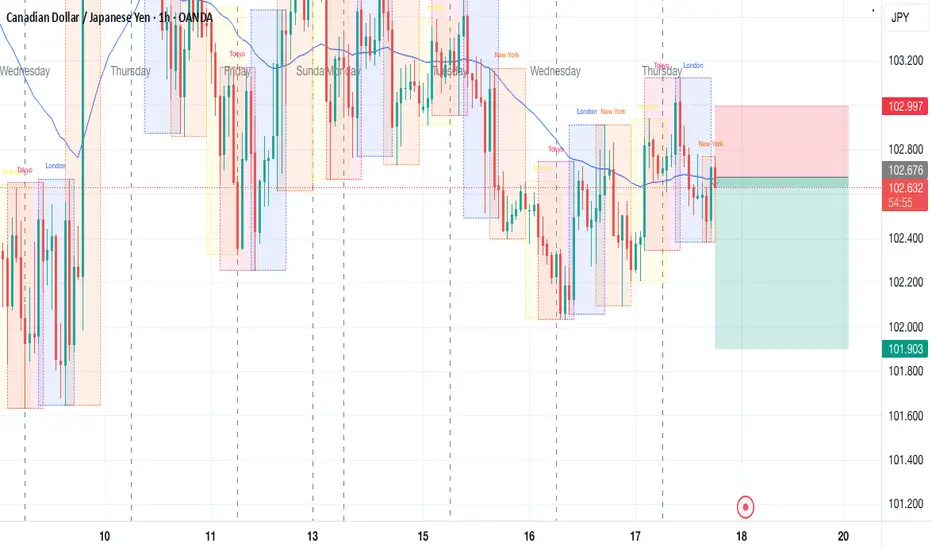
CADJPY My Opinion! BUY!
My dear subscribers,
This is my opinion on the CADJPY next move:
The instrument tests an important psychological level 102.92
Bias - Bullish
Technical Indicators: Supper Trend gives a precise Bullish signal, while Pivot Point HL predicts price changes and potential reversals in the market.
Target - 103.71
My Stop Loss - 102.57
About Used Indicators:
On the subsequent day, trading above the pivot point is thought to indicate ongoing bullish sentiment, while trading below the pivot point indicates bearish sentiment.
Disclosure: I am part of Trade Nation's Influencer program and receive a monthly fee for using their TradingView charts in my analysis.
———————————
WISH YOU ALL LUCK

CADJPY Wave Analysis – 17 April 2025
- CADJPY reversed from key support level 102.00
- Likely to rise to the resistance level 104.00
CADJPY currency pair recently reversed up from the key support level 102.00 (which has been reversing the price since August of 2024) standing close to the lower daily Bollinger Band.
The upward reversal from this support level is likely to form the weekly daily candlesticks reversal pattern Morning Star – a strong buy signal for CADJPY.
Given the strength of the support level 102.00, the CADJPY currency pair can be expected to rise to the next resistance level 104.00.

CADJPY Will Go Up From Support! Long!
Here is our detailed technical review for CADJPY.
Time Frame: 4h
Current Trend: Bullish
Sentiment: Oversold (based on 7-period RSI)
Forecast: Bullish
The market is on a crucial zone of demand 102.547.
The underlined horizontal cluster clearly indicates a highly probable bullish movement with target 103.850 level.
P.S
The term oversold refers to a condition where an asset has traded lower in price and has the potential for a price bounce.
Overbought refers to market scenarios where the instrument is traded considerably higher than its fair value. Overvaluation is caused by market sentiments when there is positive news.
Disclosure: I am part of Trade Nation's Influencer program and receive a monthly fee for using their TradingView charts in my analysis.
Like and subscribe and comment my ideas if you enjoy them!

CADJPY is perhaps the best sell signal long-term.The CADJPY pair has broken marginally below its 1W MA200 (orange trend-line) in recent weeks and turned sideways. This took place on the latest 1W MA50 (blue trend-line) rejection on January 13 2025. As long as the market remains below it, the long-term trend-line will be bearish.
The current 1W MA200 consolidation is in fact similar to what followed after the last major long-term rejection in December 2014. As you can see on the chart, we are on similar trading patterns as August - September 2015. Even the 1W RSI sequences among the two fractals are identical, starting off strong Bearish Divergencies that basically were an early signal for the 2015 - 2016 sell-off and possibly now the 2025 - 2026 sell-off.
As a result, we are bearish on this pair, expecting a 85.000 Target on high probabilities and a 2nd at 75.000 on lower, which is the 14-year Support Zone.
-------------------------------------------------------------------------------
** Please LIKE 👍, FOLLOW ✅, SHARE 🙌 and COMMENT ✍ if you enjoy this idea! Also share your ideas and charts in the comments section below! This is best way to keep it relevant, support us, keep the content here free and allow the idea to reach as many people as possible. **
-------------------------------------------------------------------------------
Disclosure: I am part of Trade Nation's Influencer program and receive a monthly fee for using their TradingView charts in my analysis.
💸💸💸💸💸💸
👇 👇 👇 👇 👇 👇

CAD/JPY – Bullish Reversal from Key Support (4H)CAD/JPY – Bullish Reversal from Key Support (4H)
CAD/JPY is showing signs of a potential **bullish reversal** after respecting a strong demand zone around 101.75 – 102.00. Price has bounced multiple times from this zone, suggesting buyers are stepping in.
A downtrend line was broken recently, and price is attempting to form a **higher low**. If this bullish momentum holds, we could see a move toward the next resistance near 103.85.
📈 Trade Setup:
- Entry: Around 102.30 – 102.40
- Stop Loss: Below 101.75 (beneath strong support)
- Take Profit: Targeting 103.85 zone
- Bias: Bullish (Reversal structure)
This setup is ideal for swing traders looking to capitalize on structure-based reversals from strong support areas.

CAD JPY Sell Trade Setup H1CAD JPY has not fully dropped into the demand zone yet but its creating a bearish break and retest pattern that also align with the 0.50 - 0.618 Fib Retracement level.
Once this pattern is confirmed we will be selling into the demand zone.

CAD/JPY At Great Buying Area , 250 Pips Waiting For Us !Here is my CAD/JPY Long setup , we have a very good 4H Bullish P.A , The price at a very strong support which is we can buy from it , also we have a very good 4H Confirmation , so if the price go back to retest it we can enter a buy trade and targeting 250 pips .
This Is An Educational + Analytic Content That Will Teach Why And How To Enter A Trade
Make Sure You Watch The Price Action Closely In Each Analysis As This Is A Very Important Part Of Our Method
Disclaimer : This Analysis Can Change At Anytime Without Notice And It Is Only For The Purpose Of Assisting Traders To Make Independent Investments Decisions.

TWO Trade Ideas on CADJPYA new trend has started on this pair so I'm looking to capture the move up from the breaker block and then to ride it back down to new lows, once it reaches my BIGFOOT level.

Trendline Break The price has broken out of a bearish correction and is making a pullback, if the price makes a higher high, we will see a bullish move
WE ONLY TRADE PULLBACKS
