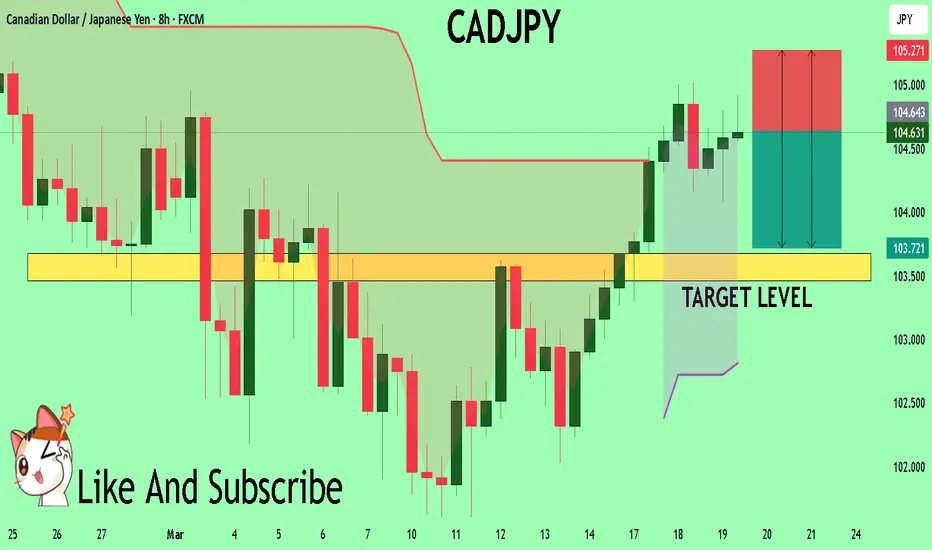
CAD-JPY Bullish Breakout! Buy!
Hello,Traders!
CAD-JPY is trading in a
Local uptrend and the pair
Made a nice bullish breakout
Of the key horizontal level
Of 104.829 which is now
A support and the breakout
Is confirmed so we are
Locally bullish biased and
We will be expecting a
Further bullish move up
Buy!
Comment and subscribe to help us grow!
Check out other forecasts below too!
Disclosure: I am part of Trade Nation's Influencer program and receive a monthly fee for using their TradingView charts in my analysis.
CADJPY trade ideas

CADJPYTrend is Bulish.
buy at fib level 0.5% with testing trendline.
Buy Limit
EP: 104.371
SL : 103.131
TP :105.571
RRR 1:1


CADJPY: Short Signal Explained
CADJPY
- Classic bearish formation
- Our team expects pullback
SUGGESTED TRADE:
Swing Trade
Short CADJPY
Entry - 105.05
Sl - 105.73
Tp - 103.81
Our Risk - 1%
Start protection of your profits from lower levels
Disclosure: I am part of Trade Nation's Influencer program and receive a monthly fee for using their TradingView charts in my analysis.
❤️ Please, support our work with like & comment! ❤️

CAD/JPY For Bullishyou can go long now
or
wait for pull-back near by entry point and then go long
general trend is up trend
have fun :)

CADJPY Analysis For A SELL Idea!!!!CADJPY - 4H Chart Sell Analysis
Market Structure
• The overall structure is bearish, with price forming lower highs and lower lows.
• Price attempted to rally but failed to break above 105.000, a major supply zone and previous support turned resistance.
• The most recent push above the highs appears to be a liquidity grab, followed by a strong rejection.
Supply & Resistance Zones
• Price reacted strongly to a key supply zone around 104.500 - 105.000.
• Multiple rejections and wicks in this zone suggest heavy selling interest.
• A fake breakout (bull trap) is visible, where buyers got trapped above resistance before a bearish move resumed.
Price Action Confirmation
• The bearish engulfing candle after the liquidity grab suggests a potential shift in momentum.
• Price broke below a minor support level and is currently retesting it, aligning with a lower high formation.
• The 50 EMA (blue line) is acting as dynamic resistance, further supporting the bearish bias.
Target Zones
• First target: 103.000 – a key intraday support and minor demand zone.
• Main target: 102.000 - 101.800 – a strong demand area and previous low where price may look to rebalance and tap liquidity.
Trade Setup
• Entry: Around 104.000 - 104.100 after a confirmed retest of broken support.
• Stop Loss: Above 104.500 - 104.700, outside the recent supply zone.
• Take Profit: Partial at 103.000, final TP at 102.000.
Confluences
1. Bearish trend continuation.
2. Liquidity grab above previous highs (105.000 area).
3. Rejection from major supply zone.
4. EMA resistance and structural confirmation of lower high.
Final Outlook
• If price stays below 104.300, sellers likely maintain control.
• A clean break below 103.500 will confirm further downside.
• A move and close above 105.000 would invalidate this sell setup.
CADJPY: Bearish Outlook as BOJ Stays HawkishHey Realistic Traders! BOJ’s Hawkish Stance, Will OANDA:CADJPY Turn More Bearish? Let’s Dive into the Analysis...
Technical analysis
On the H4 timeframe, CAD/JPY has repeatedly tested the 200 EMA but struggled to stay above it for long, indicating a strong bearish trend. Even the latest price correction failed to break above the 0.5 Fibonacci retracement level. Afterward, the price formed a bearish rising wedge pattern, followed by a breakout. The MACD indicator also signaled a bearish crossover, reinforcing the likelihood of further downside.
Looking ahead, CAD/JPY could drop toward the first target at 101.505 and, if selling pressure persists, potentially reach the second target at 100.159. These levels align with previous price movements and key historical support zones.
However, this bearish outlook remains valid only if the price stays below the key stop-loss level at 105.133.
Market Sentiments
Japan’s Bank of Japan (BOJ) is keeping its short-term interest rate steady at 0.5% while monitoring domestic wage growth and rising food prices. If inflation continues to rise, the BOJ may increase rates, potentially to 0.75% or higher, which could strengthen the yen and potentially make the CADJPY going lower.
Support the channel by engaging with the content, using the rocket button, and sharing your opinions in the comments below.
Disclaimer: "Please note that this analysis is solely for educational purposes and should not be considered a recommendation to take a long or short position on CAD/JPY"


CADJPY 1H forecastWe're in an impulse sequence down, anticipating a 4-5 formation. Wave 3 is also not yet complete we can see a short-term decline before we can see a pullback to form a wave (4)

CADJPY Under Pressure! SELL!
My dear friends,
Please, find my technical outlook for CADJPY below:
The price is coiling around a solid key level - 104.65
Bias - Bearish
Technical Indicators: Pivot Points High anticipates a potential price reversal.
Super trend shows a clear sell, giving a perfect indicators' convergence.
Goal - 103.67
Safe Stop Loss - 105.27
About Used Indicators:
The pivot point itself is simply the average of the high, low and closing prices from the previous trading day.
———————————
WISH YOU ALL LUCK
CADJPY | 19.03.2025SELL 104.300 | STOP 105.100 | TAKE 103.300 | Let's consider the local reversal model of the price movement down from the current levels towards the support levels of 103.650-103.300, which were the previous maximum.

CAD JPY BUY Trade Setup 2 hour timeframe On the 2 hour timeframe CAD JPY has broken a key structure level forming a Higher high and higher low uptrend pattern, we need to wait for a retest of the higher low level for the completion of a Bullish Break and Retest pattern, also this level align with the Fib Retracement zone 0.618-0.50
Entry will be based off candlestick confirmation on the retest level.
Patience Patience ⏰👌🏻

CADJPY APPROACHES A PULLBACK RESISTANCE LEVELPrice is at pullback resistance level and there’s high tendency we could experience a sell off around that price level. I’d be monitoring price movements so as to spot a possible sell opportunity around that area. A sell opportunity is envisaged!

CAD/JPY Triangle (BoJ Interest Rate- Today) 19.03.2025The CAD/JPY pair on the M30 timeframe presents a Potential Buying Opportunity due to a recent Formation of a Triangle Pattern. This suggests a shift in momentum towards the upside and a higher likelihood of further advances in the coming hours.
Possible Long Trade:
Entry: Consider Entering A Long Position around Trendline Of The Pattern.
Target Levels:
1st Resistance – 105.50
2nd Resistance – 106.06
🎁 Please hit the like button and
🎁 Leave a comment to support for My Post !
Your likes and comments are incredibly motivating and will encourage me to share more analysis with you.
Best Regards, KABHI_TA_TRADING
Thank you.

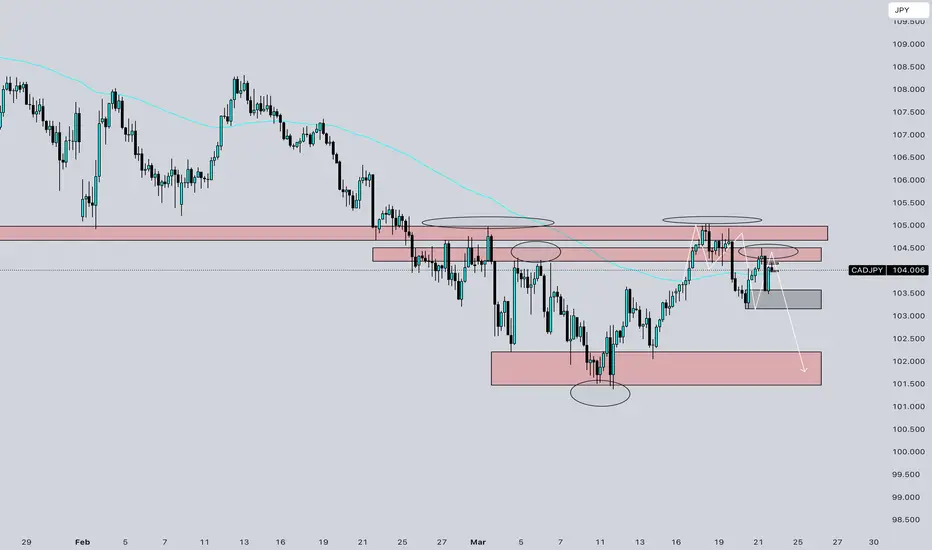
CADJPYreaching a supply zone in a downtrend, liquidity grab, v-formation and pull back going for a tp2

Bearish drop?CAD/JPY has reacted of the pivot and could drop to the 1st support which aligns with the 50% Fibonacci retracement.
Pivot: 104.92
1st Support: 103.55
1st Resistance: 105.95
Risk Warning:
Trading Forex and CFDs carries a high level of risk to your capital and you should only trade with money you can afford to lose. Trading Forex and CFDs may not be suitable for all investors, so please ensure that you fully understand the risks involved and seek independent advice if necessary.
Disclaimer:
The above opinions given constitute general market commentary, and do not constitute the opinion or advice of IC Markets or any form of personal or investment advice.
Any opinions, news, research, analyses, prices, other information, or links to third-party sites contained on this website are provided on an "as-is" basis, are intended only to be informative, is not an advice nor a recommendation, nor research, or a record of our trading prices, or an offer of, or solicitation for a transaction in any financial instrument and thus should not be treated as such. The information provided does not involve any specific investment objectives, financial situation and needs of any specific person who may receive it. Please be aware, that past performance is not a reliable indicator of future performance and/or results. Past Performance or Forward-looking scenarios based upon the reasonable beliefs of the third-party provider are not a guarantee of future performance. Actual results may differ materially from those anticipated in forward-looking or past performance statements. IC Markets makes no representation or warranty and assumes no liability as to the accuracy or completeness of the information provided, nor any loss arising from any investment based on a recommendation, forecast or any information supplied by any third-party.

CADJPY likely to go up as correctionCADJPY is even though in the down trend is now gong through the corrections , In 1 day candle it has formed a bullish engulf candle expected to reach 106.

CADJPY 1h , re-test support zone Analysis of CAD/JPY (1H Chart)
Trend Reversal & Breakout:
The price previously moved within a descending channel but has since broken out to the upside.
This breakout indicates a shift in market structure from bearish to bullish.
Key Resistance at 106.203:
The chart suggests a bullish target around the 106.203 resistance level.
If price reaches this level, we could see either a breakout continuation or a rejection.
Potential Pullback:
The blue arrow suggests a potential pullback before a continuation upwards.
The RSI is approaching overbought territory, which may lead to a short-term correction before resuming the uptrend.
RSI & Momentum:
The RSI is near 68.81, indicating strong momentum but approaching overbought conditions.
A temporary pullback may occur to relieve overbought pressure before another upward move.
Conclusion:
Bullish Bias: CAD/JPY is showing strong bullish momentum, but a temporary retracement may occur before further upside.
Key Levels:
Support: Watch for a pullback towards the previous resistance-turned-support (possibly around 103.5-104).
Resistance: 106.203 is the next major upside target.
Trade Idea: Consider entering long positions on pullbacks with confirmation, targeting the 106 area.

SHORT ON CAD/JPYCAD/JPY is currently at a major resistance level/zone and has formed a minor double top just breaking the neckline on the lower timeframes.
I will be selling cad/jpy to the next major swing low for about 200 pips.

CAD-JPY Free Signal! Sell!
Hello,Traders!
CAD-JPY keeps going up
But as you can see there is
A strong horizontal resistance
Around 105.035 so after the
Retest a short trade can be
Entered with the TP of 104.188
And SL of 105.520
Sell!
Comment and subscribe to help us grow!
Check out other forecasts below too!
Disclosure: I am part of Trade Nation's Influencer program and receive a monthly fee for using their TradingView charts in my analysis.

CADJPY-BUY strategy 6 hourly chart The pair has been near 101.50 area lows, and recovered strongly again. As stated earlier updates, low's we cannot predict, but we can see overall careful adding to the positions managing to get improved averages overall, and constantly manage it effectively. For now, the pair seems to position itself into more positive territory, i.e., stochastic, fisher form and other indicators not shown.
Strategy BUY 102.10-102.50 or lower when seen, and take profit at 104.87 on first GANN resistance attempt. Overall see 105.90 possible.

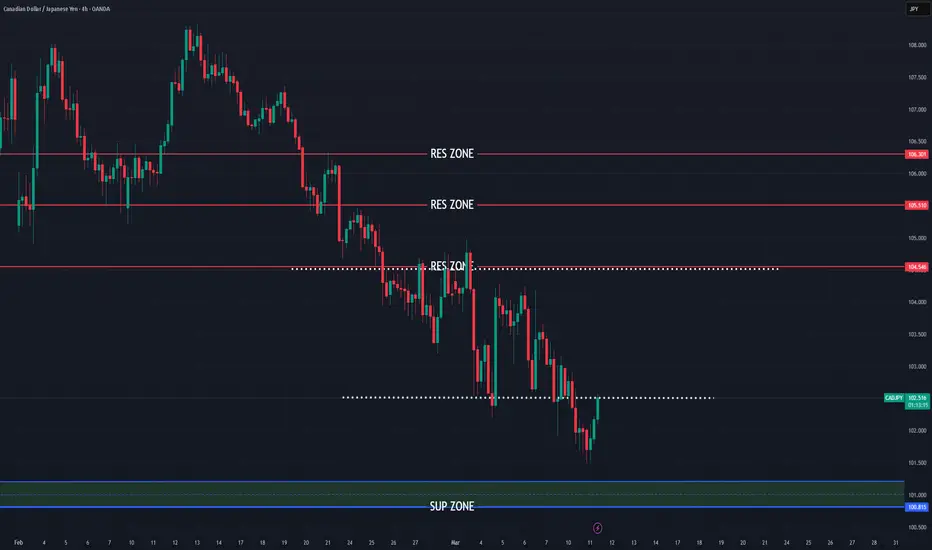
CADJPY having strong bullish signs
OANDA:CADJPY PA based trade, currently price on bottom line, JPY showing signs of losing power, with some other currencies it's already confirmed bearishness. We are have and event GDP from JPY today, which looks like its have impact here.
Here now expecting strong bullish push till top trend line (RES zone) and having look we will see and break of top trend line and higher bullishness is exepcted here
SUP zone: 101.200
RES zone: 104.550, 105.500, 106.300