CADJPYWe can attempt to buy CADJPY from specified level as it make HL , also 0.618 FIB level intact indicate that it moves upward.
SL , TP mention in chart
CADJPY trade ideas

Fundamentals 11/19/2024Hello,
Today, we reviewed our fundamental news information. Although all the information has not yet been released, we were able to gain some insight into how our larger player may impact the market. With that said, I would like to express my gratitude to all of you for taking the time to join us again. The fundamentals as of this current moment have provided us with some insight into the euro pairs, the US dollar pairs, and the Canadian dollar.
However, we have received some new information that we will have to review in the following video. It appears that this information has brought some volatility to the market, which is favorable for us. Therefore, we must be patient while this volatility runs its course in the market. As of now, a trade opportunity is developing.
thank you,

CAD/JPY BULLS WILL DOMINATE THE MARKET|LONG
Hello, Friends!
We are now examining the CAD/JPY pair and we can see that the pair is going down locally while also being in a downtrend on the 1W TF. But there is also a powerful signal from the BB lower band being nearby indicating that the pair is oversold so we can go long from the support line below and a target at 111.487 level.
✅LIKE AND COMMENT MY IDEAS✅

CADJPY: Bullish Continuation is Expected! Here is Why:
It is essential that we apply multitimeframe technical analysis and there is no better example of why that is the case than the current CADJPY chart which, if analyzed properly, clearly points in the upward direction.
❤️ Please, support our work with like & comment! ❤️

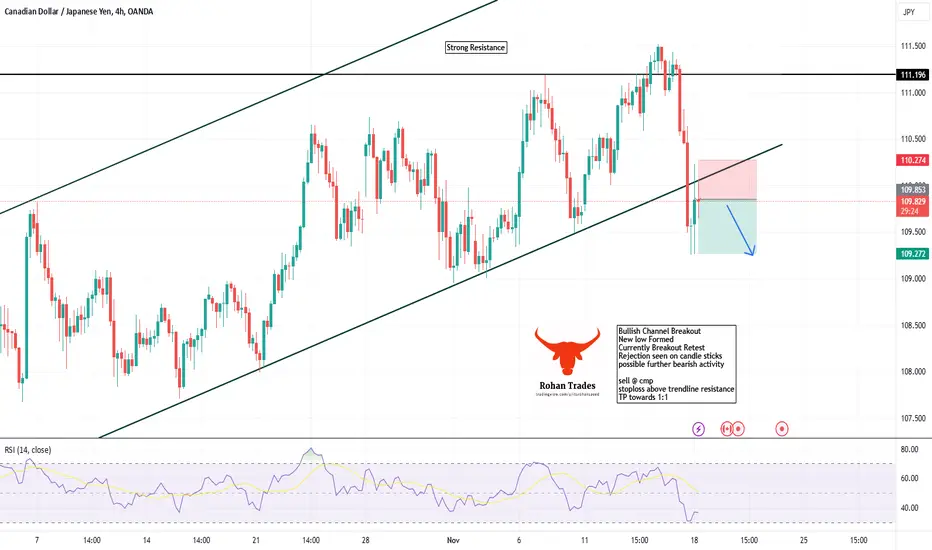
CADJPY, Breakout of Bullish ChannelBullish Channel Breakout
New low Formed
Currently Breakout Retest
Rejection seen on candle sticks
possible further bearish activity
sell @ cmp
stoploss above trendline resistance
TP towards 1:1
CADJPY SELL SETUPCJ also gave an impulse sell off from supply structure also forming an evening star on the daily. Now looking for another sell opportunity on the pull back or retest!

CAD_JPY BULLISH BIAS|LONG|
✅CAD_JPY will soon retest a key support level of 108.993
So I think that the pair will make a rebound
And go up to retest the supply level above at 109.900
LONG🚀
✅Like and subscribe to never miss a new idea!

CADJPYwith the recent market structure shift, cadjpy is expected tp continue it bearish momentum after a pullback to the last demand zone

CADJPY Will Grow! Long!
Take a look at our analysis for CADJPY.
Time Frame: 1h
Current Trend: Bullish
Sentiment: Oversold (based on 7-period RSI)
Forecast: Bullish
The market is trading around a solid horizontal structure 109.494.
The above observations make me that the market will inevitably achieve 110.050 level.
P.S
We determine oversold/overbought condition with RSI indicator.
When it drops below 30 - the market is considered to be oversold.
When it bounces above 70 - the market is considered to be overbought.
Like and subscribe and comment my ideas if you enjoy them!

CADJPY Will Go Higher From Support! Long!
Please, check our technical outlook for CADJPY.
Time Frame: 12h
Current Trend: Bullish
Sentiment: Oversold (based on 7-period RSI)
Forecast: Bullish
The market is on a crucial zone of demand 109.659.
The oversold market condition in a combination with key structure gives us a relatively strong bullish signal with goal 111.153 level.
P.S
We determine oversold/overbought condition with RSI indicator.
When it drops below 30 - the market is considered to be oversold.
When it bounces above 70 - the market is considered to be overbought.
Like and subscribe and comment my ideas if you enjoy them!

CAD-JPY Support Ahead! Buy!
Hello,Traders!
CAD-JPY keeps falling down
But the pair will soon hit
A horizontal support
Of 109.000 from where
We will be expecting a
Local bullish rebound
Buy!
Like, comment and subscribe to help us grow!
Check out other forecasts below too!

CADJPY Long All timeframes are oversold
There is a bat pattern on M15 and M30
This is with the H4 trend
30 pip stop loss
get out at M15 Overbought

CADJPY Massive Long! BUY!
My dear friends,
Please, find my technical outlook for CADJPY below:
The instrument tests an important psychological level 110.57
Bias - Bullish
Technical Indicators: Supper Trend gives a precise Bullish signal, while Pivot Point HL predicts price changes and potential reversals in the market.
Target - 110.88
About Used Indicators:
Super-trend indicator is more useful in trending markets where there are clear uptrends and downtrends in price.
———————————
WISH YOU ALL LUCK

15.11.24 Morning ForecastPairs on Watch -
FX:CADJPY
FX:GBPNZD
FX:GBPAUD
A short overview of the instruments I am looking at for today, multi-timeframe analysis down to what I will be looking at for an entry. Enjoy!

CADJPY / SHORT / M15CADJPY may fall from the Bearish Order Block .
Bearish Order Block :- 111.522 and 111.439
CADJPY is approaching a bearish order block between 111.522 and 111.439, where we may anticipate a potential reversal and bearish momentum. Using Smart Money Concepts (SMC), this zone aligns with an institutional supply area, suggesting it could act as strong resistance.
Additional Analysis: I've incorporated other indicators to confirm bearish bias and identify potential rejection signals within this range. Monitoring price action here may provide further confirmation for a move downward if sellers defend the order block.
CADJPY / SHORT / M15
LOT :- 0.1
Entry Price :- 111.440
Take Profit :- 111.252
Stop Loss :- 111.628

Could the price reverse from here?CAD/JPY is rising towards the pivot and could reverse 1st support.
Pivot: 111.75
1st Support: 110.60
1st Resistance: 112.21
Risk Warning:
Trading Forex and CFDs carries a high level of risk to your capital and you should only trade with money you can afford to lose. Trading Forex and CFDs may not be suitable for all investors, so please ensure that you fully understand the risks involved and seek independent advice if necessary.
Disclaimer:
The above opinions given constitute general market commentary, and do not constitute the opinion or advice of IC Markets or any form of personal or investment advice.
Any opinions, news, research, analyses, prices, other information, or links to third-party sites contained on this website are provided on an "as-is" basis, are intended only to be informative, is not an advice nor a recommendation, nor research, or a record of our trading prices, or an offer of, or solicitation for a transaction in any financial instrument and thus should not be treated as such. The information provided does not involve any specific investment objectives, financial situation and needs of any specific person who may receive it. Please be aware, that past performance is not a reliable indicator of future performance and/or results. Past Performance or Forward-looking scenarios based upon the reasonable beliefs of the third-party provider are not a guarantee of future performance. Actual results may differ materially from those anticipated in forward-looking or past performance statements. IC Markets makes no representation or warranty and assumes no liability as to the accuracy or completeness of the information provided, nor any loss arising from any investment based on a recommendation, forecast or any information supplied by any third-party.

CADJPY, Bullish Channel New High FormationBullish Channel
Rejection From Strong Resistance
Breakout of Resistance
Towards New high Formation
Entry @ CMP
SL below Resistance Zone
Tarhet towards next resistance

CADJPY - BUYIgnore this if you need trades to be done within hours or days. Stay if you can sit on your hands and wait patiently.
Long-term buy target at 111.359. You'll gain interest as well (swap).
I have several positions aiming for this price.
Correction is due at this level!

CAD JPY Trade Setup Daily timeframe CAD JPY has tapped into a daily resistance level that was previously a support level.
we will be looking for selling opportunities to get our sell entry lets scale down to the lower timeframe to find pattern and confirmations.

CADJPY Bearish Trend Rising Wedge and DivergenceCADJPY Bearish Trend Rising Wedge and Divergence
Trade Setup with 3 TPS

CADJPY RISKY LONG SCALPExecute the price at the exact price mentioned, NO FOMO.
💡KEEP IN MIND💡
I am not a financial advisor and do not contribute to any of your losses or profits. To be safe, I recommend that you risk only 0.1 - 0.2% for the first week or 10 days, as no one can predict the market.
🚀Follow, I will drop daily 2-5 Intraday Charts🚀

#CAD #JPY Short Set UpLooks like a rising wedge with bearish divergence on 1H TF. Looking to Short at the break of 110.998
Entry 110.998
Stoploss 111.205
TP-1 110.793
TP-2 110.588

CADJPY Bullish AB=CD Setup at 0.776CADJPY is showing strong bullish potential as it approaches the key 0.776 level, where an AB=CD pattern is forming. On 30 minutes we can also see a bullish divergence that can be one more confluence.
