"Loonie-Yen Heist: CAD/JPY Bullish Blueprint in Motion"🕶️💼 “Operation Loonie-Yen: The CAD/JPY Clean Sweep Blueprint” 💼🕶️
(Scalp & Swing Strategy by the Thief Trader Guild)
🌟Hi! Hola! Ola! Bonjour! Hallo! Marhaba!🌟
Dear Money Movers & Strategic Operators, 🤑💰✈️
This blueprint is part of our 🔥Thief Trading Style🔥 operation—a fusion of technical precision and fundamental edge designed to tactically exploit the CAD/JPY (Loonie-Yen) setup.
🎯 Mission Objective:
Infiltrate the Bullish Zone & secure profits before the authorities (sellers) regroup.
📌 Entry Point:
"The vault's wide open!"
🔓Buy into momentum at any key level OR set a buy limit on recent swing lows using the 15m–30m charts. Wait for a pullback? Perfect—join the crew on the next dip.
🛑 Stop-Loss (SL):
Place it just below the 4H swing low (105.900) candle body wick.
But remember, your SL should match your risk style, position size, and trade frequency. Risk management is part of every successful heist.
🎯 Target Zone:
Aim for 108.500 – but exit smart if market behavior changes. Lock profits and vanish before the trap closes!
⚔️ Scalpers' Game Plan:
Only long-side jobs here. Got deep pockets? Dive right in. If not, team up with swing robbers and ride the trend. Use trailing SLs to secure every coin.
🧠 Fundamentals & Sentiment:
CAD/JPY strength is supported by intermarket flow, macro shifts, and trader sentiment. Check reports and correlations to stay a step ahead.
📰 Trading Alerts:
Be cautious around news releases—volatile spikes could trigger alarms. Avoid new entries during major drops and always protect active trades with trailing SLs.
💖 Support the Heist:
Hit that Boost button to power up the crew. Every push fuels another successful strategy. Thief Trading Style isn’t just a tactic—it’s a movement. 🏆💪
Stay alert. More heist blueprints coming soon.
Till then, trade smart. Loot legally. Vanish profitably. 🐱👤📈💸
CADJPY trade ideas

Forex Bank Job: CAD/JPY Profit Extraction Strategy🏦 "Operation Loonie Lift-Off" – CAD/JPY Forex Heist Blueprint! 💰💣
🌟Hi! Hola! Ola! Bonjour! Hallo! Marhaba!🌟
To all fellow Market Bandits & Profit Seekers, 🕶️💸💼
We’ve scoped out our next target – the CAD/JPY vault – and the blueprint is ready. This isn’t just a trade... it's a full-blown Forex infiltration mission based on undercover technical and fundamental recon 🔎📊.
🎯 The Mission Plan:
📍Entry Point – The Vault's Backdoor
💥 Strike at Pullback Zones 1 & 2
→ Use 15–30 min timeframe to ambush at recent lows or swings.
The best loot lies in waiting – buy limits only!
🛡️Stop Loss – Escape Routes
Set SL like a pro thief:
Pullback 1 ➤ 104.800
Pullback 2 ➤ 105.600
Base it on your crew’s bankroll and lot size. Always prep a clean getaway.
🏁Target – Secure the Goods
Primary loot zone: 106.000
(Or vanish before heat arrives 🚓💨)
⚔️ Scalpers’ Special Ops:
Only operate long side. Big wallets = quick hits. Small stacks? Join the swing squad and trail your SL like a shadow 🕶️🔐.
🔥Why This Hit?
CAD/JPY is in bullish mood driven by:
COT shifts 📈
Sentiment setups 🧠
Macro flow + cross-asset whispers 🔄
🚨 But remember: market conditions flip like fake IDs. Stay alert.
🧠 Final Tips from HQ:
🔕 Avoid new ops during major news drops
💣 Use trailing SLs to lock profits before the sirens go off
💖 Smash that 💥BOOST💥 to fund the next big mission
💼 From the Black Market Desks of the Thief Trading Syndicate™
This ain't your grandpa's trade plan — it's a strategic smash-and-grab with style and smarts. 📡🔐
💬 Drop a comment, hit the like, and recruit more to the crew.
📍See you in the next chart heist. Keep it stealthy, sharp, and profitable. 🤑🚀👊

A breakout spotted in CADJPY daily timeframe!!We now have a clear trending market in CADJPY from the daily chart. It’s a good time to position for a buy opportunity. I’d be monitoring price for a shift in momentum so as to buy

CAD_JPY BULLISH BREAKOUT|LONG|
✅CAD_JPY broke the key
Structure level of 107.400
While trading in a strong uptrend
Which makes me bullish biased
And I think that after the retest of
The broken level is complete
A rebound and bullish continuation will follow
LONG🚀
✅Like and subscribe to never miss a new idea!✅
Disclosure: I am part of Trade Nation's Influencer program and receive a monthly fee for using their TradingView charts in my analysis.

CADJPY; Heikin Ashi Trade IdeaIn this video, I’ll be sharing my analysis of CADJPY, using FXAN's proprietary algo indicators with my unique Heikin Ashi strategy. I’ll walk you through the reasoning behind my trade setup and highlight key areas where I’m anticipating potential opportunities.
I’m always happy to receive any feedback.
Like, share and comment! ❤️
Thank you for watching my videos! 🙏

Buy Cadjpy if new high is made above current current You can wait for retracement or put buy stop above current handle. Readjust stop loss when you see 30pips profits

CADJPY is in the Up Trend Hello Traders
In This Chart CADJPY HOURLY Forex Forecast By FOREX PLANET
today CADJPY analysis 👆
🟢This Chart includes_ (CADJPY market update)
🟢What is The Next Opportunity on CADJPY Market
🟢how to Enter to the Valid Entry With Assurance Profit
This CHART is For Trader's that Want to Improve Their Technical Analysis Skills and Their Trading By Understanding How To Analyze The Market Using Multiple Timeframes and Understanding The Bigger Picture on the Charts

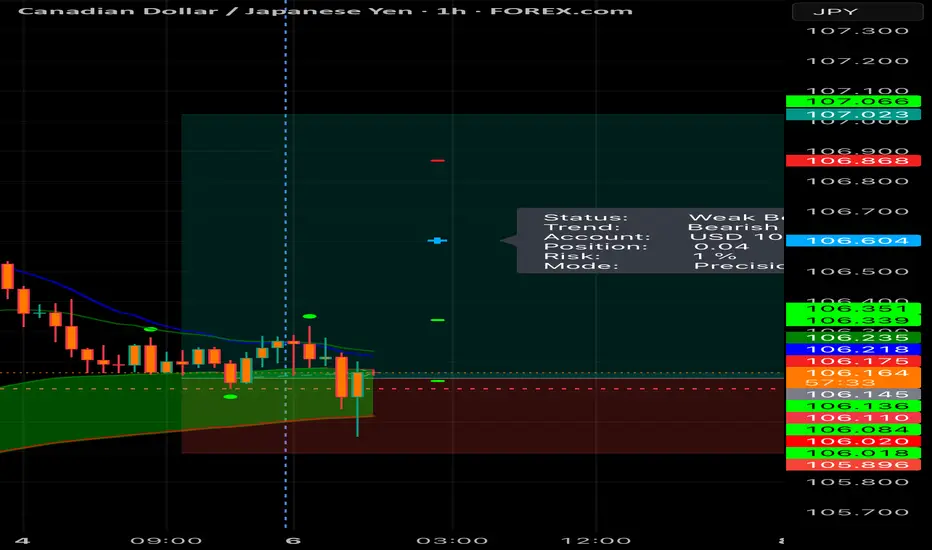
CADJPY Under Pressure! SELL!
My dear subscribers,
CADJPY looks like it will make a good move, and here are the details:
The market is trading on 107.07 pivot level.
Bias - Bearish
My Stop Loss - 107.40
Technical Indicators: Both Super Trend & Pivot HL indicate a highly probable Bearish continuation.
Target - 106.39
About Used Indicators:
The average true range (ATR) plays an important role in 'Supertrend' as the indicator uses ATR to calculate its value. The ATR indicator signals the degree of price volatility.
Disclosure: I am part of Trade Nation's Influencer program and receive a monthly fee for using their TradingView charts in my analysis.
———————————
WISH YOU ALL LUCK

CADJPY BUYWe have transitioned from a downtrend to and up trend as shown by the transition for lower low and lower high to a higher high and potential higher low. we have pulled back to a key level for an entry.

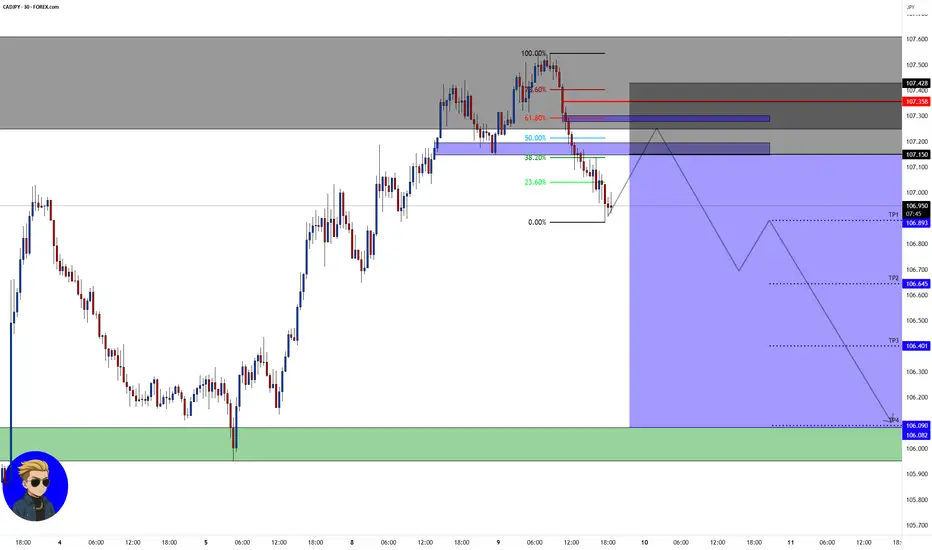
CAD/JPY💰Symbol: { CAD/JPY }
🟩Price: { 107.150 }
🟥Stop: { 107.428 }
1️⃣profit: { 106.893 }
2️⃣profit: { 106.645 }
3️⃣profit: { 106.401 }
4️⃣profit: { 106.090 }
📊Check your chart before entering.
🚨Check before use to make sure there is no important news.🚨

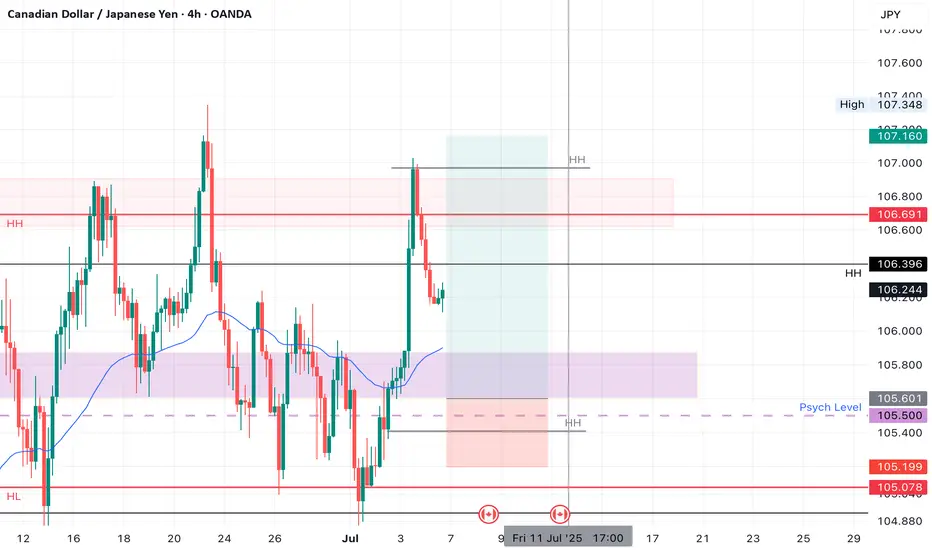
CADJPY Wave Analysis – 9 July 2025- CADJPY reversed from resistance area
- Likely to fall to support level 106.00
CADJPY currency pair recently reversed from the resistance area located between the resistance level 107.40 (former monthly high from June), upper daily Bollinger Band and the 61.8% Fibonacci correction of the downward impulse from November.
The downward reversal from this resistance area stopped the previous intermediate corrective wave (B).
Given the strength of the resistance level 107.40 and moderately bullish yen sentiment seen today, CADJPY currency pair can be expected to fall to the next support level 106.00.

CADJPY Bullish SetupHi
CADJPY has the potential to rise above 107.450, targeting two price areas of 108.056 and 108.934 for a bias of 109.688
If the price breaks active demand (dx) and falls below 105.952, then that will signal a trend reversal.
Happy Trading,
Not trading advice
Khiwe


CAD/JPY SHORT FROM RESISTANCE
Hello, Friends!
CAD/JPY is making a bullish rebound on the 3H TF and is nearing the resistance line above while we are generally bearish biased on the pair due to our previous 1W candle analysis, thus making a trend-following short a good option for us with the target being the 106.671 level.
Disclosure: I am part of Trade Nation's Influencer program and receive a monthly fee for using their TradingView charts in my analysis.
✅LIKE AND COMMENT MY IDEAS✅

CADJPY LONG TRADE PLANThe pair broke above the key zone area on H4. Next level to test is near the 107.770 and 108.350 area.
Please do your own analysis before placing any trades.
Cheers and Happy Trading !!!!

CADJPY LONGMarket structure bullish on HTFs 3
Entry at both Daily and Weekly AOI
Weekly rejection at AOi
Daily Rejection at AOi
Previous Structure point Daily
Daily EMA retest
Around Psychological Level 105.500
H4 Candlestick rejection
Rejection from Previous structure
Levels 3.88
Entry 110%
REMEMBER : Trading is a Game Of Probability
: Manage Your Risk
: Be Patient
: Every Moment Is Unique
: Rinse, Wash, Repeat!
: Christ is King.
CADJPY: Short Trading Opportunity
CADJPY
- Classic bearish formation
- Our team expects fall
SUGGESTED TRADE:
Swing Trade
Sell CADJPY
Entry Level - 106.89
Sl - 107.40
Tp - 105.90
Our Risk - 1%
Start protection of your profits from lower levels
Disclosure: I am part of Trade Nation's Influencer program and receive a monthly fee for using their TradingView charts in my analysis.
❤️ Please, support our work with like & comment! ❤️

CAD/JPY Buy Setup📈 CAD/JPY Buy Setup
🕒 1H Timeframe
📍Entry: 105.30 (inside demand zone)
🎯 Target: 106.20+
I'm long CADJPY from the demand zone. Price is holding structure and showing signs of bullish intent after a clean sweep of lows. Expecting a move back toward 106.20+ as we reclaim imbalance and fill inefficiency above.
🚀 Price is inside a key reaction zone — watching for continuation if momentum holds.
#CADJPY #ForexTrade #SmartMoney #DemandZone #LiquiditySweep #SwingTrade #PriceAction

The Market Rewards the PatientLast week was probably one of the slowest weeks I’ve ever had. I found two setups, but neither one truly materialized. They just didn’t meet all the conditions in my plan. It was tough. I won’t pretend it wasn’t tempting to drop my rules and chase other strategies just so I could be in the market.
But deep down, I knew exactly what I wanted. I want to be consistent . I want to trade like a professional . So I held back. All week, I watched and waited. No trades taken. It was boring, honestly . But that boredom protected my capital.
Instead of forcing trades, I spent the entire weekend backtesting , drilling into my strategy even more. I wanted to be sure that when my moment came, I’d recognize it without hesitation.
Then this week started. I didn’t know if it would be any different, but I trusted my process and stayed ready. Eventually, one clean setup appeared. I shared it here on TradingView. I managed my risk properly , took half my usual size at just 0.5%, and let the trade run. It almost hit my stop, but I didn’t touch it. It was simple: either TP or SL .
And this time, it hit TP. A clean 1:4.
This was a powerful lesson. Following my plan didn’t just lead to a winning trade. It protected my capital all of last week when the market wasn’t offering quality setups. That patience and discipline paid off.
That’s how you build consistency. That’s how you survive long enough to catch the trades that truly matter.

CADJPY: Is the Trap Set?Price swept the liquidity below the previous day’s low and then broke structure to the upside. That’s often a strong sign that smart money just stepped in. I’m now watching for price to pull back and fill the imbalance it left after the break. If it respects that zone, there’s a good chance we’ll see it push higher toward the previous day’s high where more liquidity is waiting.
I’ve also added the 50 EMA on this chart as an extra layer of confluence. It helps me stay aligned with the overall market direction and avoid taking trades that fight the current trend.
It’s easy to get impatient here and jump in too soon, but discipline means waiting for the story to fully unfold. Trust your levels, trust the process, and remember that protecting your mental capital is just as important as protecting your trading account.

CADJPY AnalysisCADJPY is showing signs of bullish momentum after bouncing from the 106.21 support level. The structure remains within an ascending channel. If price sustains above this zone, it may retest the resistance levels at 106.620 and 107.024. A break below 105.953 could invalidate this bullish outlook.
