CADJPY Trade IdeaCADJPY Currently has shifted the structure from the retracement of last week to bullish.
We are expecting to break the 50EMA weekly timeframe, which act as resistance level last week and continue his bullish momentum till 108.000 level.
Looking for a buy opportunity
Good Luck!
CADJPY trade ideas

CAD/JPY 4H Bullish Setup – EMA Gap Up + ADX & Stoch RSI CAD/JPY 4H Bullish Setup – EMA Gap Up + ADX & Stoch RSI Confirmation
--
The CAD/JPY forex pair is showing strong bullish momentum on the 4-hour chart. Here’s a breakdown of the technical factors supporting this view:
1. The price is above the 50 EMA, showing short-term bullish strength.
2. The price is also above the 200 EMA, confirming long-term upward momentum.
3. The pair has gapped up recently, signaling strong bullish interest and possible continuation.
4. The ADX indicator is confirming the trend strength, supporting the upward move.
5. The Stochastic RSI has bounced from oversold levels and given a reversal buy signal in line with the trend.
These combined signals suggest a potential bullish continuation in the CAD/JPY pair.
Disclaimer: This content is for educational purposes only and not financial advice. Always do your own analysis before trading.
To learn more, search for Rocket Boost content.

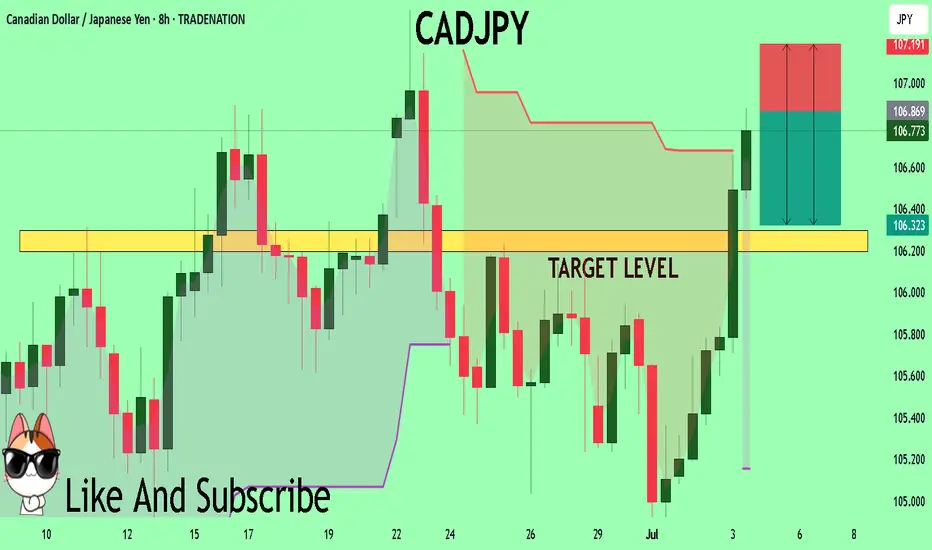
CADJPY Trading Opportunity! SELL!
My dear friends,
CADJPY looks like it will make a good move, and here are the details:
The market is trading on 106.86 pivot level.
Bias - Bearish
Technical Indicators: Supper Trend generates a clear short signal while Pivot Point HL is currently determining the overall Bearish trend of the market.
Goal - 106.29
Recommended Stop Loss - 107.19
About Used Indicators:
Pivot points are a great way to identify areas of support and resistance, but they work best when combined with other kinds of technical analysis
Disclosure: I am part of Trade Nation's Influencer program and receive a monthly fee for using their TradingView charts in my analysis.
———————————
WISH YOU ALL LUCK

CADJPY MOVING IN BEARISH TREND STRUCTURECADJPY MOVING IN BEARISH TREND STRUCTURE.
Market shows weakening of buying pressure.
Market is expected remain bearish in upcoming trading sessions.
On lower side market may hit the target of 104.900.
On higher side 106.150 can act as a key resistance level.

CAD/JPY Bearish Trend Analysis – Key Levels to Watch CAD/JPY Bearish Trend Analysis – Key Levels to Watch
The CAD/JPY pair is currently moving in a bearish trend structure, indicating a weakening of buying pressure in the market. This suggests that sellers are gaining control, and the pair is likely to remain under downward pressure in the upcoming trading sessions. Traders should prepare for potential further declines unless a significant reversal pattern emerges.
Bearish Momentum Signals Downside Risk
Recent price action shows that the pair has been struggling to sustain upward movements, with lower highs and lower lows reinforcing the bearish bias. The weakening buying pressure is evident from the lack of strong bullish candles and diminishing volume on upward retracements. This signals that any short-term recoveries may be limited, and the downtrend could resume.
Key Support and Resistance Levels
- Downside Target: The next major support level to watch is 104.900. If selling momentum accelerates, this level could be tested in the coming sessions. A break below this support may open the door for further declines toward lower psychological levels.
- Upside Resistance: On the higher side, 106.150 stands as a critical resistance level. Any bullish retracement toward this zone could attract fresh selling pressure, keeping the bearish structure intact unless convincingly broken.
Trading Strategy Considerations
- Short Opportunities: Traders may consider short positions on pullbacks toward resistance, particularly near 106.150, with a downside target of 104.900.
- Risk Management: A break above 106.150 could invalidate the bearish outlook, signaling a possible trend reversal or consolidation. In such a scenario, stops should be adjusted accordingly.
Conclusion
The CAD/JPY pair remains bearish, with 104.900 as the next key downside target. Resistance at 106.150 is crucial for maintaining the downtrend. Traders should monitor price action around these levels for confirmation of continued bearish momentum or a potential reversal. Stay cautious and trade with disciplined risk management.

cad jpysell from pivot 4H
after wedge and triangle
with good RR seems like good opportunity
but it's Monday morning and first day of new Month

CADJPY-bias long Bullish indications:
Previous day's closing respcted .
Hammer cnadle formation in daily.
shorter time frame HHHL
Fib level 0.5 respected from today's low.
Double bottom and morning starn candle from support in 5 min.
Bearish indicatoins:
Bearish divergence in 5 min.
Trade plan bias long @105.354
SL:105.21
TP1:105.525
TP2:105.680

CAD/JPYSince my ascending triangle formation has violated its characteristics it is no longer valid. I took this opportunity to revisit this pair and start again. I still believe price is operating from the Double Bottom Formation so I'm still looking for price to go up. Here we have 4 touches on our Trendline & A Expanding Flat Formation (highlighted in blue letters). I have entered a position after the 4hr close but im still looking for a retrace for a better position.

CADJPY CONTINUING THE BEARISH TREND MARKET STRUCTURECAD/JPY Maintains Bearish Trend Structure – Key Levels to Watch
The CAD/JPY pair continues to exhibit a clear bearish market structure, characterized by consistent lower lows and lower highs on the price chart. This pattern confirms sustained selling pressure, suggesting the downtrend remains intact for upcoming trading sessions. Traders should watch for potential downside extensions while monitoring key resistance levels for possible trend reversals.
Bearish Confirmation: Lower Lows and Lower Highs
The formation of successive lower lows and lower highs demonstrates firm control by bearish traders. This classic downtrend pattern indicates weakening demand for the Canadian dollar against the Japanese yen. Until this structure breaks, the path of least resistance remains downward.
Downside Target: 104.900 in Focus
If selling momentum persists, CAD/JPY could test the next support level at 104.900. A decisive break below this level may accelerate declines, potentially opening the door for further bearish movement. Traders should watch for price reactions near this zone for potential continuation or consolidation signals.
Resistance Zone: 106.250 as Key Barrier
On the upside,106.250 stands as a critical resistance level. Any corrective rallies toward this zone could attract fresh selling pressure, reinforcing the bearish outlook. Only a sustained breakout above this resistance would signal a potential trend reversal, shifting momentum in favor of buyers.
Market Outlook: Bearish Dominance Expected
Given the prevailing price action, CAD/JPY is likely to remain under bearish control. Factors such as commodity price fluctuations (particularly oil, which impacts the CAD) and risk sentiment (influencing the JPY) may further drive the pair’s movement.
Conclusion
CAD/JPY’s bearish trend remains strong, with 104.900 as the next downside target and 106.250 acting as a key resistance. Traders may consider shorting rallies near resistance with proper risk management, while a break above 106.250 would require reassessment of the bearish bias.

CADJPY SELL IDEAWe're currently in a downtrend with price forming a series of lower highs and lower lows. Currently, the price is retesting a broken minor support level on the H4 chart, and I'll be on the lookout for entries at the next H1 close. Final confirmation for a fall would be a H4 close below the support level.

CADJPY Short IdeaThis is a **CAD/JPY** (Canadian Dollar / Japanese Yen) short setup on the **2-hour chart**, structured around a **Head and Shoulders pattern** and a **break of structure**, supported by multi-timeframe bearish bias.
### **Trade Description:**
* **Direction**: SELL
* **Entry Plan**: After the recent **break of structure** to the downside, the trader is waiting for a **retest** of the broken support zone (now resistance) and a **bearish engulfing candle** on any timeframe (1H, 2H, or 4H) to enter short.
* **Stop Loss**: Just above the retest zone (\~105.95 - 106.00)
* **Take Profit**: Targeting \~103.95 area
* **Risk/Reward**: Approximately 3.5:1 RRR
---
### **Reasoning Behind the Trade:**
#### ✅ **Technical Setup:**
1. **Head and Shoulders Pattern**:
* A classic **reversal pattern** visible, with the right shoulder confirming lower highs.
* The neckline has been broken — signaling trend reversal from bullish to bearish.
2. **Structure Break**:
* Price has **broken below previous higher lows**, confirming a shift in structure.
* A retest of the broken level is anticipated before the next move down.
3. **Confluence Zones**:
* The **Daily Area of Interest (AOI)** lies around 105.00–105.20.
* EMA cluster (blue and red lines) above current price adds resistance pressure.
4. **Engulfing Candle Confirmation**:
* The entry is not immediate — we wait for **bearish confirmation** via engulfing candle (on 1H/2H/4H depending on clarity).
---
### **Multi-Timeframe Bias:**
* **Weekly (W): Bullish**
* **Daily (D): Bearish**
* **12H / 6H / 4H: Bearish**
* → Overall bias: **80% Bearish**, supporting a short position.
---
### **Summary:**
The trader is looking to short CAD/JPY after a **clear break of structure and neckline**, within a **bearish market context on most higher timeframes**, waiting for a cleaner **bearish engulfing signal on the retest** before executing. The trade targets a zone below 104.00 for a strong reward-to-risk potential.

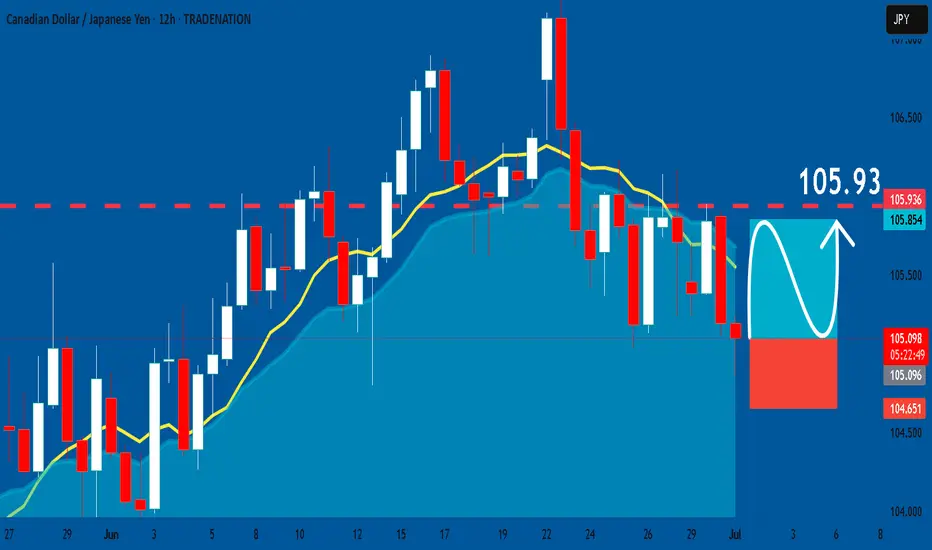
CADJPY: Bullish Continuation & Long Signal
CADJPY
- Classic bullish formation
- Our team expects pullback
SUGGESTED TRADE:
Swing Trade
Long CADJPY
Entry - 105.09
Sl - 104.65
Tp - 105.93
Our Risk - 1%
Start protection of your profits from lower levels
Disclosure: I am part of Trade Nation's Influencer program and receive a monthly fee for using their TradingView charts in my analysis.
❤️ Please, support our work with like & comment! ❤️
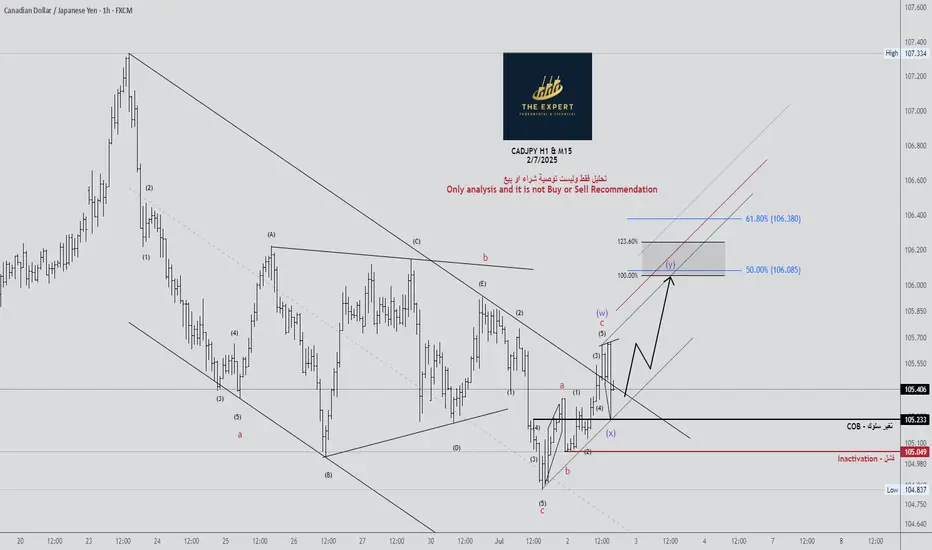
Bullish ABC
Hello awesome traders! I hope you're having a great trading week so far. This week is a bit shorter due to the U.S. Independence Day — with partial closures Thursday and a full close on Friday. But as always, we keep doing what we do best: identifying high-probability patterns, managing our risk, and pulling pips out of the market.
Let’s break down this solid technical opportunity shaping up on CADJPY (4H) – presenting a bullish ABC structure into PCZ with clean symmetry and mapped targets.
Pattern Overview:
Pattern Type: ABC Bullish
Asset: CADJPY
Timeframe: 4H
Trade Type: Long – Bullish impulse expected from confirmed completion at PCZ
Key Levels:
A Point: 103.819 – Major swing low off the 200 EMA
B Point: 107.334 – Recent swing high, strong resistance reversal
C Point: 104.837 – Completion zone aligning with fib extension confluence
Entry Level (EL): 105.100–105.200 – Price now entering PCZ with reversal structure
Stop Level (ST): Below 104.780 – Invalidation if structure fails
Target 1 Zone: 107.000–107.600 – Key retracement and 78.6% cluster
PCZ (Potential Completion Zone): 127.2–161.8% BC extension @ 105.402–104.876
Fibonacci Extensions & Key Ratios:
BC 127.2%: 105.402 – First PRZ alert
BC 161.8%: 104.876 – Extended completion zone
AB=CD (Symmetry): Confirmed with nearly equal projection
38.2%–78.6% Retracement: 106.180–107.600 – Major resistance for profit-taking
Price Action & Setup:
Strong downside correction from B (107.334) to C (104.837) completed with confluence at PCZ.
Price is reacting near the 200 EMA and forming a minor reversal wick.
ABCD symmetry leg confirms with C leg near equal length projection from A–B.
If bullish momentum confirms, a move back toward the retracement zones is expected.
Market Sentiment:
Market testing the PCZ zone with wicks forming — early buyers showing presence.
200 EMA support coincides with D-leg completion, a common bounce area in structure trades.
No major USD flows this week due to holiday impact — JPY and CAD flows dominate.
Next Potential Movement:
Reversal confirmation from PCZ could send price up into:
Target 1: 107.000 (61.8% retracement of BC)
Target 2: 107.600 (78.6% extension and previous structure resistance)
Invalidation below 104.780 (break of C low)
Risk Management:
Entry: 105.100–105.200 on confirmation signal (bullish engulfing / hammer / breakout)
Stop Loss: Below 104.780 (below structure + fib invalidation)
Targets: 107.000 and 107.600
Risk Profile: Tight invalidation, high reward-to-risk structure
Conclusion:
CADJPY is offering a clean ABC Bullish structure, completing right at the fib confluence and 200 EMA zone.
With a solid base at the PCZ and mapped target levels ahead, this setup aligns well with structured traders looking to enter on confirmation.
Stay patient, stay disciplined, and trust your patterns.

CADJPY Is Very Bearish! Short!
Take a look at our analysis for CADJPY.
Time Frame: 4h
Current Trend: Bearish
Sentiment: Overbought (based on 7-period RSI)
Forecast: Bearish
The market is testing a major horizontal structure 105.190.
Taking into consideration the structure & trend analysis, I believe that the market will reach 104.340 level soon.
P.S
Overbought describes a period of time where there has been a significant and consistent upward move in price over a period of time without much pullback.
Disclosure: I am part of Trade Nation's Influencer program and receive a monthly fee for using their TradingView charts in my analysis.
Like and subscribe and comment my ideas if you enjoy them!

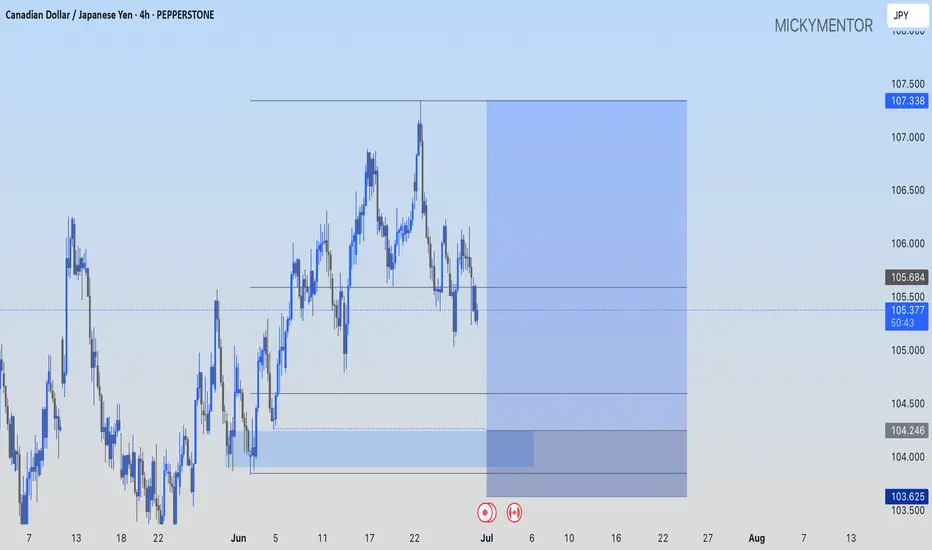
Potential bearish drop?CAD/JPY has reacted off the pivot which is a pullback resistance and could drop to the 1st support which is also a pullback support..
Pivot: 105.84
1st Support: 104.33
1st resistance: 106.80
Risk Warning:
Trading Forex and CFDs carries a high level of risk to your capital and you should only trade with money you can afford to lose. Trading Forex and CFDs may not be suitable for all investors, so please ensure that you fully understand the risks involved and seek independent advice if necessary.
Disclaimer:
The above opinions given constitute general market commentary, and do not constitute the opinion or advice of IC Markets or any form of personal or investment advice.
Any opinions, news, research, analyses, prices, other information, or links to third-party sites contained on this website are provided on an "as-is" basis, are intended only to be informative, is not an advice nor a recommendation, nor research, or a record of our trading prices, or an offer of, or solicitation for a transaction in any financial instrument and thus should not be treated as such. The information provided does not involve any specific investment objectives, financial situation and needs of any specific person who may receive it. Please be aware, that past performance is not a reliable indicator of future performance and/or results. Past Performance or Forward-looking scenarios based upon the reasonable beliefs of the third-party provider are not a guarantee of future performance. Actual results may differ materially from those anticipated in forward-looking or past performance statements. IC Markets makes no representation or warranty and assumes no liability as to the accuracy or completeness of the information provided, nor any loss arising from any investment based on a recommendation, forecast or any information supplied by any third-party.

Lingrid | CADJPY Potential Downside Move After BreakoutThe price perfectly fulfilled my previous idea . FX:CADJPY is facing continuous rejection from the descending trendline, maintaining its position within the downward channel. Price is struggling to hold above the 105.00 region, showing signs of distribution after a fake breakout and lower high formation. A sustained breakdown below 105.00 would confirm the bearish continuation targeting the 104.00–104.50 zone.
📉 Key Levels
Sell zone: 105.40–105.50
Buy trigger: breakout above 105.60 and retest
Target: 104.500
Sell trigger: confirmed break and close below 105.00
⚠️ Risks
False breakdown could lead to sharp recovery toward 106.20
Oversold conditions may slow downside near 104.50
Range re-accumulation above 105.00 could trap short-sellers
Thin liquidity around 104.20 might cause price spikes
If this idea resonates with you or you have your own opinion, traders, hit the comments. I’m excited to read your thoughts!

CAD-JPY Bullish Bias! Buy!
Hello,Traders!
CAD-JPY keeps trading
In an uptrend along the
Rising support line and
We are already seeing a
Bullish rebound so we are
Bullish biased and we will
Be expecting a further
Bullish move up
Buy!
Comment and subscribe to help us grow!
Check out other forecasts below too!
Disclosure: I am part of Trade Nation's Influencer program and receive a monthly fee for using their TradingView charts in my analysis.

CADJPY BEARISH SETUP💱 CAD/JPY Reversal Watch: Bearish Pressure Builds Below Resistance
4-Hour Candlestick Chart – Analysis as of June 30, 2025
The CAD/JPY pair is showing signs of weakening momentum after repeated failures to break above the key 106.000 resistance level. This suggests growing downside pressure and increased chances of a corrective move in the near term.
🔍 Key Technical Levels
🟥 Current Price: 105.481
🚫 Resistance Zone: Around 106.000 — multiple rejections signal seller dominance
🛡️ Key Support Level: 104.000 — acting as the downside magnet
📉 Downward Arrow: Suggests bearish directional sentiment remains intact
🧠 Technical Interpretation
📌 Price action is forming a lower high, a classic sign of a potential short-term reversal.
📌 Repeated failures near the 106.000 mark highlight resistance strength and declining bullish interest.
📌 A drop below 105.000 could intensify downside momentum, with the 104.000 support as the next major level.
📌 For bulls to regain control, the pair must reclaim 106.000 with solid buying volume.

CADJPY 15M BUYING OPPORTUNITYBought @ 105.52 We have SUPPLY ZONE need to be tested
Good risk reward :)
Happy Trading everyone

