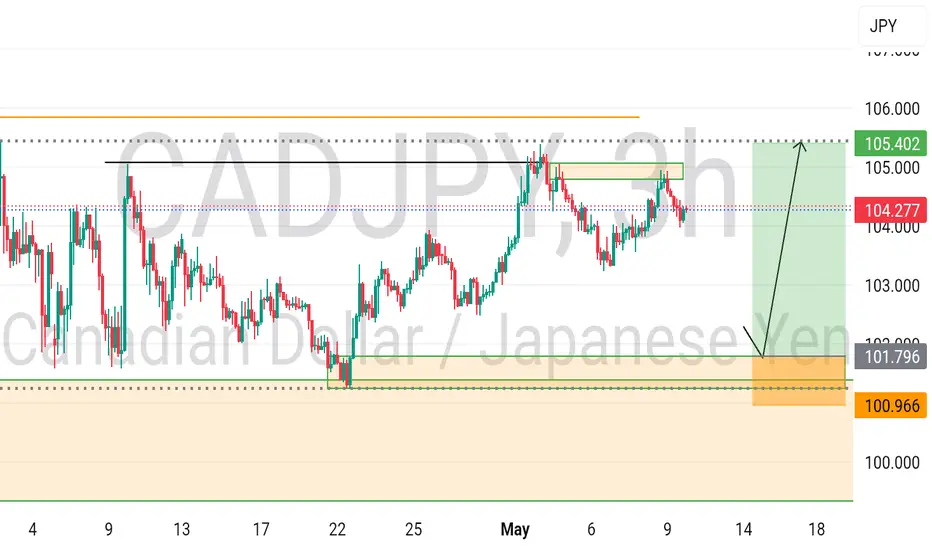
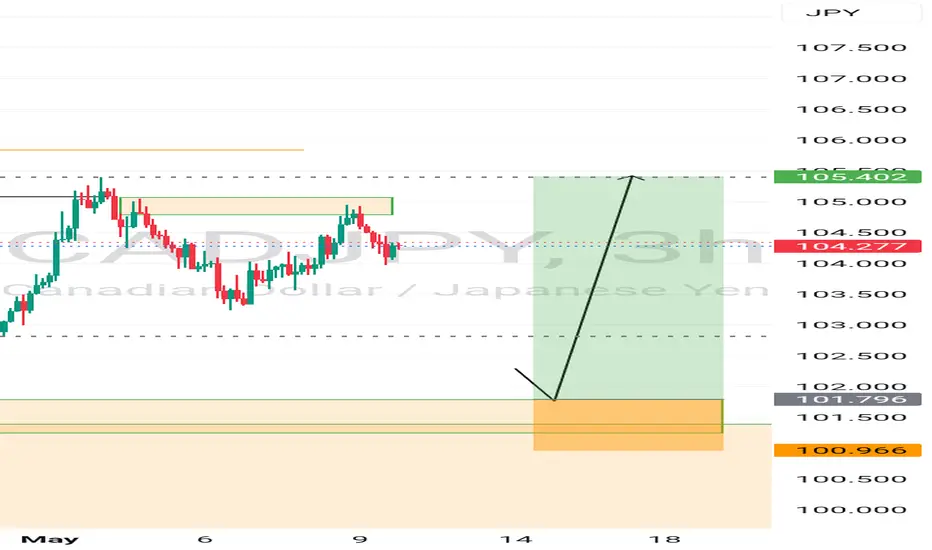
CADJPY I Long Opportunity to Middle of the ChannelWelcome back! Let me know your thoughts in the comments!
** CADJPY Analysis - Listen to video!
We recommend that you keep this pair on your watchlist and enter when the entry criteria of your strategy is met.
Please support this idea with a LIKE and COMMENT if you find it useful and Click "Follow" on our profile if you'd like these trade ideas delivered straight to your email in the future.
Thanks for your continued support!Welcome back! Let me know your thoughts in the comments!
CADJPY trade ideas

CADJPY – Risk at the Zone, Reward in the BouncePrice tapped into this key demand zone after extended downside pressure. If bulls hold this level, we could see a sharp reaction back toward 104.30+. Tight stop, clean setup. Let’s see if the level holds. ✅

GBP/JPY Short and CAD/JPY ShortGBP/JPY Short
Minimum entry requirements:
• Corrective tap into area of value.
• 4H risk entry or 1H risk entry after 2 x 1H rejection candles.
Minimum entry requirements:
• Tap into area of value.
• 1H impulse down below area of value.
• If tight non-structured 5 min continuation follows, reduced risk entry on the break of it.
• If tight structured 5 min continuation follows, reduced risk entry on the break of it or 5 min risk entry within it.
• If tight non-structured 15 min continuation follows, 5 min risk entry within it if the continuation is structured on the 5 min chart or reduced risk entry on the break of it.
• If tight structured 15 min continuation follows, reduced risk entry on the break of it or 15 min risk entry within it.
CAD/JPY Short
Minimum entry requirements:
• Corrective tap into area of value.
• 4H risk entry or 1H risk entry after 2 x 1H rejection candles.
Minimum entry requirements:
• Tap into area of value.
• 1H impulse down below area of value.
• If tight non-structured 5 min continuation follows, reduced risk entry on the break of it.
• If tight structured 5 min continuation follows, reduced risk entry on the break of it or 5 min risk entry within it.
• If tight non-structured 15 min continuation follows, 5 min risk entry within it if the continuation is structured on the 5 min chart or reduced risk entry on the break of it.
• If tight structured 15 min continuation follows, reduced risk entry on the break of it or 15 min risk entry within it.

CAD/JPY BEARS ARE STRONG HERE|SHORT
Hello, Friends!
We are going short on the CAD/JPY with the target of 101.132 level, because the pair is overbought and will soon hit the resistance line above. We deduced the overbought condition from the price being near to the upper BB band. However, we should use low risk here because the 1W TF is green and gives us a counter-signal.
Disclosure: I am part of Trade Nation's Influencer program and receive a monthly fee for using their TradingView charts in my analysis.
✅LIKE AND COMMENT MY IDEAS✅

CADJPY bullishThis is a swing bullish deal.
Trouble bottom pattern and on a daily it Bullish Bat/Crab pattern.
You can enter from the current price and stop loss 103.75 and target 110.413

CADJPY: Expecting Bullish Continuation! Here is Why:
Balance of buyers and sellers on the CADJPY pair, that is best felt when all the timeframes are analyzed properly is shifting in favor of the buyers, therefore is it only natural that we go long on the pair.
Disclosure: I am part of Trade Nation's Influencer program and receive a monthly fee for using their TradingView charts in my analysis.
❤️ Please, support our work with like & comment! ❤️

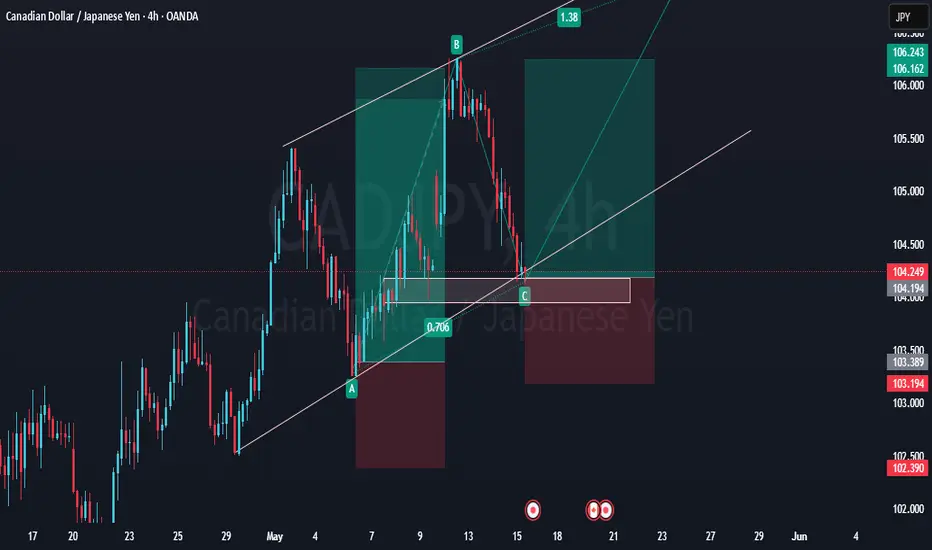
CADJPY BULLISHCADJPY bullish in H4
printing HH &HL
at current price 0.61% fib level
complete its retracement for further bullish move
follow ab=cd pattern
now on c point
CAD/JPY For Bearish as pull-backyou can go short now
or
wait for pull-back near by entry point and then go short
general trend is up trend
current phase is pull-back
have fun :)

New update The market respected but went for a short position to collect and create liquidity on the down side for a long pullback .now that it's done with, it has to go up and give us an entry

CADJPY BUY TRADE PLAN🔥 CADJPY SWING BUY TRADE PLAN 🔥
📅 Date: 5 MAY 2025
📋 TRADE PLAN OVERVIEW:
* Type: Swing
* Direction: Buy
* Confidence: ⭐⭐⭐⭐ (86%)
* Risk:Reward: 3.8:1
* Status: Waiting
📌 Guidance Note:
This is the Primary HTF Buy Plan based on the D1 bullish continuation structure after CHoCH and iBOS confirmation. Risk priority: 1.0%. Execution on H4 structure or confirmed H1 sweep + breaker block.
📈 MARKET BIAS & TRADE TYPE:
* Bias: Bullish 📈
* Trade Type: Continuation (HTF swing leg continuation off deep retracement)
🔰 CONFIDENCE LEVEL:
* ⭐⭐⭐⭐ (86%)
Confluence Breakdown:
* H4 BOS + CHoCH: ✅ 28%
* Deep Discount OB Zone: ✅ 22%
* Multi-Liquidity Sweep Trap Potential: ✅ 18%
* Sentiment/Macro Alignment: ✅ 18%
📍 ENTRY ZONES:
* 🟩 Primary Buy Zone:
103.850 – 103.550
(D1 OB + 70.5% FIB + internal liquidity pool)
* 🟨 Secondary Zone (less aggressive):
104.050 – 103.950
(H4 FVG + minor sweep inducement)
❗ STOP LOSS:
* SL: 103.150
(Below OB wick + 1x H4 ATR)
ATR-adjusted for mid-volatility conditions
🎯 TAKE PROFITS:
TP Target R:R Notes
TP1 104.950 2.3:1 Internal H4 liquidity pocket
TP2 105.780 3.8:1 Full bullish continuation leg target
TP3 106.900 5.2:1 D1 cleanout of March supply high
🧠 MANAGEMENT STRATEGY:
* Risk: 1.0%
* SL to BE: After TP1 hit (breakeven +10 pips)
* Scaling:
* 50% at TP1
* 30% at TP2
* 20% runner to TP3 (trailing logic engaged)
⚠️ CONFIRMATION CRITERIA (OPTIONAL FOR SNIPERS):
* H1/H4 bullish engulfing OR pin bar from zone
* Volume spike confirmation
* Breaker block trigger OR iBOS inside zone
⏳ VALIDITY:
* Plan Type: Swing
* Expiry: 72 hours
* Auto-expire if structure breaks or invalidated macro shift
❌ INVALIDATION:
* H4 CHoCH against bullish bias
* D1 closes below 103.100
* Macro reversal (JPY strength surge + risk-off flow + DXY spike)
🌐 FUNDAMENTAL & SENTIMENT SNAPSHOT:
* COT: Net JPY short bias remains, CAD neutral to mild bullish
* Retail Sentiment: 72% short = bullish contrarian signal ✅
* DXY: Consolidating — risk-neutral, supporting risk pairs
* VIX: Stable sub-16 (risk-on supportive)
* Macro: Oil stable; Canada correlation supportive
* Sentiment Score: +7/10 ✅
📋 FINAL TRADE SUMMARY:
We are executing a high-confidence CADJPY swing buy from D1 structural continuation zone. Market has swept prior lows and returned to premium discount OB zone. HTF structure is bullish with multiple liquidity traps below. Risk-on sentiment and macro fundamentals support CAD. We scale in with full precision management and SL protections.
"Execute on structure, not impulse. Confirmed. Blueprinted. Disciplined."

CADJPYHigh risk trade
There was a nice breakout with a displacement candle
Am waiting for a pullback to cover the displacement candle and tap into my poi
NOTE: I WILL STILL WAIT FOR OTHER CONFLUENCES BECAUSE TAKING THIS TRADE
ENTER AT UR OWN RISK ❗❗❗❗❗❗

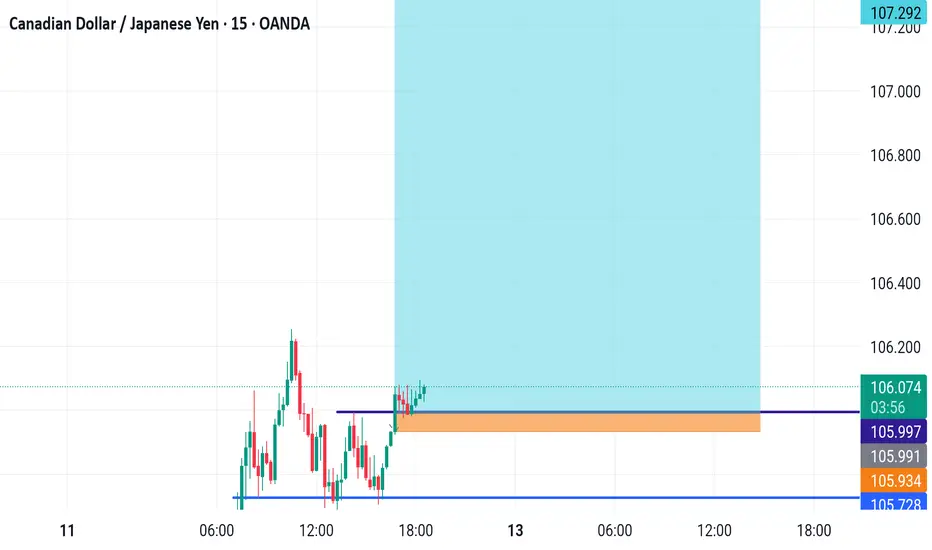
CAD_JPY STRONG BULLISH BIAS|LONG|
✅CAD_JPY made a bullish
Rebound from the rising
Support and then broke the
Key horizontal level
Around 105.727 so we are
Bullish biased and after a
Local pullback we will be
Expecting a further
Bullish continuation
LONG🚀
✅Like and subscribe to never miss a new idea!✅
Disclosure: I am part of Trade Nation's Influencer program and receive a monthly fee for using their TradingView charts in my analysis.

New updateThe market failed to respect because of a strong order block and we tried to reverse it early but this will give us a chance to be a friend with the trend
CAD/JPY For Bullishwait for pull-back near by entry point and then go long
general trend is up trend
have fun :)

CADJPY BULLISHCADJPY BULLISH
print new HH and now its print HL
at current price its good for buying
no sign for reversal

CADJPY WILL RISE.After Falling heavily, Now FX:CADJPY has successfully recovered, Climbing its way past both the 50 AND 200EMA on this H4 charts as we can see, we retested the 200EMA and we had a nice bounce away from the 200EMA. now we are heading higher. Buy CADJPY @104.116

GAPS Everywhere! YOU MUST understand how everything is connectedAll the information you need to find a high probability trade are in front of you on the charts so build your trading decisions on 'the facts' of the chart NOT what you think or what you want to happen or even what you heard will happen. If you have enough facts telling you to trade in a certain direction and therefore enough confluence to take a trade, then this is how you will gain consistency in you trading and build confidence. Check out my trade idea!!
www.tradingview.com

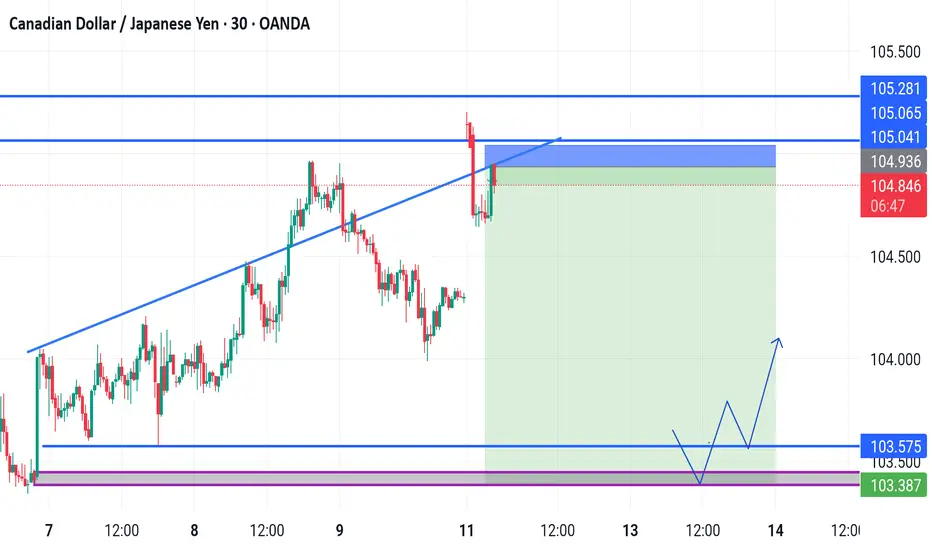
Trendline liquidity The trend line is pushing the market to an are of liquidity which is the order block as the target just wait
CADJPY bias to the upside Beautiful shift of structure Weekly, I expect to form the weekly wick by retracement of 2h structure to the AOI Daily and then continue to the major trend just broken.
Also I expect to form a zone of positioning and liquidation in this zone from my xp, so I will watch closely what is going to happen and react by the move formed.
DISCLAIMER! The information and publications are not meant to be, and do not constitute, financial, investment, trading, or other types of advice or recommendations supplied or endorsed by me

Bullish on CADJPY This is a promising reversal on CADJPY, once the confirmation triggers appear, I'll be taking a buy from the demand zone which has been marked out for a potential swing.
Bullish on CADJPYThere has been a shift of bias from sellers to buyers, I'm going long on this pair, once the confirmation triggers appear.
CADJPY: Bullish Continuation is Expected! Here is Why:
Looking at the chart of CADJPY right now we are seeing some interesting price action on the lower timeframes. Thus a local move up seems to be quite likely.
Disclosure: I am part of Trade Nation's Influencer program and receive a monthly fee for using their TradingView charts in my analysis.
❤️ Please, support our work with like & comment! ❤️
