Bullish reversal?USD/CAD is falling towards a support level, which acts as a pullback support just above the 78.6% Fibonacci projection. A bounce from this level could indicate the formation of a double bottom pattern, potentially leading to a price rise toward our take profit target.
Entry: 1.3555
Why we like it:
There is a pullback support levle.
Stop loss: 1.3465
Why we like it:
There is a support level that lines up with the 127.2% Fibonacci extension and the 100% Fibonacci projection.
Take profit: 1.3677
Why we like it:
There is a pullback resistance.
Enjoying your TradingView experience? Review us!
Please be advised that the information presented on TradingView is provided to Vantage (‘Vantage Global Limited’, ‘we’) by a third-party provider (‘Everest Fortune Group’). Please be reminded that you are solely responsible for the trading decisions on your account. There is a very high degree of risk involved in trading. Any information and/or content is intended entirely for research, educational and informational purposes only and does not constitute investment or consultation advice or investment strategy. The information is not tailored to the investment needs of any specific person and therefore does not involve a consideration of any of the investment objectives, financial situation or needs of any viewer that may receive it. Kindly also note that past performance is not a reliable indicator of future results. Actual results may differ materially from those anticipated in forward-looking or past performance statements. We assume no liability as to the accuracy or completeness of any of the information and/or content provided herein and the Company cannot be held responsible for any omission, mistake nor for any loss or damage including without limitation to any loss of profit which may arise from reliance on any information supplied by Everest Fortune Group.
CADUSD trade ideas

usdcadThe Canadian dollar is likely to move in one of 3 directions:
There is a weekly support and a weekly trend line ahead
There is a daily resistance and a 4-hour timeframe
If the 4-hour support is not broken, it is ready to buy

USDCAD: Bullish Continuation is Expected! Here is Why:
Our strategy, polished by years of trial and error has helped us identify what seems to be a great trading opportunity and we are here to share it with you as the time is ripe for us to buy USDCAD.
Disclosure: I am part of Trade Nation's Influencer program and receive a monthly fee for using their TradingView charts in my analysis.
❤️ Please, support our work with like & comment! ❤️

USDCAD: Price Approaching Buying Zone, Will DXY Bounce Back? The USDCAD pair has dropped significantly in recent times, particularly as the DXY index has plummeted. The extremely bearish nature of the DXY suggests that the price of USDCAD is melting. Both fundamental and technical indicators indicate a potential bullish price reversal for this pair, which could potentially hit our first take-profit area. This is a swing analysis, so please give time for the trade to get activated and for it to work out in our favour.
Please note that this analysis does not guarantee that the price will move as suggested. Before trading, it’s essential to conduct your own research.
If you’d like to assist us, we encourage you to consider the following actions:
- Like our ideas
- Provide comments on our ideas
- Share our ideas
Kind regards,
Team Setupsfx_
Much love ❤️🚀

#USDCAD: 1000+ Pips Big Bullish Move With Three TargetsThe USDCAD is currently in a bearish trend since the day has dropped significantly and is still falling. We anticipate the price to drop slightly more before it reaches our entry zone. There are two entry points, and you can choose either one that aligns with your views. There are three targets, and you can set take profit targets that suit you best.
Good luck and trade safely.
Thanks for your support! 😊
If you want to help us out, here are a few things you can do:
- Like our ideas
- Comment on our ideas
- Share our ideas
Team Setupsfx_
❤️🚀

#USDCAD: Two Major Buying Zones, Patience Pays! As previously analysed, USDCAD is expected to decline towards our predetermined entry point. We anticipate a bearish US Dollar for the remainder of the week, which will ultimately lead USDCAD to reach the entry zone. Three distinct target areas exist, collectively worth over 1100 pips. Each entry point, stop loss, and take profit is clearly defined.
We wish you the best of luck and safe trading.
Thank you for your support.
If you wish to assist us, we encourage you to consider the following actions:
- Like our ideas
- Provide comments on our ideas
- Share our ideas
Kind Regards,
Team Setupsfx_
Much Love ❤️🚀

USDCAD Sell ForecastUSDCAD New Forecast👨💻👨💻
This is my personal trade and not in anyway a mandatory setup.
Note:
Follow proper risk management rules. Never risk more then 2% of your total capital. Money management is the key of success in this business...... Set your own SL & TP.
Please support this idea with a Like and COMMENT if you find it useful click "follow" on our profile if you will like these type of trading ideas delivered straight to your email in the future.
Thanks for your continued support!! lemme know your thoughts in the comment sec..

Bearish continuation for USDCADI see that the short term bullish pull back for USD is over by
- Head and shoulder pattern formation
- 50 ema crossing above price
- Bearish engulfing candles forming showing bearish momentum.

USDCAD bearish continuation expected
OANDA:USDCAD still bearish expected after today's events. Price bouncing and on some good, strong zones.
SUP zone: 1.37300
RES zone: 1.36000, 1.35600

USDCAD: If This Breaks, USDCAD Might Be Lining Up a Smooth DropUSDCAD tapped into a clear liquidity zone and showed signs of weakness at the top. Price is now hovering near a potential break of structure, and a fair value gap has formed just above.
If we get that break, the idea is to wait for price to retrace into the FVG, then look for a clean continuation to the downside.
There’s also a bearish trendline holding well, adding pressure to the move. On top of that, a head and shoulders pattern is forming, another clue that momentum could be shifting lower.
No need to rush. Let the break happen. Let price return. Then act.

USDCAD Pressure Still to the DownsideHead and shoulders Pattern and bearish flag are strong confirmations that the overall trend is still bearish. However, now that the neckline of this H & S Pattern has been broken, be on the lookout for a minor retest before the downtrend resumes.
Patience Pays. The Trend is Your Friend.

USDCAD in Downtrend ContinuationForming a head and shoulders pattern, I believe the pair will continue its downtrend.
Sell Stop
Entry Price 1.3702
Stop Loss 1.3775
TP 1
Risk 1%
Lot Size 0.46

USD/CAD Forms Bullish Trend Structure – Key Levels to WatchUSD/CAD Forms Bullish Trend Structure – Key Levels to Watch
The USD/CAD pair has recently shown signs of a bullish trend formation, indicating a potential continuation of upward momentum in the coming trading sessions. The formation of a higher high on the 4-hour timeframe confirms a shift in market sentiment, suggesting that buyers are gaining control. This bullish structure signals that the pair may extend its gains, with key resistance and support levels guiding future price action.
Bullish Confirmation: Higher High Formation
A higher high is a classic technical indicator of an uptrend, reflecting increasing demand for the US dollar against the Canadian dollar. The recent price action confirms that bulls are dominating the market, increasing the likelihood of further upside movement. Traders should remain alert, as the prevailing trend suggests that any pullbacks may present buying opportunities unless a strong reversal pattern emerges.
Upside Targets: 1.38600 and 1.40100
If the bullish momentum continues, the USD/CAD pair could test the immediate resistance level at 1.38600. A decisive breakout above this level may accelerate the rally toward the next key target at 1.40100. These levels will act as critical zones where sellers might attempt to step in, but if buying pressure remains strong, the pair could extend its upward trajectory. Traders should watch for bullish continuation patterns near these resistance levels for potential breakout opportunities.
Support Level: 1.35300 as Key Floor
On the downside, 1.35300 serves as a crucial support level. Any corrective decline toward this zone could attract fresh buying interest, reinforcing the bullish outlook. A sustained break below this support would be necessary to invalidate the current uptrend, potentially shifting market sentiment in favor of the bears. Until then, traders may consider buying on dips near this support level.
Market Outlook: Bullish Bias Prevails
Given the recent price structure, the USD/CAD pair is expected to remain under buying pressure in the near term. Economic factors, including shifts in oil prices (which heavily influence the Canadian dollar) and Federal Reserve policy expectations, could further impact the pair’s movement. Traders should also monitor upcoming economic data releases, such as US inflation figures and Canadian employment reports, for additional market direction clues.
Conclusion
In summary, the USD/CAD pair has established a bullish trend, with higher highs reinforcing the upward bias. The immediate targets to watch are 1.38600 and 1.40100, while 1.35300 remains a critical support level. Unless there is a strong bearish reversal signal, the path of least resistance appears to be upward, making short-term bullish strategies favorable. As always, proper risk management and close monitoring of price action around key levels will be essential for navigating this market.

Usdcad1:6RR on this, proper analysis done. Apply proper risk management. I wont be accountable for anything. Feel free to follow my trades

USD/CAD H4 | Falling toward a pullback supportUSD/CAD is falling towards a pullback support and could potentially bounce off this level to climb higher.
Buy entry is at 1.3675 which is a pullback support that aligns closely with the 50% Fibonacci retracement.
Stop loss is at 1.3623 which is a level that lies underneath a swing-low support and the 61.8% Fibonacci retracement.
Take profit is at 1.3781 which is a swing-high resistance.
High Risk Investment Warning
Trading Forex/CFDs on margin carries a high level of risk and may not be suitable for all investors. Leverage can work against you.
Stratos Markets Limited (tradu.com ):
CFDs are complex instruments and come with a high risk of losing money rapidly due to leverage. 63% of retail investor accounts lose money when trading CFDs with this provider. You should consider whether you understand how CFDs work and whether you can afford to take the high risk of losing your money.
Stratos Europe Ltd (tradu.com ):
CFDs are complex instruments and come with a high risk of losing money rapidly due to leverage. 63% of retail investor accounts lose money when trading CFDs with this provider. You should consider whether you understand how CFDs work and whether you can afford to take the high risk of losing your money.
Stratos Global LLC (tradu.com ):
Losses can exceed deposits.
Please be advised that the information presented on TradingView is provided to Tradu (‘Company’, ‘we’) by a third-party provider (‘TFA Global Pte Ltd’). Please be reminded that you are solely responsible for the trading decisions on your account. There is a very high degree of risk involved in trading. Any information and/or content is intended entirely for research, educational and informational purposes only and does not constitute investment or consultation advice or investment strategy. The information is not tailored to the investment needs of any specific person and therefore does not involve a consideration of any of the investment objectives, financial situation or needs of any viewer that may receive it. Kindly also note that past performance is not a reliable indicator of future results. Actual results may differ materially from those anticipated in forward-looking or past performance statements. We assume no liability as to the accuracy or completeness of any of the information and/or content provided herein and the Company cannot be held responsible for any omission, mistake nor for any loss or damage including without limitation to any loss of profit which may arise from reliance on any information supplied by TFA Global Pte Ltd.
The speaker(s) is neither an employee, agent nor representative of Tradu and is therefore acting independently. The opinions given are their own, constitute general market commentary, and do not constitute the opinion or advice of Tradu or any form of personal or investment advice. Tradu neither endorses nor guarantees offerings of third-party speakers, nor is Tradu responsible for the content, veracity or opinions of third-party speakers, presenters or participants.

Falling towards major support?The Loonie (USD/CAD) is falling towards the pivot, which has been identified as an overlap support and could bounce to the 1st resistance.
Pivot: 1.3690
1st Support: 1.3667
1st Resistance: 1.3747
Risk Warning:
Trading Forex and CFDs carries a high level of risk to your capital and you should only trade with money you can afford to lose. Trading Forex and CFDs may not be suitable for all investors, so please ensure that you fully understand the risks involved and seek independent advice if necessary.
Disclaimer:
The above opinions given constitute general market commentary, and do not constitute the opinion or advice of IC Markets or any form of personal or investment advice.
Any opinions, news, research, analyses, prices, other information, or links to third-party sites contained on this website are provided on an "as-is" basis, are intended only to be informative, is not an advice nor a recommendation, nor research, or a record of our trading prices, or an offer of, or solicitation for a transaction in any financial instrument and thus should not be treated as such. The information provided does not involve any specific investment objectives, financial situation and needs of any specific person who may receive it. Please be aware, that past performance is not a reliable indicator of future performance and/or results. Past Performance or Forward-looking scenarios based upon the reasonable beliefs of the third-party provider are not a guarantee of future performance. Actual results may differ materially from those anticipated in forward-looking or past performance statements. IC Markets makes no representation or warranty and assumes no liability as to the accuracy or completeness of the information provided, nor any loss arising from any investment based on a recommendation, forecast or any information supplied by any third-party.

CADUSD STRATED FORMING BEARISH TREND STRUCTURE CADUSD STRATED FORMING BEARISH TREND STRUCTURE.
Market recently created Lower low, which indicated bearish trend.
Market is expected to remain bearish for upcoming trading sessions.
on lower side market may hit the target price of 0.7220 & 0.7135.
On higher side market may test the resistance level of 0.7390.

USDÉCAD Technical Analysis - Daily Time Frame 🔁 Market Structure:
The overall trend is bearish, with multiple Breaks of Structure (BOS) confirming sellers are in control.
Recently, price formed a Change of Character (CHoCH) at the bottom, which may indicate the beginning of a bullish correction or a temporary reversal.
The market is currently reacting from that low, showing signs of bullish pressure.
🟩 Demand Zone:
The green zone (around 1.3400 – 1.3460) marks a strong daily demand area.
This zone has shown previous bullish reactions and has not yet been fully tested in this leg.
It could serve as a high-probability long entry zone if price returns to it.
🟥 Supply Zones (Targets):
There are three red supply zones above, acting as potential take-profit levels for bulls or entry points for sellers:
TP1 (7%) – Around 1.3444
TP2 (14%) – Around 1.3790
TP3 (29%) – Around 1.4224
🎯 Trade Scenarios:
✅ Bullish Scenario (Swing Trade Toward Supply)
Item Details
Entry Zone 1.3400 – 1.3460 (daily demand zone)
Confirmation Bullish price action (e.g., engulfing candle, pin bar)
Stop Loss Below demand (e.g., under 1.3350)
Targets TP1: 1.3444 / TP2: 1.3790 / TP3: 1.4224
This setup offers a high risk-to-reward ratio if confirmed on lower timeframes.
🔴 Bearish Scenario (Continuation of Downtrend)
Item Details
Entry Zone From one of the supply areas (especially near 1.3790)
Confirmation Bearish candle (e.g., bearish engulfing, rejection wick)
Stop Loss Above the supply zone (e.g., 1.3850)
Target 1.3450 initially or lower if demand breaks
📌 Final Thoughts:
The market is currently in a correction phase.
The best long opportunity is from the demand zone around 1.3400 – 1.3460, with proper confirmation.
Targets are clearly marked based on supply zones.
Short positions should wait for confirmation near those supply levels.
⚠️ Disclaimer:
This is not financial advice or a recommendation to buy or sell.
It reflects only my personal view of the market based on the current chart structure.
Please do your own analysis and manage your risk accordingly before making any trading decisions OANDA:USDCAD

Canadian Dollar vs. US Dollar. The Spring Is Compressing.In previous posts, we have already begun to look at the key drivers of the US outperformance over the past decade.
The US market dominance has been largely driven by the rapid rise of tech giants (such as Apple, Microsoft, Amazon and Alphabet), which have benefited from strong profit growth, global market reach and significant investor inflows.
Unsatisfactory International Performance
Markets outside the US have faced headwinds including multiple stifling sanctions and tariffs, slowing economic growth, political uncertainty (especially in Europe), a stronger US dollar and the declining influence of high-growth tech sectors.
The Valuation Gap
By 2025, US equities will be considered relatively expensive compared to their international peers, which may offer more attractive valuations in the future.
Recent Shifts (2025 Trend)
Since early 2025, international equities have begun to outperform the S&P 500, and European and Asian equities have regained investor interest. Global market currencies are also widely dominated by the US dollar.
Factors include optimism around the following three big themes.
DE-DOLLARIZATION. DE-AMERICANIZATION. DIVERSIFICATION.
De-dollarization is the process by which countries reduce their reliance on the US dollar (USD) as the world's dominant reserve currency, medium of exchange, and unit of account in international trade and finance. This trend implies a shift away from the central role of the US dollar in global economic transactions to alternative currencies, assets, or financial systems.
Historical context and significance of the US dollar
The US dollar became the world's primary reserve currency after World War II, as enshrined in the Bretton Woods Agreement of 1944. This system pegged other currencies to the dollar, which was convertible into gold, making the dollar the backbone of international finance. The United States became the world's leading economic power, and the dollar replaced the British pound sterling as the dominant currency for global trade and reserves.
The dollar has been the most widely held reserve currency for decades. As of the end of 2024, it still accounts for about 57% of global foreign exchange reserves, far more than the euro (20%) and the Japanese yen (6%). However, this share has fallen from over 70% in 2001, signaling a gradual shift and prompting discussions about de-dollarization.
How De-Dollarization Works
Countries looking to reduce their reliance on the dollar are pursuing several strategies:
Diversifying reserves: Central banks are holding fewer U.S. dollars and increasing their holdings of other currencies, such as the euro, yen, British pound, or new alternatives such as the Chinese yuan. While the yuan's share remains small (about 2.2%), it has grown, especially among countries like Russia.
Using alternative currencies in trade: Countries are entering into bilateral or regional agreements to conduct trade in their own currencies rather than using the dollar as an intermediary. For example, China has introduced yuan-denominated oil futures (the "petroyuan") to challenge the petrodollar system. Increasing gold reserves: Many countries, including China, Russia and India, have significantly increased their purchases of gold as a safer reserve asset, reducing their dollar holdings.
Developing alternative financial systems: Some countries and blocs, such as BRICS, are working to develop alternatives to the US-dominated SWIFT payment system to avoid the risk of sanctions and gain true economic and political independence.
Reasons for de-dollarization
The move towards de-dollarization is driven by geopolitical and economic factors:
Backlash against US economic hegemony: The US often uses dollar dominance to impose sanctions and exert political pressure, encouraging countries to seek financial sovereignty.
Rise of new economic powers: Emerging economies like China and groups like the BRICS are seeking to reduce their vulnerability to U.S. influence and promote regional integration and alternative financial infrastructures.
Geopolitical tensions: Conflicts like the war in Ukraine have intensified efforts by countries like Russia to remove the dollar from their reserves to avoid sanctions.
Implications and outlook
While the dollar remains dominant, a more de-dollarized world is already changing global economic power. The U.S. may lose some advantages, such as lower borrowing costs and geopolitical influence. For the U.S. economy, de-dollarization could lead to a weaker currency, higher interest rates, and reduced foreign investment, although some effects, such as inflation from a weaker dollar, could belimited .
For other countries, de-dollarization could mean greater economic independence and less exposure to U.S. policy risks. However, no currency currently matches the dollar’s liquidity, stability, and global recognition, so a full transition is unlikely in the near future .
Summary
De-dollarization is a complex, ongoing process that reflects a gradual shift away from the global dominance of the U.S. dollar. It involves diversifying reserves, using alternative currencies and assets, and creating new financial systems to reduce dependence on the dollar.
Driven by geopolitical tensions and the rise of emerging economic powers, de-dollarization challenges the entrenched role of the dollar but is unlikely to completely replace it anytime soon.
Instead, it is leading to a more multipolar monetary system in international finance, increasing demand for alternative investments to the U.S.
Technical task
The main technical chart is presented in a quarterly breakdown, reflecting the dynamics of the Canadian dollar against the US dollar FX_IDC:CADUSD in the long term.
With the continued positive momentum of the relative strength indicator RSI(14), flat support near the level of 0.70 and a decreasing resistance level (descending top/ flat bottom) in case of a breakout represent the possibility of price growth to 0.80, with the prospect of parity in the currency pair and strengthening of the Canadian dollar to all-time highs, in the horizon of the next five years.
--
Best wishes,
Your Beloved @PandorraResearch Team 😎

USD/CAD Battlelines Drawn at Former SupportUSD/CAD briefly registered in intraday low at 1.3540 last week before mounting a massive outside-weekly reversal off the yearly lows. The subsequent rally extended more than 1.9% off the low with the advance exhausting into resistance this week at 1.3795-1.3836- a region defined by the 61.8% retracement of the late-2023 advance, the April low-close, and the 23.6% retracement of the yearly range. Looking for inflection off this mark to offer guidance with the immediate recovery vulnerable while below.
Initial weekly support rests with the 61.8% retracement of the June range at 1.3639 with key support steady at the 1.618% extension of the February decline / 78.6% retracement at 1.3504/23- look for a larger reaction there If reached with a close below needed to mark resumption of the yearly downtrend. Subsequent support objectives rest with the 2024 low-week clow (LWC) at 1.3360 and the 2023 LWC at 1.3218.
A topside breach / close above the 2022 trendline (red) is needed to suggest a more significant low is in place / a larger recovery is underway with the next major technical consideration eyed at 1.3963-1.4018- a region defined by the 52-week moving average, the 2022 swing high and the 38.2% retracement. A weekly close above this key pivot zone is ultimately needed to invalidate the yearly downtrend in USD/CAD.
Bottom line: A rebound off the yearly channel is now approaching initial resistance at former support- looking for possible price inflection off the 1.3795-1.3835 zone into the monthly cross. From a trading standpoint, rallies would need to be limited to the 2022 trendline IF price is heading lower on this stretch / to validate a break of the multi-year uptrend with a close below 1.3504 still needed to mark resumption.
-MB

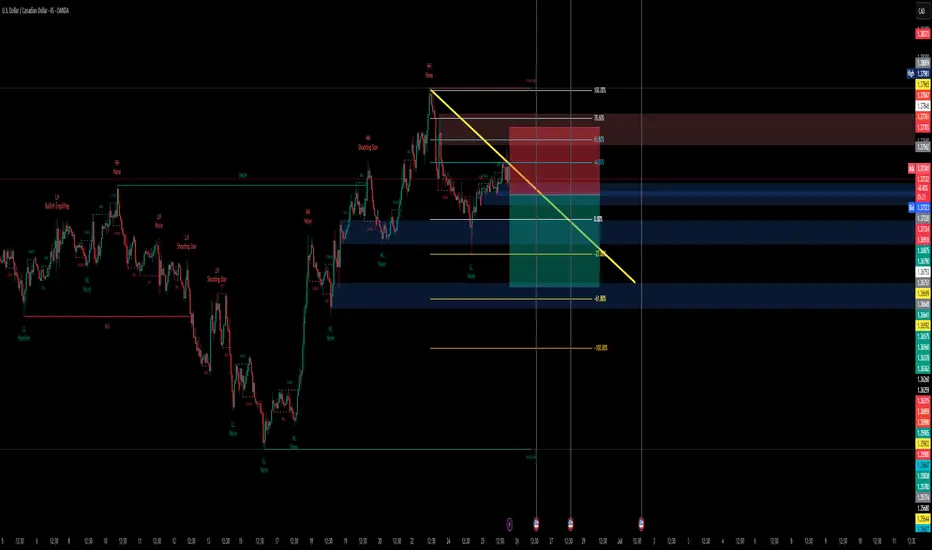
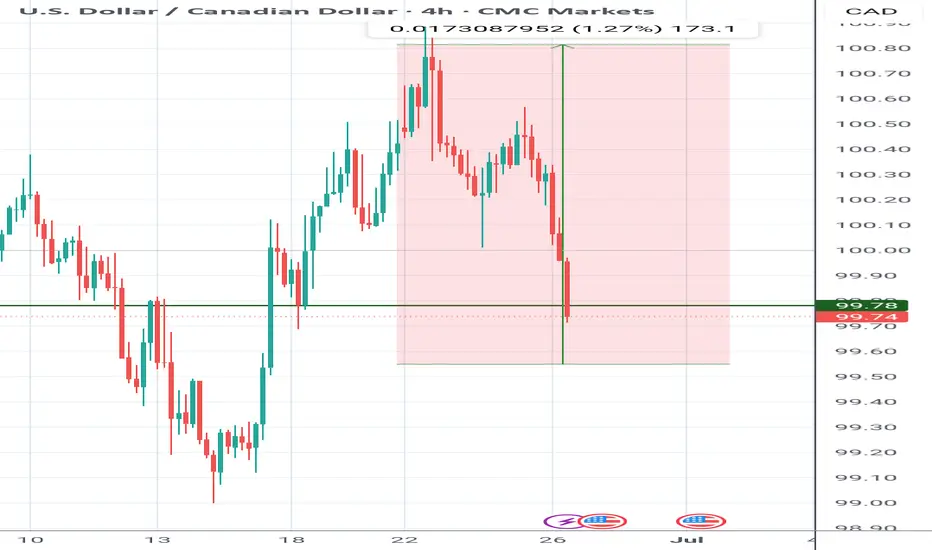
USDCAD - Followed Oil💱 USDCAD Drop Aligned Perfectly with Oil Selloff
Instrument: USD/CAD
Timeframe: 15-Minute
Date: 23 June 2025
Indicator: ELFIEDT RSI + Reversion
🔍 What Happened:
While Crude Oil (WTI) began its sharp descent on Monday, the ELFIEDT system flagged a “DOWN” signal on USD/CAD — catching a clean reversal just above 1.3790.
This correlation isn't random. USD/CAD often mirrors oil’s movement in reverse — and ELFIEDT picked up on that dynamic perfectly.
As WTI tanked, CAD strength kicked in and USD/CAD sold off — just as our system anticipated.
💰 The Result:
From the top, price dropped well over 80 pips in a smooth, sustained move that lasted for days.
The signal:
✅ Caught the short high
✅ Delivered momentum without noise
✅ Confirmed cross-market alignment for confident entries
When both WTI and USD/CAD fire in sync, you know you're trading with structure.
📌 Why It Stands Out:
You didn’t need to know the macro correlation.
You didn’t need a complex multi-screen setup.
ELFIEDT simply printed the DOWN label, and price followed.
One system. One signal. Multiple assets—aligned.
📈 When Everything Aligns, Confidence Is Easy
The system gave short setups on WTI and USD/CAD on the same day — both delivering clean, profitable moves.
That’s the power of ELFIEDT — built to read shifts before they become obvious.
