USDCAD Still In a DowntrendAbout a week ago I posted that USDCAD is in a downtrend but I saw a potential for a retracement and a bounce in daily demand. The bounce happened and price retested a daily resistance zone. Now I believe the trend will continue to the downside.
CADUSD trade ideas

USDCAD Eyes Oct 2022 Resistance Once AgainFollowing the U.S.–Iran strike over the weekend, the U.S. dollar strengthened, posting solid rebounds across major dollar pairs. The USD/CAD chart, in particular, climbed back toward the 1.38 level.
The pair is now eyeing a key resistance zone between 1.3840 and 1.3880, a range that has consistently held since October 2022. A decisive break and hold above this zone could pave the way for a continued rally toward the 1.40 mark.
Conversely, a drop back below 1.3600 could signal renewed downside risk for 2025, in line with the broader bearish trend that has defined the year so far.
— Razan Hilal, CMT

USD/CAD — Rising Wedge Reversal Loading…
A steep rising wedge has formed — a classic bearish pattern often signaling exhaustion.
Price is testing strong yellow resistance zones between 1.3795 – 1.3855.
Entry Dates:
📅 June 23 & 24 — ideal windows to catch a possible reversal.
📉 Bearish Targets:
→ 1.3750
→ 1.3700
→ 1.3640
→ More downside if momentum kicks in.
🧠 This setup screams “overbought squeeze → sharp drop”. Big players might be waiting to short the rip.

Bearish momentum to meet support on USDCAD: Looking for a bounceEvening, just wanted to share what I’m seeing on the USDCAD chart
Price on USDCAD has been in clear bearish momentum, but we’re now approaching a strong support zone, that’s held firm multiple times before, as I marked it on my chart. Price is approaching the zone again and I am taking it into account for a potential bounce.
I’ll be watching for bullish confirmation as usual requirement before entering. If that support holds, I’m targeting 1.38400 , totally achievable if momentum shifts.
BUT, if this zone breaks with momentum, I’ll reassess it and stay flexible.
💡 Reminder: Patience is power, no entry until price shows me something worth reacting to. This is not financial advice.

USDCAD is Nearing The Daily TrendHey Traders, in today's trading session we are monitoring USDCAD for a selling opportunity around 1.38500 zone, USDCAD is trading in a downtrend and currently is in a correction phase in which it is approaching the trend at 1.38500 support and resistance area.
Trade safe, Joe.

Market Analysis: USD/CAD Breaks HigherMarket Analysis: USD/CAD Breaks Higher
USD/CAD is rising and might aim for more gains above the 1.3765 resistance.
Important Takeaways for USD/CAD Analysis Today
- USD/CAD is showing positive signs above the 1.3720 support zone.
- There is a key bullish trend line forming with support at 1.3740 on the hourly chart at FXOpen.
USD/CAD Technical Analysis
On the hourly chart of USD/CAD at FXOpen, the pair formed a strong support base above the 1.3540 level. The US Dollar started a fresh increase above the 1.3600 resistance against the Canadian Dollar.
The bulls pushed the pair above the 1.3640 and 1.3700 levels. The pair cleared the 50-hour simple moving average and climbed above 1.3750. A high was formed at 1.3766 and the pair is now consolidating.
Initial support is near the 1.3740 level. There is also a key bullish trend line forming with support at 1.3740. The next major support is near the 1.3710 level or the 23.6% Fib retracement level of the upward move from the 1.3539 swing low to the 1.3766 high.
The main support sits near the 1.3650 zone on the USD/CAD chart. It is near the 50% Fib retracement level.
A downside break below the 1.3650 level could push the pair further lower. The next major support is near the 1.3595 support zone, below which the pair might visit 1.3540.
If there is another increase, the pair might face resistance near the 1.3765 level. A clear upside break above 1.3765 could start another steady increase. The next major resistance is the 1.3800 level. A close above the 1.3800 level might send the pair toward the 1.3880 level. Any more gains could open the doors for a test of the 1.4000 level.
This article represents the opinion of the Companies operating under the FXOpen brand only. It is not to be construed as an offer, solicitation, or recommendation with respect to products and services provided by the Companies operating under the FXOpen brand, nor is it to be considered financial advice.

Market Insights with Gary Thomson: 23 - 27 JuneMarket Insights with Gary Thomson: Canada Inflation, US Core Consumer Metrics, and Earnings Reports
In this video, we’ll explore the key economic events, market trends, and corporate news shaping the financial landscape. Get ready for expert insights into forex, commodities, and stocks to help you navigate the week ahead. Let’s dive in!
In this episode, we discuss:
— Inflation Rate in Canada
— US Durable Goods Orders
— US PCE Price Index, Personal Income & Personal Spending
— Corporate Earnings Statements
Don’t miss out—gain insights to stay ahead in your trading journey.
This video represents the opinion of the Companies operating under the FXOpen brand only. It is not to be construed as an offer, solicitation, or recommendation with respect to products and services provided by the Companies operating under the FXOpen brand, nor is it to be considered financial advice.

USD/CAD Tests Key Resistance Amid Mixed Global Economic SignalsTechnical Analysis
On the 4-hour chart, USD/CAD has broken above the 1.3746 resistance level, which corresponds to the top swing of the recent rally from 1.3687.
The breakout above this level is a bullish signal, reinforced by a positive RSI reading above 70, indicating strong buying momentum.
The MACD histogram is in positive territory, and the stochastic oscillator remains near overbought levels, showing sustained bullish energy.
Price action seems to retest the broken upper boundary of a descending channel drawn from the last high near 1.3723-1.3747.
This resistance zone near 1.3770-1.3783 also coincides with the 141.4% and 161.8% Fibonacci extensions, marking key targets for continuation should bulls maintain control.
Alternative Scenario
If the price fails to hold above the 1.3746 breakout level and retreats back below 1.3723 (61.8% Fibonacci retracement), we could see a pullback towards the lower support zone near 1.3687. A breakdown below this support may extend the correction into the mid-1.3600s, retesting the lower channel boundary.

USDCAD SELL TRADESell opportunity on USDCAD NOW.
ENTRY: 1.37600
STOPLOSS: 1.37700
TAKEPROFIT: 1.36900
Comment your opinion pls 🙏
For Account management. Pls Contact me via X @shajudeakinoba1

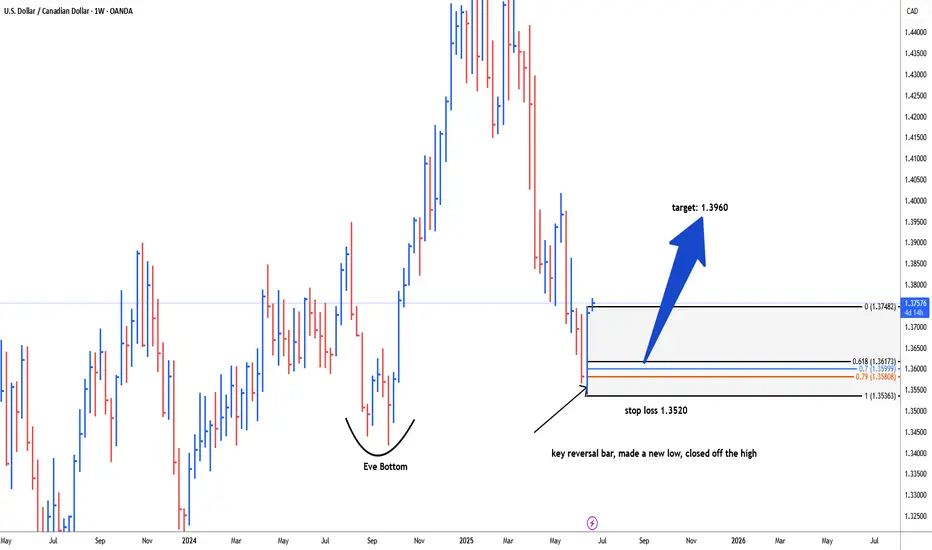
USDCAD possible bullish reversal for 1.3960#usdcad weekly key reversal bar, made a new low, closed off the high, early indication for reversal. It's better to wait for correction 61.8 fib level, 79.0 fib level and 79.0 fib level to reduce/secure drawdwon i.e. 1.3622-1.3585 is the area of interest for long trade. stop loss below key reversal bar i.e. 1.3520. target level: 1.3960
Market tapped on Our Order Block which is our mitigation zonePrice just tapped on the order Block which we might look for bullish trend

Looking to short USDCADPrice mitigates a 4h fvg and Monday opening price(New York time) has taken out sell side liquidity and gave a quick market structure shift to the down side confirming the set up. Looking to short at the median of a 5m fvg that resulted in the MSS. Target is a 1h inverted fvg which aligns with the 50% mark of the Fibonacci range.

USDCAD - Bullish Falling WedgeHello Traders !
The USDCAD price formed a falling wedge pattern.
Currently, The resistance line is broken!
So, I expect a bullish move🚀
______________
TARGET: 1.37490🎯

USDCAD LongUSDCAD is now net long on the regression break.
I am considering this trades as the positive roll make it attractive.
Bullish rise?The Loonie (USD/CAD) has reacted off the pivot and could potentially rise to the 1st resistance which acts as a pullback resistance.
Pivot: 1.3697
1st Support: 1.3561
1st Resistance: 1.3843
Risk Warning:
Trading Forex and CFDs carries a high level of risk to your capital and you should only trade with money you can afford to lose. Trading Forex and CFDs may not be suitable for all investors, so please ensure that you fully understand the risks involved and seek independent advice if necessary.
Disclaimer:
The above opinions given constitute general market commentary, and do not constitute the opinion or advice of IC Markets or any form of personal or investment advice.
Any opinions, news, research, analyses, prices, other information, or links to third-party sites contained on this website are provided on an "as-is" basis, are intended only to be informative, is not an advice nor a recommendation, nor research, or a record of our trading prices, or an offer of, or solicitation for a transaction in any financial instrument and thus should not be treated as such. The information provided does not involve any specific investment objectives, financial situation and needs of any specific person who may receive it. Please be aware, that past performance is not a reliable indicator of future performance and/or results. Past Performance or Forward-looking scenarios based upon the reasonable beliefs of the third-party provider are not a guarantee of future performance. Actual results may differ materially from those anticipated in forward-looking or past performance statements. IC Markets makes no representation or warranty and assumes no liability as to the accuracy or completeness of the information provided, nor any loss arising from any investment based on a recommendation, forecast or any information supplied by any third-party.

USDCAD H4 AnalysisUSDCAD Showing a Bearish Flag. If it breaks this zone above, Most probably can fly up to 1.37836 and higher to 1.38654. If no, Can rally between 1.36359, 1.35415 or even lower. Trading Analysis from 23-06-25 to 27-06-25. Take your risk under control and wait for market to break support or resistance on smaller time frame. Best of luck everyone and happy trading.🤗

Smart Money Just Flipped Bearish on USD/CAD. Are You Still Long?🧠 1. COT Context & Institutional Flows
🇨🇦 CAD COT Report (CME) – June 10, 2025
Non-Commercials (speculators): net short 93,143 contracts (19,651 long vs. 112,794 short), with a short reduction of -14,319 → early bearish unwinding.
Commercials: net long 91,207 contracts (223,285 long vs. 132,078 short), with strong accumulation (+27,999 longs).
🔄 Net open interest change: +18,436 → renewed institutional interest on the long CAD side.
🇺🇸 USD Index COT Report (ICE) – June 10, 2025
Non-Commercials: net long 1,402 contracts (17,027 long vs. 15,625 short), with a +1,279 increase in longs → modest USD support.
Commercials remain net short -35 contracts, no clear shift.
🔄 Total open interest +2,652 → mild bullish interest in USD.
📌 Implication: Strong institutional support for CAD, USD mildly supported. Net positioning favors downside pressure on USD/CAD.
💹 2. Technical Analysis & Price Action
Primary trend: clearly bearish from the 1.38 zone.
Current price: 1.3552, testing a macro demand zone (1.3470–1.3540).
Daily RSI remains deeply oversold → possible technical bounce, but no reversal structure confirmed.
Recent candles show lower highs and lower lows, with no bullish momentum.
📌 Implication: The bearish trend remains in control. A technical rebound is possible, but bias stays short as long as price trades below 1.3640.
📈 3. Retail Sentiment
77% of retail traders are long USD/CAD, with an average entry at 1.3646.
Only 23% are short, positioned better at 1.3790.
📌 Implication: Retail is heavily long → contrarian bearish signal confirmed.
📊 4. Seasonality
June is historically weak for USD/CAD:
5Y Avg: -0.0118
2Y Avg: -0.0081
The June seasonal curve shows a stronger downside acceleration into the second half of the month.
📌 Implication: Seasonality adds downward pressure into month-end.

Bullish bounce off pullback support?USD/CAD has bounced off the support level which is a pullback support that lines up with the 23.6% Fibonacci retracement and could rise from this level to our take profit.
Entry: 1.3703
Why we like it:
There is a pullback support level that lines up with the 23.6% Fibonacci retracement.
Stop loss: 1.3647
Why we like it:
There is an overlap support that lines up with the 50% Fibonacci retracement.
Take profit: 1.3815
Why we like it:
There is a pullback resistance that aligns with the 145% Fibonacci extension.
Enjoying your TradingView experience? Review us!
Please be advised that the information presented on TradingView is provided to Vantage (‘Vantage Global Limited’, ‘we’) by a third-party provider (‘Everest Fortune Group’). Please be reminded that you are solely responsible for the trading decisions on your account. There is a very high degree of risk involved in trading. Any information and/or content is intended entirely for research, educational and informational purposes only and does not constitute investment or consultation advice or investment strategy. The information is not tailored to the investment needs of any specific person and therefore does not involve a consideration of any of the investment objectives, financial situation or needs of any viewer that may receive it. Kindly also note that past performance is not a reliable indicator of future results. Actual results may differ materially from those anticipated in forward-looking or past performance statements. We assume no liability as to the accuracy or completeness of any of the information and/or content provided herein and the Company cannot be held responsible for any omission, mistake nor for any loss or damage including without limitation to any loss of profit which may arise from reliance on any information supplied by Everest Fortune Group.

USDCAD TRADE SETUPWait for retest the entry level and bullish momentum then take a trade for Buy otherwise skip this setup

The End of A Trend & The Start of A New OneA few weeks ago we made an amazing bearish call of the $USDCAD. Now that it's come to an end, the market is showing signs of a potential reversal.
In this video we're going to talk about how to identify a potential reversal in trend and of course show you how I'm looking to trade it.
Please leave any questions, comments or shared ideas below.
Akil

USDCAD DETAILED ANALYSISUSDCAD has formed a classic falling wedge pattern on the daily timeframe, with price currently pressing against the upper trendline resistance near 1.37300. This is a high-probability bullish reversal setup, and the pair is showing early signs of a potential breakout. The recent bullish momentum from the lows suggests buyers are stepping in aggressively, and if we get a strong daily close above the wedge, it could confirm the start of a new upward leg. My near-term target for this breakout is 1.47300, offering an excellent risk-reward profile.
From a fundamental perspective, the Canadian Dollar is currently under pressure due to weakening oil prices and softening domestic economic data. The Bank of Canada has recently signaled a dovish tilt following its latest rate cut in June, citing slower GDP growth and easing inflation. On the other hand, the US Dollar is finding renewed strength backed by sticky inflation and the Fed’s cautious stance on rate cuts. The divergence in monetary policy between the Fed and BoC is creating a favorable environment for USDCAD bulls.
Technically, the confluence of wedge resistance, bullish divergence on the RSI, and a clear higher low formation all point toward a breakout scenario. A break above 1.37600–1.38000 would unlock the next wave of bullish continuation, potentially accelerating momentum toward the 1.47 handle. This area also aligns with the previous March highs, making it a strong technical magnet.
I remain bullish on USDCAD and will be watching the breakout closely this week. If the pair holds above 1.36800 and breaks structure convincingly, I’ll be adding to longs on confirmation. The current setup presents a textbook breakout opportunity supported by strong fundamentals, technical structure, and market sentiment leaning in favor of the USD.

USD/CAD Trap in Progress? Smart Money Flips BearishUSD/CAD is currently in a rebalancing phase after the strong downside correction seen over recent weeks. Following a rejection in the 1.3900–1.4000 supply zone, price retraced down to a major demand area between 1.3500 and 1.3650, where it has shown a notable bullish reaction. The pair is now trading at 1.3734, and multi-frame data suggests we are in a transitional phase—not yet a confirmed bullish trend reversal.
COT Report – Institutional Positioning
The latest Commitments of Traders data (June 10th) reveals critical signals:
Commercials (hedgers and large institutions) have aggressively increased their long exposure on CAD, adding +27,999 contracts. This indicates strong expectations of Canadian dollar appreciation—bearish implications for USD/CAD in the medium term.
Non-Commercials (speculators) reduced their short CAD exposure by -14,319 contracts, signaling that speculative players are starting to unwind long USD/CAD positions.
Overall, the net shift shows institutional sentiment turning bearish on the pair, potentially pointing to a deeper downside once the current technical pullback completes.
USD Index COT – Dollar Momentum Weakening
On the USD Index, Non-Comms have added +1,279 long contracts, but positioning remains moderate. Commercials are flat, suggesting the dollar lacks strong bullish backing. This makes any sustained USD/CAD rally structurally fragile.
Retail Sentiment
Retail traders are 57% short and 43% long on USD/CAD. Although not extreme, this imbalance suggests confidence among retail participants in a bearish move—often preceding a short-term upward squeeze before an eventual trend continuation.
We could therefore see price move toward 1.3900 as a liquidity grab, setting the stage for a larger reversal.
Technical Analysis – Outlook
Key highlights:
A strong bullish reaction occurred from the 1.3500–1.3650 demand zone, previously well-respected.
The weekly RSI is still below the 50-level but is turning upward—momentum is improving.
Price structure shows room for a pullback to the 1.3900–1.4000 supply zone, which aligns with higher-timeframe order blocks.
This zone remains a critical resistance, and unless the macro and positioning context changes, a renewed bearish impulse is expected from this area.
Trading Outlook
The current picture presents a tactical short-term long opportunity, followed by a potential structural short setup.
📈 Scenario 1 – Bullish Pullback (in play):
With price above 1.3700 and consolidating, there’s space for a rally toward the 1.3900–1.4000 supply zone. Ideal for short-term targets.
📉 Scenario 2 – Structural Short (priority bias):
Should price reach 1.3950–1.4000 and show bearish confirmation (e.g., engulfing, doji, rejection on H4/H1), this would be a prime area to initiate swing shorts, targeting 1.3600 and eventually 1.3450.
✅ Final Bias: Structural Bearish – Corrective Bullish
Watch for potential false breakouts above 1.3800–1.3900 to liquidate retail shorts before a more meaningful downside move. The sharp increase in commercial net long CAD positions supports a bearish USD/CAD bias for the coming weeks.

USDCAD LONG SETUPI am expecting the US Dollar to be bullish this week.
Weekly closed as a bullish engulfing.
Expecting price to make a minor pull back on the daily before taking making another bullish push.
Price is also showing a bullish divergence on the daily, which furthers strengthens my perspective.
The 2H TF also illustrates somewhat of a Cup-and-Handle Candle Stick Formation
Will look to enter longs on the lower TFs (1-4h)
