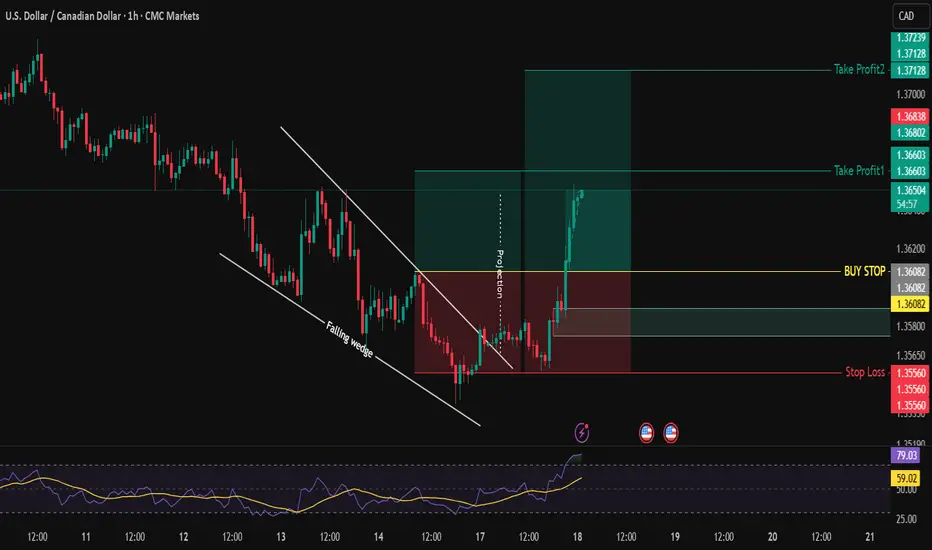
USDCAD BULLISH USDCAD bullish divergence.
And falling wedge formed which indicates the chances of bullish trend.
this trade active on my accounts but miss the chart published.
CADUSD trade ideas
Price action Now the market has become a bit tricky usdcad has all the qualities of bearish move liquidity sweep now a sell side entry this trade is a bit risky
Bullish continuation?The Loonie (USD/CAD) is falling towards the pivot which is an overlap support and could bounce to the 1st resistance which is a pullback resistance.
Pivot: 1.3691
1st Support: 1.3666
1st Resistance: 1.3742
Risk Warning:
Trading Forex and CFDs carries a high level of risk to your capital and you should only trade with money you can afford to lose. Trading Forex and CFDs may not be suitable for all investors, so please ensure that you fully understand the risks involved and seek independent advice if necessary.
Disclaimer:
The above opinions given constitute general market commentary, and do not constitute the opinion or advice of IC Markets or any form of personal or investment advice.
Any opinions, news, research, analyses, prices, other information, or links to third-party sites contained on this website are provided on an "as-is" basis, are intended only to be informative, is not an advice nor a recommendation, nor research, or a record of our trading prices, or an offer of, or solicitation for a transaction in any financial instrument and thus should not be treated as such. The information provided does not involve any specific investment objectives, financial situation and needs of any specific person who may receive it. Please be aware, that past performance is not a reliable indicator of future performance and/or results. Past Performance or Forward-looking scenarios based upon the reasonable beliefs of the third-party provider are not a guarantee of future performance. Actual results may differ materially from those anticipated in forward-looking or past performance statements. IC Markets makes no representation or warranty and assumes no liability as to the accuracy or completeness of the information provided, nor any loss arising from any investment based on a recommendation, forecast or any information supplied by any third-party.


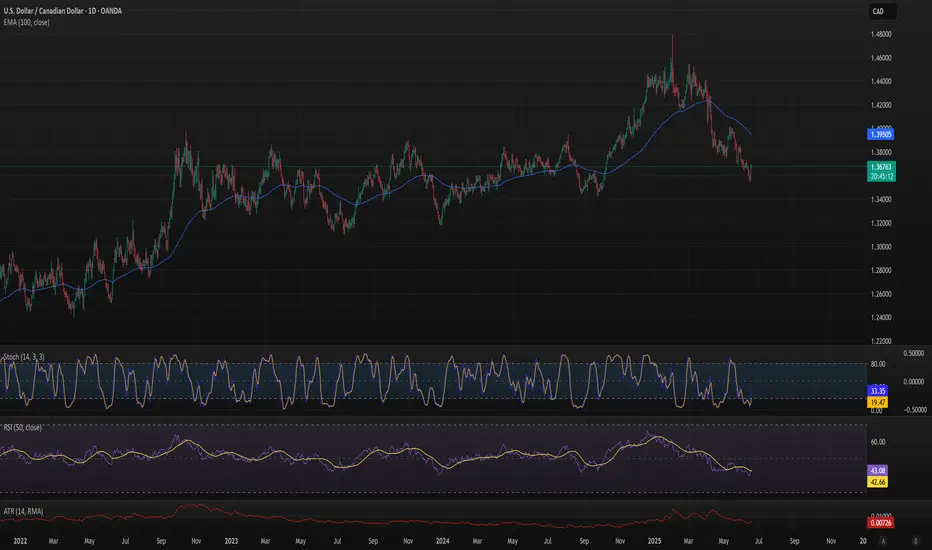
USDCAD – Bullish Reversal After Completed Wave 5 and AO DivergenAnalysis:
The USDCAD daily chart shows a textbook completion of an Elliott Wave 12345 sequence. Wave (5) has just completed, supported by clear bullish divergence on the Awesome Oscillator (AO) – a classic signal suggesting exhaustion of bearish momentum.
What strengthens the bullish reversal bias is the presence of a bullish engulfing candle at the end of Wave (5), right at a key structural low. This candle formation, combined with the divergence, provides strong evidence that a corrective wave (likely Wave A or a larger reversal) may be underway.
🔍 Key Confluences:
Wave 5 ends in a falling wedge structure.
AO shows higher low on Wave 5 compared to Wave 3 → Bullish Divergence.
Bullish engulfing candle confirms momentum shift.
Price action breaking out of the wedge pattern.
🎯 Trade Plan:
I am waiting for a pullback toward the breakout zone to find an optimal buy entry. The ideal entry would be a retest of the bullish engulfing candle low or broken wedge resistance, turning into support.
📈 Targets:
Initial short-term target: ~1.3850 (previous Wave 4 region).
Mid-term potential: ~1.4050 depending on structure development.
🛑 Invalidation:
A daily candle closing back below the low of the bullish engulfing will invalidate the bullish outlook.

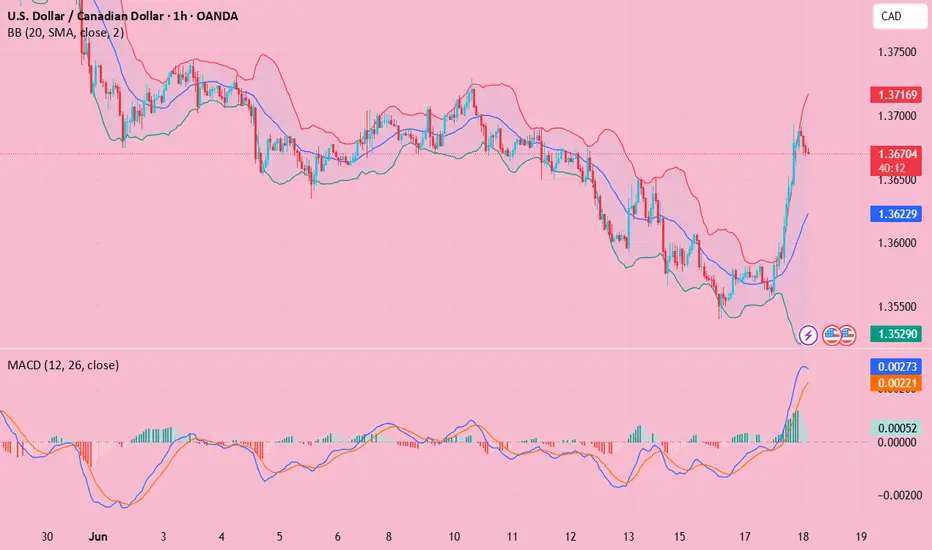
USDCAD Wave Analysis – 18 June 2025- USDCAD broke daily down channel
- Likely to rise to the resistance level at 1.3730
USDCAD currency pair recently broke the resistance trendline of the daily down channel from the start of May.
The breakout of this down channel follows the earlier upward reversal from the pivotal support level 1.3545 coinciding with the lower daily Bollinger Band.
USDCAD currency pair can be expected to rise to the next resistance level at 1.3730 (former strong support from May).

USD/cad TRADE 2 even tho i belive this to be in a down trend i still belive a reversal for next couple days is in order i would say wait for in to retrace to a higher level of interest to get in on a short but advanced traders will be waiting for the jump, i have marked the arrows to show u what i belive to happen but a engulfing pattern has already come out, i so i belive this is going to have a little bullish run to then continue on the bearish movment

USD/CAD short 4Hr Supply Zone: I believe that the trade should be triggered in the supple zone I drew out (yellow rectangle)
Market Structure: There is a good market structure formation and I believe that the price will go up to the supply zone then continue the market structure towards the downside.
Fib tool: This is also aligning close to my price trigger and the t/p
Support level: if we go back in time we can see that my t/p is put on a support level (orange dotted line).

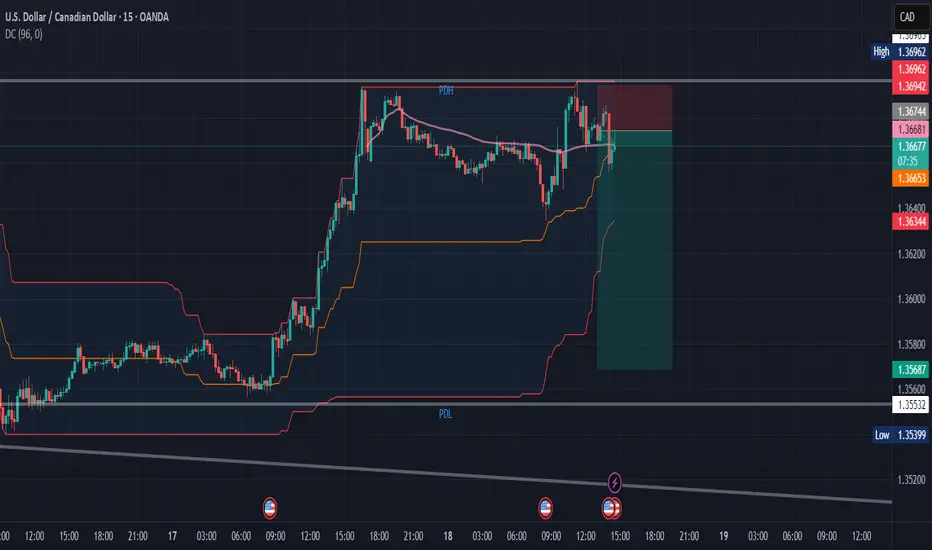
usdcad short to 1.35687stuck in a 1 day downstrend channel since early Februrary
trading at high range of PDH
PD range of 143 pips, expecting more retracement
Bearish reversal for the Loonie?USD/CAD is reacting off the resistance level which is an overlap resistance that lines up with the 50% Fibonacci retracement and could reverse from this level to our take profit.
Entry: 1.3692
Why we lik eit:
There is an overlap resistance level that lines up with the 50% Fibonacci retracement.
Stop loss: 1.3777
Why we like it:
There is a pullback resistance level that is slightly below the 78.6% Fibonacci retracement.
Take profit: 1.3552
Why we like it:
There is a pullback support level.
Enjoying your TradingView experience? Review us!
Please be advised that the information presented on TradingView is provided to Vantage (‘Vantage Global Limited’, ‘we’) by a third-party provider (‘Everest Fortune Group’). Please be reminded that you are solely responsible for the trading decisions on your account. There is a very high degree of risk involved in trading. Any information and/or content is intended entirely for research, educational and informational purposes only and does not constitute investment or consultation advice or investment strategy. The information is not tailored to the investment needs of any specific person and therefore does not involve a consideration of any of the investment objectives, financial situation or needs of any viewer that may receive it. Kindly also note that past performance is not a reliable indicator of future results. Actual results may differ materially from those anticipated in forward-looking or past performance statements. We assume no liability as to the accuracy or completeness of any of the information and/or content provided herein and the Company cannot be held responsible for any omission, mistake nor for any loss or damage including without limitation to any loss of profit which may arise from reliance on any information supplied by Everest Fortune Group.

fomc or fomo?? can trump keep rate down or will powell win? fomc or fomo??
can trump keep rate down or will powell win?
free transparent no edit no delete
🐉We value full transparency. All wins and fails fully publicized, zero edit, zero delete, zero fakes.🐉
🐉Check out our socials for some nice insights.🐉
information created and published doesn't constitute investment advice!
NOT financial advice

USD/CAD(20250618)Today's AnalysisMarket news:
World Gold Council: 95% of central banks expect gold reserves to rise in the next 12 months.
Technical analysis:
Today's buying and selling boundaries:
1.3642
Support and resistance levels:
1.3778
1.3727
1.3694
1.3590
1.3557
1.3506
Trading strategy:
If the price breaks through 1.3694, consider buying, the first target price is 1.3727
If the price breaks through 1.3642, consider selling, the first target price is 1.3590
USDCAD - Scalping in the deepHello dear scalpers, this is our next little scalping setup...
With a ratio of 1.14 ^^
I think this will be a nice position in this downtrend situation.

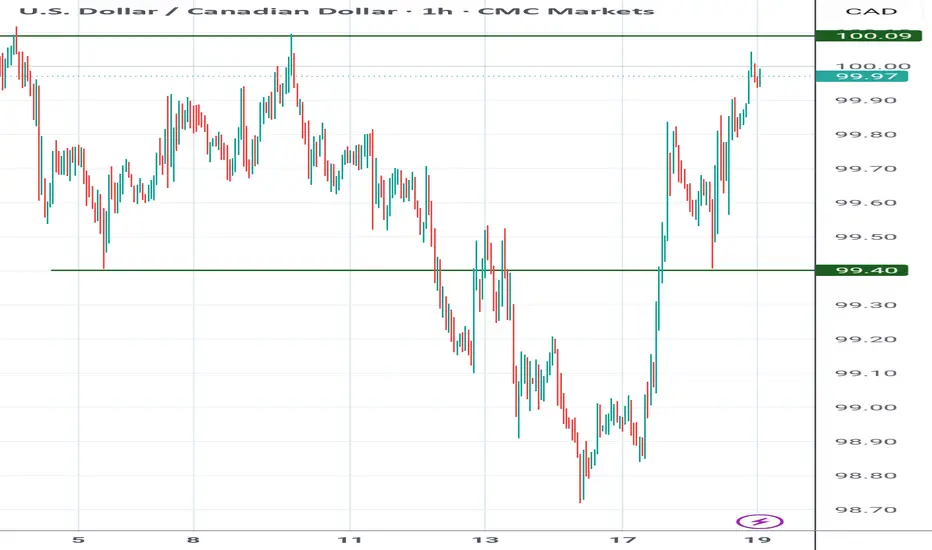
USDCAD Breakout from Parallel Channel | Bullish Move Ahead?USD/CAD has just broken out of a well-respected downward parallel channel, signaling a potential trend reversal. We saw a strong bullish impulse that pushed price above the channel resistance and now appears to be consolidating just above it.
🔍 What to Watch For:
Pullback Opportunity: Price may retest the breakout zone (~1.3640–1.3660). This zone could act as new support, providing a good entry point for buyers.
Upside Target: The next major resistance sits near 1.38542, offering a potential move of over 180+ pips from current levels.
Momentum: Bullish momentum is strong, suggesting a high probability of continuation after a healthy pullback.
📈 Bullish Bias remains intact as long as price holds above the breakout zone.
📉 If price drops back inside the channel, reevaluation of the bullish outlook will be needed.
🔔 Trade Idea: Look for long opportunities on a successful retest with confirmation (bullish candlestick or volume surge).
💬 What are your thoughts on this breakout? Are you long on USD/CAD or waiting for confirmation? Let me know in the comments! 👇

USD/CAD mid-term shift?The rise in the US Dollar Index has led to a rebound against several currencies such as the Canadian dollar, the euro, and the Japanese yen, shifting the medium-term bearish trend into a bullish one. One of the pairs that could benefit from the USD’s strength is the USD/CAD.
After the USD/CAD pair recorded a new high by breaking the last lower high, the recent pullback is considered a correction within the upward trend. The price is likely to rise from the 1.35725 level toward the 1.36567 target.
However, a drop below the 1.35397 level and a 4-hour candle closing beneath it would invalidate the bullish scenario.
Note:
This pair is trading in a general downtrend on the daily timeframe. However, the above analysis is specifically based on the 4-hour chart for the medium-to-short-term outlook.
Markets are also closely watching the Federal Reserve meeting later today, as its outcome will have a direct impact on all USD-related currency pairs.

USDCAD is Nearing The Daily Trend!!Hey Traders, in today's trading session we are monitoring USDCAD for a selling opportunity around 1.36950 zone, USDCAD is trading in a downtrend and currently is in a correction phase in which it is approaching the trend at 1.36950 support and resistance area.
Trade safe, Joe.

Bearish USD/CAD Presents a Selling Opportunity Now.FenzoFx—USD/CAD surged to 1.3686, a resistance zone backed by a bearish Fair Value Gap. Stochastic shows 81.0, signaling short-term overpricing. The market remains bearish below 1.3729, with fundamentals pointing to a stronger CAD.
A decline toward 1.362 is likely if USD/CAD stays below 1.3729.

Bearish reversal off pullback resistance?The Loonie (USD/CAD) is rising towards the pivot which is a pullback resistance that aligns with the 50% Fibonacci retracement and could reverse to the 1st support.
Pivot: 1.3706
1st Support: 1.3599
1st Resistance: 1.3793
Risk Warning:
Trading Forex and CFDs carries a high level of risk to your capital and you should only trade with money you can afford to lose. Trading Forex and CFDs may not be suitable for all investors, so please ensure that you fully understand the risks involved and seek independent advice if necessary.
Disclaimer:
The above opinions given constitute general market commentary, and do not constitute the opinion or advice of IC Markets or any form of personal or investment advice.
Any opinions, news, research, analyses, prices, other information, or links to third-party sites contained on this website are provided on an "as-is" basis, are intended only to be informative, is not an advice nor a recommendation, nor research, or a record of our trading prices, or an offer of, or solicitation for a transaction in any financial instrument and thus should not be treated as such. The information provided does not involve any specific investment objectives, financial situation and needs of any specific person who may receive it. Please be aware, that past performance is not a reliable indicator of future performance and/or results. Past Performance or Forward-looking scenarios based upon the reasonable beliefs of the third-party provider are not a guarantee of future performance. Actual results may differ materially from those anticipated in forward-looking or past performance statements. IC Markets makes no representation or warranty and assumes no liability as to the accuracy or completeness of the information provided, nor any loss arising from any investment based on a recommendation, forecast or any information supplied by any third-party.

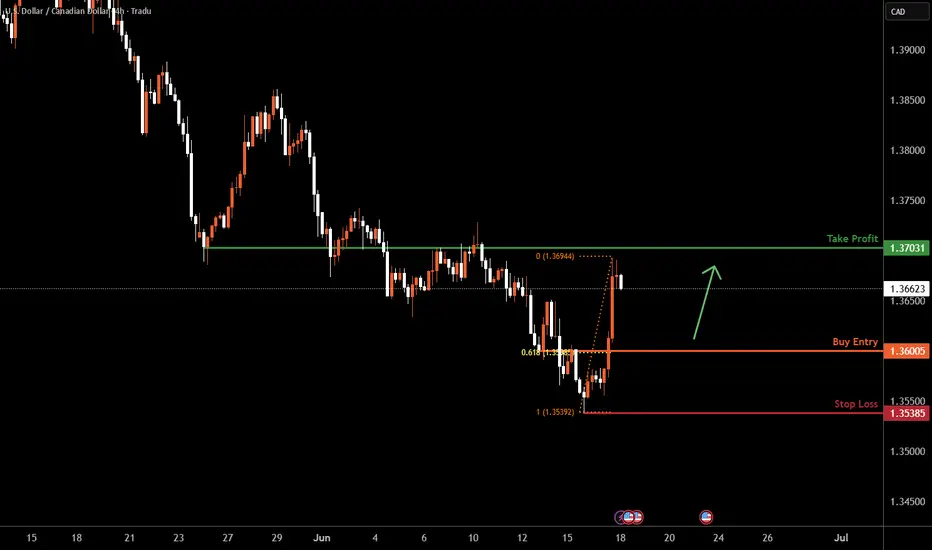
USDCAD H4 I Bullish Bounce Off the supportBased on the H4 chart analysis, the price is falling toward our buy entry level at 1.3600, a pullback support that aligns with the 61.8% Fib retracement.
Our take profit is set at 1.3703, a pullback resistance.
The stop loss is placed at 1.3500, a swing low
High Risk Investment Warning
Trading Forex/CFDs on margin carries a high level of risk and may not be suitable for all investors. Leverage can work against you.
Stratos Markets Limited (tradu.com ):
CFDs are complex instruments and come with a high risk of losing money rapidly due to leverage. 63% of retail investor accounts lose money when trading CFDs with this provider. You should consider whether you understand how CFDs work and whether you can afford to take the high risk of losing your money.
Stratos Europe Ltd (tradu.com ):
CFDs are complex instruments and come with a high risk of losing money rapidly due to leverage. 63% of retail investor accounts lose money when trading CFDs with this provider. You should consider whether you understand how CFDs work and whether you can afford to take the high risk of losing your money.
Stratos Global LLC (tradu.com ):
Losses can exceed deposits.
Please be advised that the information presented on TradingView is provided to Tradu (‘Company’, ‘we’) by a third-party provider (‘TFA Global Pte Ltd’). Please be reminded that you are solely responsible for the trading decisions on your account. There is a very high degree of risk involved in trading. Any information and/or content is intended entirely for research, educational and informational purposes only and does not constitute investment or consultation advice or investment strategy. The information is not tailored to the investment needs of any specific person and therefore does not involve a consideration of any of the investment objectives, financial situation or needs of any viewer that may receive it. Kindly also note that past performance is not a reliable indicator of future results. Actual results may differ materially from those anticipated in forward-looking or past performance statements. We assume no liability as to the accuracy or completeness of any of the information and/or content provided herein and the Company cannot be held responsible for any omission, mistake nor for any loss or damage including without limitation to any loss of profit which may arise from reliance on any information supplied by TFA Global Pte Ltd.
The speaker(s) is neither an employee, agent nor representative of Tradu and is therefore acting independently. The opinions given are their own, constitute general market commentary, and do not constitute the opinion or advice of Tradu or any form of personal or investment advice. Tradu neither endorses nor guarantees offerings of third-party speakers, nor is Tradu responsible for the content, veracity or opinions of third-party speakers, presenters or participants.
USD/CAD Faces Rejection at 1.3692 – Downside Risk Toward 1.3597
USD/CAD was rejected at the key resistance zone between 1.36670 and 1.36928, and has since begun pulling back. This reaction comes as price remains within a broader descending channel.
If the bearish momentum continues, the next levels to watch on the downside are 1.36347, followed by 1.35970. A break below those could open the path toward the major support at 1.35402.
🔻 Rejection Zone: 1.36670 – 1.36928
🔻 Support 1: 1.36347
🔻 Support 2: 1.35970
🔻 Support 3: 1.35402
🔻 Trend: Bearish within descending channel
🔻 Timeframe: 4H
This is a technical idea only – not financial advice.

USD/CAD: Signs of a bottom as bulls fight backTuesday’s bullish move in USD/CAD has delivered a signal often seen at bottoms, taking out several key technical resistance levels in the process, including the December 2023 uptrend. With bearish momentum starting to reverse, upside risks look to be building.
Those in the market for a long setup could initiate positions around these levels with a stop beneath 1.3650 for protection. Tuesday’s high of 1.3693 now stands as an important near-term level. A break above opens the door to the June 10 high at 1.3728 as one potential target, along with 1.3750.
If either level is hit, reevaluate whether to hold, cut or reverse, given the setup runs counter to the broader trend.
Good luck!
DS

USDCAD SHORT IDEA- USDCAD Is EXTREMELY WEAK AND READY FOR SELLOANDA:USDCAD USDCAD Is extremely weak I expect price to drop hard from here.
TRADE BREAKDOWN
Weekly Trend is Bearish.
Daily Trend is Bearish.
4H Trend is also Bearish.
This is 100% a trend following strategy trade.
The entry is taken on 4H time frame targeting the recent weekly swing low.
This is a 4RR Trade.

USDCAD - Strong SellStrong Sell under 200 moving average and 100 moving average. OIL prices will rise due to middle east conflict. Which will increase the price of CAD expecting around .74 cents or higher with full support.