USDCAD SHORT FORECAST Q2 W21 D20 Y25USDCAD SHORT FORECAST Q2 W21 D20 Y25
Professional Risk Managers👋
Welcome back to another FRGNT chart update📈
Diving into some Forex setups using predominantly higher time frame order blocks alongside confirmation breaks of structure.
Let’s see what price action is telling us today!
💡Here are some trade confluences📝
✅Intraday breaks of structure
✅Tokyo ranges to be filled
✅15' order block identified
✅Weekly 50 EMA
✅Daily 50 EMA
🔑 Remember, to participate in trading comes always with a degree of risk, therefore as professional risk managers it remains vital that we stick to our risk management plan as well as our trading strategies.
📈The rest, we leave to the balance of probabilities.
💡Fail to plan. Plan to fail.
🏆It has always been that simple.
❤️Good luck with your trading journey, I shall see you at the very top.
🎯Trade consistent, FRGNT X
CADUSD trade ideas

USD/CAD H4 | Overlap support at 50% Fibonacci retracementUSD/CAD is falling towards an overlap support and could potentially bounce off this level to climb higher.
Buy entry is at 1.3894 which is an overlap support that aligns with the 50.0% Fibonacci retracement.
Stop loss is at 1.3840 which is a level that lies underneath a pullback support and the 61.8% Fibonacci retracement.
Take profit is at 1.4004 which is a multi-swing-high resistance that aligns close to the 50.0% Fibonacci retracement.
High Risk Investment Warning
Trading Forex/CFDs on margin carries a high level of risk and may not be suitable for all investors. Leverage can work against you.
Stratos Markets Limited (tradu.com):
CFDs are complex instruments and come with a high risk of losing money rapidly due to leverage. 63% of retail investor accounts lose money when trading CFDs with this provider. You should consider whether you understand how CFDs work and whether you can afford to take the high risk of losing your money.
Stratos Europe Ltd (tradu.com):
CFDs are complex instruments and come with a high risk of losing money rapidly due to leverage. 63% of retail investor accounts lose money when trading CFDs with this provider. You should consider whether you understand how CFDs work and whether you can afford to take the high risk of losing your money.
Stratos Global LLC (tradu.com):
Losses can exceed deposits.
Please be advised that the information presented on TradingView is provided to Tradu (‘Company’, ‘we’) by a third-party provider (‘TFA Global Pte Ltd’). Please be reminded that you are solely responsible for the trading decisions on your account. There is a very high degree of risk involved in trading. Any information and/or content is intended entirely for research, educational and informational purposes only and does not constitute investment or consultation advice or investment strategy. The information is not tailored to the investment needs of any specific person and therefore does not involve a consideration of any of the investment objectives, financial situation or needs of any viewer that may receive it. Kindly also note that past performance is not a reliable indicator of future results. Actual results may differ materially from those anticipated in forward-looking or past performance statements. We assume no liability as to the accuracy or completeness of any of the information and/or content provided herein and the Company cannot be held responsible for any omission, mistake nor for any loss or damage including without limitation to any loss of profit which may arise from reliance on any information supplied by TFA Global Pte Ltd.
The speaker(s) is neither an employee, agent nor representative of Tradu and is therefore acting independently. The opinions given are their own, constitute general market commentary, and do not constitute the opinion or advice of Tradu or any form of personal or investment advice. Tradu neither endorses nor guarantees offerings of third-party speakers, nor is Tradu responsible for the content, veracity or opinions of third-party speakers, presenters or participants.

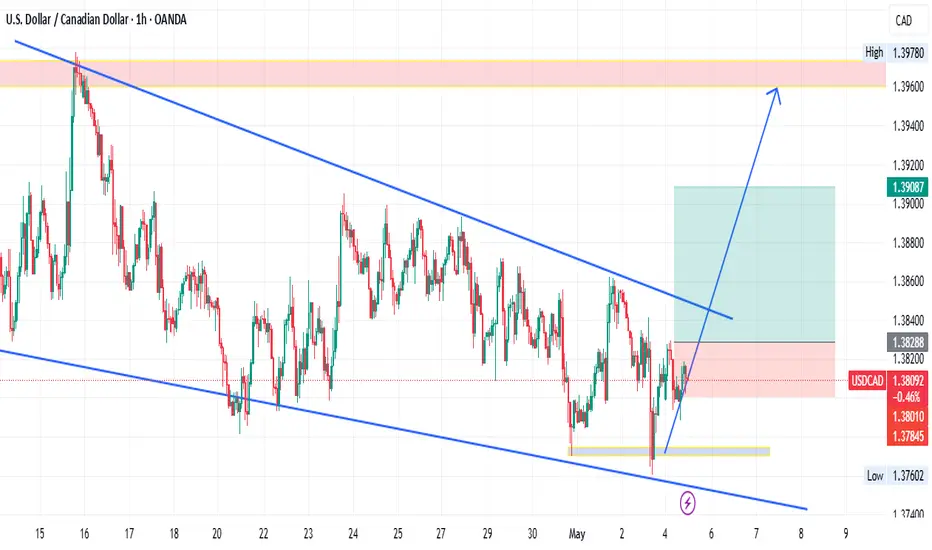
USDCAD H1 SUPPLY WITH LIQUIDITYUSDCAD H1 SUPPLY WITH LIQUIDITY , in LTF after MSS then enter with proper sl with targer then book partially target .
KGB Priyabrat Behera
ICT & Advance Mapping SMC Trader

USDCAD AnalysisUSDCAD is currently in a bullish trend, with the overall momentum favoring buyers. The pair has broken and successfully retested the weekly high, indicating strong bullish continuation. A clear break and close above the key level at 1.39753 would serve as a solid confirmation to enter long positions, targeting further upside potential.

USD/CAD Coiled for Breakout Ahead of Canada CPIThe USD/CAD rally failed into confluent uptrend resistance at the 200-day moving average last week with price breaking below the median-line today in early U.S. trade- threat for a deeper set-back here towards the 2022 high close / 2023 high at 1.3881/99 and the 61.8% retracement at 1.3852.
Losses would need to be limited to this slope IF price is heading higher on this stretch with a close above the 200DMA (currently ~1.4016) needed to fuel the next leg of the advance. Keep in mind we have Canada CPI on tap tomorrow.
-MB

Market Insights with Gary Thomson: 19 - 23 MayMarket Insights with Gary Thomson: RBA Rate Decision, Canada & UK Inflation Rate, Earnings Reports
In this video, we’ll explore the key economic events, market trends, and corporate news shaping the financial landscape. Get ready for expert insights into forex, commodities, and stocks to help you navigate the week ahead. Let’s dive in!
In this episode, we discuss:
— RBA’s Interest Rate Decision
— Inflation Rate in Canada
— Inflation Rate in the UK
— Corporate Earnings Statements
Don’t miss out—gain insights to stay ahead in your trading journey.
This video represents the opinion of the Companies operating under the FXOpen brand only. It is not to be construed as an offer, solicitation, or recommendation with respect to products and services provided by the Companies operating under the FXOpen brand, nor is it to be considered financial advice.

Short Signal In the USDCAD currency pair, there is a short trading position behind the liquidity.
You can enter a short position while adhering to proper position sizing and risk management suitable for your account.

USDCAD BUY STOPHaven't been checking the chats in a while. There was a double bottom set up forming on the H4 chat. I missed the initially sniper entry but i'm hoping to catch the rest of the formation of the pattern. This is not a signal but an anticipation.
THIS PAIR COULD REACH TO 1.4250Dear traders, as you may notice, following my previous analysis on this pair, the bullish impulse is about to continue after some consolidations inside the bullish pennant. By the decisive breakout of the pennant, the pair could immediately rise toward 1.4030 and then in a longer term toward 1.4250. Let's See!
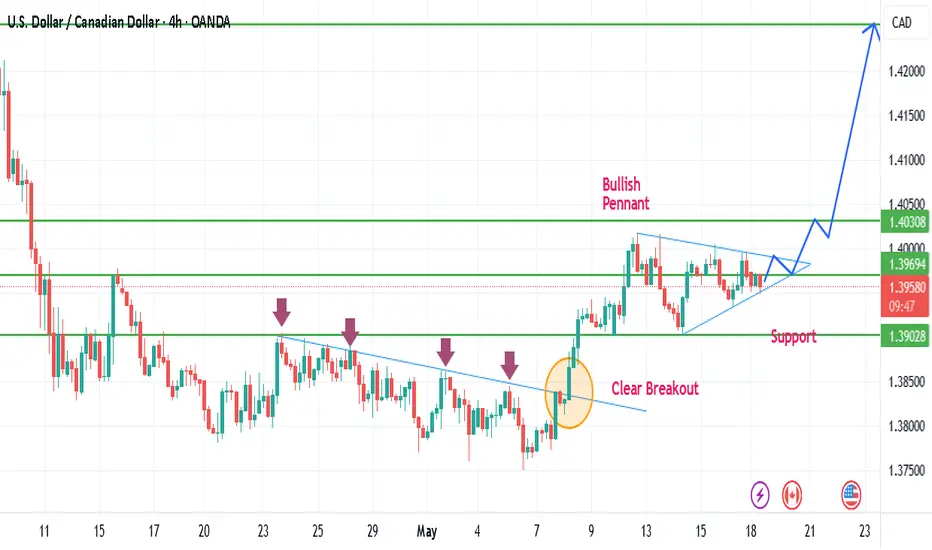
Uptrend It is expected that after some fluctuation and correction, the upward trend will continue and the price will be able to break through the resistance range and the resistance trend line.

Bearish reversal off pullback resistance?The Loonie (USD/CAD) is rising towards the pivot which aligns with the 38.2% Fibonacci retracement and could reverse to the 1st support which acts as a pullback support.
Pivot: 1.4085
1st Support: 1.3766
1st Resistance: 1.4262
Risk Warning:
Trading Forex and CFDs carries a high level of risk to your capital and you should only trade with money you can afford to lose. Trading Forex and CFDs may not be suitable for all investors, so please ensure that you fully understand the risks involved and seek independent advice if necessary.
Disclaimer:
The above opinions given constitute general market commentary, and do not constitute the opinion or advice of IC Markets or any form of personal or investment advice.
Any opinions, news, research, analyses, prices, other information, or links to third-party sites contained on this website are provided on an "as-is" basis, are intended only to be informative, is not an advice nor a recommendation, nor research, or a record of our trading prices, or an offer of, or solicitation for a transaction in any financial instrument and thus should not be treated as such. The information provided does not involve any specific investment objectives, financial situation and needs of any specific person who may receive it. Please be aware, that past performance is not a reliable indicator of future performance and/or results. Past Performance or Forward-looking scenarios based upon the reasonable beliefs of the third-party provider are not a guarantee of future performance. Actual results may differ materially from those anticipated in forward-looking or past performance statements. IC Markets makes no representation or warranty and assumes no liability as to the accuracy or completeness of the information provided, nor any loss arising from any investment based on a recommendation, forecast or any information supplied by any third-party.

USDCAD H4 I Bullish Bounce Off the 50% FiboBased on the H4 chart analysis, the price is falling toward our buy entry level at 1.3894, a pullback support that aligns close to the 50% Fibonacci retracement.
Our take profit is set at 1.4024, a pullback resistance.
The stop loss is placed at 1.3830, below the 61.8% Fibonacci retracement.
High Risk Investment Warning
Trading Forex/CFDs on margin carries a high level of risk and may not be suitable for all investors. Leverage can work against you.
Stratos Markets Limited (tradu.com):
CFDs are complex instruments and come with a high risk of losing money rapidly due to leverage. 63% of retail investor accounts lose money when trading CFDs with this provider. You should consider whether you understand how CFDs work and whether you can afford to take the high risk of losing your money.
Stratos Europe Ltd (tradu.com):
CFDs are complex instruments and come with a high risk of losing money rapidly due to leverage. 63% of retail investor accounts lose money when trading CFDs with this provider. You should consider whether you understand how CFDs work and whether you can afford to take the high risk of losing your money.
Stratos Global LLC (tradu.com):
Losses can exceed deposits.
Please be advised that the information presented on TradingView is provided to Tradu (‘Company’, ‘we’) by a third-party provider (‘TFA Global Pte Ltd’). Please be reminded that you are solely responsible for the trading decisions on your account. There is a very high degree of risk involved in trading. Any information and/or content is intended entirely for research, educational and informational purposes only and does not constitute investment or consultation advice or investment strategy. The information is not tailored to the investment needs of any specific person and therefore does not involve a consideration of any of the investment objectives, financial situation or needs of any viewer that may receive it. Kindly also note that past performance is not a reliable indicator of future results. Actual results may differ materially from those anticipated in forward-looking or past performance statements. We assume no liability as to the accuracy or completeness of any of the information and/or content provided herein and the Company cannot be held responsible for any omission, mistake nor for any loss or damage including without limitation to any loss of profit which may arise from reliance on any information supplied by TFA Global Pte Ltd.
The speaker(s) is neither an employee, agent nor representative of Tradu and is therefore acting independently. The opinions given are their own, constitute general market commentary, and do not constitute the opinion or advice of Tradu or any form of personal or investment advice. Tradu neither endorses nor guarantees offerings of third-party speakers, nor is Tradu responsible for the content, veracity or opinions of third-party speakers, presenters or participants.

USDCAD Bullish Continuation PatternStill in this trade, I entered about 1.5 weeks ago based on the weekly bullish trendline. Now on the lower timeframes ( 4hr, 1hr, 30m ) we can see a nice pattern formation being formed. I believe it will continue bullish based on the weekly trendline confluence.

Usdcad long 40 pipsLooking at longs for USDCAD I believe it’s gonna be a easy trade to the most recent swing high

USD-CAD Risky Short! Sell!
Hello,Traders!
USD-CAD is trading beneath
A wide strong horizontal
Resistance level around 1.4027
So after the retest we will
Be expecting a local
Bearish pullback and
A move down
Sell!
Comment and subscribe to help us grow!
Check out other forecasts below too!
Disclosure: I am part of Trade Nation's Influencer program and receive a monthly fee for using their TradingView charts in my analysis.

Bullish momentum to extend?USD/CAD is falling towards the support level which is an overlap support that lines up with the 50% Fibonacci retracement and could bounce from this level to our take profit.
Entry: 1.3893
Why we like it:
There is an overlap support level that lines up with the 50% Fibonacci retracement.
Stop loss: 1.3837
Why we like it:
There is a pullback support that aligns with the 61.8% Fibonacci retracement.
Take profit: 1.4061
Why we like it:
There is a pullback resistance level that aligns with the 61.8% Fibonacci retracement.
Enjoying your TradingView experience? Review us!
Please be advised that the information presented on TradingView is provided to Vantage (‘Vantage Global Limited’, ‘we’) by a third-party provider (‘Everest Fortune Group’). Please be reminded that you are solely responsible for the trading decisions on your account. There is a very high degree of risk involved in trading. Any information and/or content is intended entirely for research, educational and informational purposes only and does not constitute investment or consultation advice or investment strategy. The information is not tailored to the investment needs of any specific person and therefore does not involve a consideration of any of the investment objectives, financial situation or needs of any viewer that may receive it. Kindly also note that past performance is not a reliable indicator of future results. Actual results may differ materially from those anticipated in forward-looking or past performance statements. We assume no liability as to the accuracy or completeness of any of the information and/or content provided herein and the Company cannot be held responsible for any omission, mistake nor for any loss or damage including without limitation to any loss of profit which may arise from reliance on any information supplied by Everest Fortune Group.

"USD/CAD Comprehensive Analysis: Fundamental, Technical, & Risk" 📘 1. Fundamental Analysis
From a fundamental perspective, the current movement of USD/CAD is still influenced by the strength of the US Dollar which remains solid, especially due to expectations that the Federal Reserve will maintain high interest rates for a longer period. The US Dollar is supported by relatively stable US economic data and has not provided a strong reason for the Fed to loosen monetary policy quickly. On the other hand, the Canadian Dollar is still weak due to the decline in crude oil prices—Canada's main export commodity—which has put pressure on the CAD. With this condition, the USD remains superior to the CAD in the short term. However, the market is also waiting for important catalysts from the release of Canadian inflation data and speeches by Fed officials next week. As long as the DXY (US Dollar Index) remains stable above 104.50 and there is no significant spike in oil prices, the upward pressure on USD/CAD is expected to continue.
2. Technical Analysis
Technically, USD/CAD is in a strong uptrend, marked by a "higher high and higher low" structure on the 4-hour timeframe. The price has broken through the resistance of 1.3925 and is now moving in the area of 1.39650. The MACD indicator shows a positive histogram that is still widening, while the RSI is in the range of 69—indicating strong bullish momentum but starting to approach overbought. ADX reaching 31 strengthens the signal that the current trend is quite solid and worth following. On the 1 hour and 15 minute timeframes, it can be seen that the price is making a minor retest after the breakout with a healthy pullback pattern. There are no signs of a significant reversal, and volume remains maintained. With this structure, the buy on pullback setup is considered the optimal scenario, with the ideal entry zone at 1.3935–1.3945.
3. Risk Management
In the risk management framework, a long position in the 1.3935–1.3945 zone has a very good risk-to-reward ratio of around 1:2.57 with the first profit target at 1.4200 and the follow-up target at 1.4050. Stop loss is placed safely below the minor support area at 1.3832 to avoid whipsaws from market noise. The probability of success based on the history of similar setups and current indicator conditions is around 79%, with a strategy confidence level above 85%. However, traders are advised to wait for confirmation in the form of a bullish candle and volume spike when the price enters the pullback zone, in order to avoid premature entry. Positions should not be executed if the DXY shows a strong bearish reversal, or if the price of WTI crude oil spikes sharply, as it could suddenly strengthen the CAD.

USDCAD SHORT FORECAST Q2 W21 Y25 W&D 50EMA, Ooooh Soo Powerful !USDCAD SHORT FORECAST Q2 W21 Y25
USDCAD SHORT FORECAST Q2 W21 Y25 W&D 50EMA, Ooooh Soo Powerful !
Professional Risk Managers👋
Welcome back to another FRGNT chart update📈
Diving into some Forex setups using predominantly higher time frame order blocks alongside confirmation breaks of structure.
Let’s see what price action is telling us today!
💡Here are some trade confluences📝
✅Intraday breaks of structure
✅Tokyo ranges to be filled
✅15' order block identified
✅Weekly 50 EMA
✅Daily 50 EMA
🔑 Remember, to participate in trading comes always with a degree of risk, therefore as professional risk managers it remains vital that we stick to our risk management plan as well as our trading strategies.
📈The rest, we leave to the balance of probabilities.
💡Fail to plan. Plan to fail.
🏆It has always been that simple.
❤️Good luck with your trading journey, I shall see you at the very top.
🎯Trade consistent, FRGNT X

USD/CAD: The US Dollar in a Trap! Ready for a Rebound?Technical Overview:
The monthly chart of USD/CAD shows a weakening phase of the US dollar against the Canadian dollar. Currently, the price is located at a key support zone around 1.3800. The RSI suggests a potential technical rebound, but the bearish structure remains intact until the resistance at 1.4000 is broken.
Seasonality:
According to seasonal trend data, the month of May historically shows a slightly positive trend for USD/CAD:
20 years: +0.0017
15 years: -0.0027
10 years: +0.0014
5 years: +0.0039
2 years: -0.0020
This trend highlights a historical short-term weakness (2 years), while over longer periods, the movement is marginally positive.
COT Report:
COT data shows an increase in long positions on the dollar (+2,158 contracts), while short positions also increased (+2,817 contracts). This suggests uncertainty among institutional traders, with a slight inclination towards short positions.
Market Sentiment:
Data indicates that 65% of retail traders are short on USD/CAD, while only 35% are long. This could signal a potential squeeze if the price breaks above resistance levels.
Operational Conclusion:
Considering the bearish pressure and technical structure, a prudent strategy could include:
Long Entry: Above 1.4000 with confirmation on lower timeframes.
Stop Loss: Below 1.3800 to minimize exposure to false breakouts.
Primary Target: 1.4200, then 1.4400.
Alternative Strategy: If the price rejects the 1.4000 resistance, consider shorting towards 1.3700.

USDCAD Key Levels in SightUSDCAD is mirroring the DXY’s broader trend — rebounding off oversold momentum levels last seen in 2021 and facing resistance due to softer US economic data.
• Bullish scenario: A break and hold above 1.4020 may open the way for gains toward 1.4080, 1.4150, and 1.4270.
• Bearish scenario: A decisive break below 1.3930 could trigger further downside toward 1.3830, 1.3750, and 1.3600.
Key Events to watch for next week:
- Canadian CPI on Tuesday
- Canadian Retail Sales on Friday
- US Trade Deal Developments
Written by Razan Hilal,CMT

USD/CAD(20250516)Today's AnalysisMarket news:
Fed Chairman Powell: The Fed is adjusting its overall policy-making framework. Zero interest rate is no longer a basic situation. The wording of underemployment and average inflation rate needs to be reconsidered. PCE is expected to drop to 2.2% in April.
Technical analysis:
Today's buying and selling boundaries:
1.3972
Support and resistance levels:
1.4020
1.4002
1.3990
1.3953
1.3941
1.3923
Trading strategy:
If the price breaks through 1.3972, consider buying, the first target price is 1.3990
If the price breaks through 1.3953, consider selling, the first target price is 1.3941

OUTLOOK ON USDCADUSDCAD broke proper structure on daily timeframe , showing us its change of character and we will be looking for sells from the OB that caused the impulsive move to the downside.
currently looking at a sell on USDCAD , but further confirmation is needed before I take the trade.

USDCAD (BOS 4H + Demand + OTE)Hello Traders!
We have BOS on 4H, in OTE zone - unmitigated Demand and OB. After closing IMB we can expect reversal. Demand can be also liquidity, because it is a reason to mitigate our OB.
Set alarms and wait for confirmation on LTF!
PS. Price must build liquidity to our POI, not impulse.
TP - new HH.
Have a profitable day and don't forget to subscribe for updates!
