USD/CAD Recovery Faces First TestPrice marked an outside-weekly reversal off key support last week with USD/CAD rallying more than 1.9% off the lows. The advance is now testing initial resistance hurdles at 1.3962/97 - a region defined by the 52-week moving average, the 2022 swing high, and the 23.6% retracement of the yearly range.
The immediate focus is on a reaction off this mark with key resistance eyed just higher at the 38.2% retracement near 1.4150 . Note that the March channel line converges on this threshold over the next few weeks and a breach / close above would be needed to suggest a more significant low as registered last week / a larger trend reversal is underway. Subsequent resistance objectives seen at the high-week close (HWC) at 1.4292 and the 2025 yearly open at 1.4383 .
Initial weekly support rests at the 1.39 -hande with key support unchanged at 1.3729/95 - a region defined by the 38.2% retracement of the 2021 advance and the 61.8% retracement of the late-2023 advance. A break / weekly close below this pivot zone would threaten another bout of accelerated declines with initial support objectives seen at 1.618% extension of the February decline / 78.6% retracement at 1.3504/23 .
Bottom line: USD/CAD has responded to confluent uptrend support with the recovery now testing initial resistance- risk for possible price inflection here. From a trading standpoint, losses should be limited to the 1.39-handle IF price is heading higher on this stretch with a close above this pivo zone needed to fuel the next leg of the advance. Watch the weekly closes for guidance here.
-MB
CADUSD trade ideas

USDCAD Monthly Trendline HitUSDCAD has hit the monthly bullish trendline as well as support area for confluence. I will be keeping an eye on this on the LTF to manage my position.

USD/CAD SHORT FROM RESISTANCE
USD/CAD SIGNAL
Trade Direction: short
Entry Level: 1.398
Target Level: 1.366
Stop Loss: 1.420
RISK PROFILE
Risk level: medium
Suggested risk: 1%
Timeframe: 1D
Disclosure: I am part of Trade Nation's Influencer program and receive a monthly fee for using their TradingView charts in my analysis.
✅LIKE AND COMMENT MY IDEAS✅

USDCAD Analysis⚠️ Market shift alert!
Due to the new trade agreements with China, the USD may strengthen 💪
Our previous short idea from this level was invalidated as price broke without a signal ❌
Now we’re waiting for a pullback to go long from the new support zone 📈
For detailed entry points, trade management, and high-probability setups, follow the channel:
ForexCSP

USDCAD BUY TRADE PLAN🔥 USD/CAD TRADE PLAN 🔥
📅 Date: May 12, 2025
📋 TRADE PLAN OVERVIEW:
Item Value
Type Swing Trade
Direction Buy
Confidence ⭐⭐⭐⭐✨ (88%)
Risk:Reward 3.7:1
Status Waiting for retrace trigger
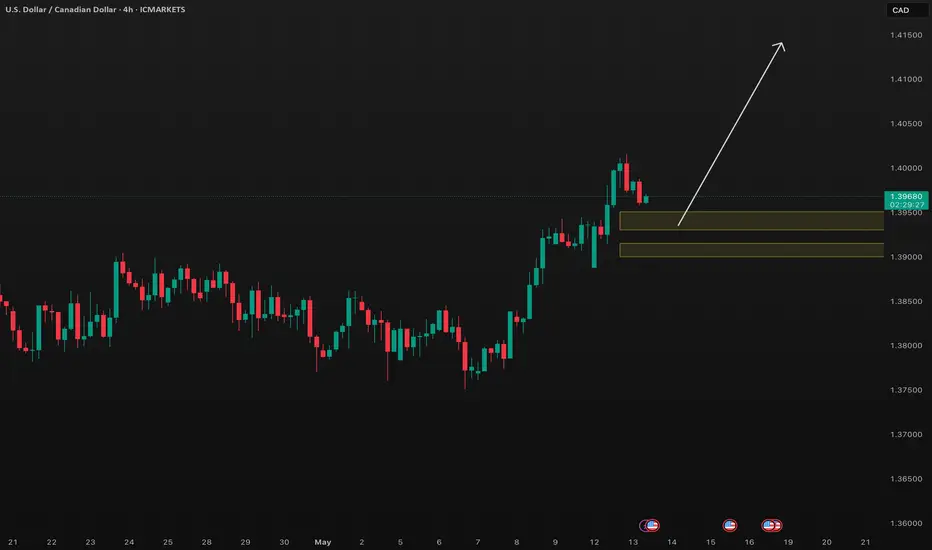
Guidance Fresh D1-H4 bullish breakout of consolidation range. Ideal setup: pullback into OB + FVG at 1.3930–1.3950 for long continuation.
📈 MARKET BIAS & TRADE TYPE:
Section Details
Bias Bullish 📈
Trade Type Breakout-Pullback Entry
🔰 CONFIDENCE LEVEL: ⭐⭐⭐⭐✨ – 88%
Confluence Factors:
* D1 Breakout from Double-Bottom Base: 25%
* H4 Strong Bullish Structure + Volume: 20%
* FVG & Demand Block Below Current Price: 18%
* USD Strength (macro tailwinds): 10%
* Crude Oil Pressure → CAD Weakness: 10%
* No bearish divergences on RSI/MACD: 5%
📍 ENTRY ZONES:
Zone Type Price Range Justification
🟩 Primary Buy Zone 1.3930–1.3950 H1-H4 demand zone (OB + FVG overlap)
🟨 Secondary Zone 1.3900–1.3915 Deeper pullback; 61.8% retrace + prior HL
❗ STOP LOSS
📍 SL = 1.3890
* Below secondary OB and structural invalidation
* 1.5x ATR (H1) protection buffer
🎯 TAKE PROFITS
TP Target Details
TP1 1.4030 Intraday liquidity high + minor resistance
TP2 1.4085 H4 clean swing top level
TP3 1.4150 March confluence resistance (D1 FVG gap close)
📏 RISK:REWARD
* TP1: ~2.0:1
* TP2: ~3.7:1
* TP3: ~5.2:1
✅ Excellent multi-tier scaling potential
🧠 MANAGEMENT STRATEGY
* Risk: 0.75%–1.0% depending on confirmation
* Move SL to BE after TP1 hit
* 50% close @ TP1, 30% @ TP2, 20% trailing toward TP3
* Full exit if H1 closes below 1.3890
⚠️ CONFIRMATION CRITERIA
✅ Wait for:
* Rejection wick / bullish engulfing from 1.3930–1.3950
* No entry if price consolidates sideways or rallies without retest
* Optional add-on: M15 demand confirmation (LTF liquidity sweep + flip)
⏳ VALIDITY
Trade Scope Duration Expiry Condition
Swing 48–96 hrs Invalid if price closes below 1.3890
❌ INVALIDATION
* Breakdown below 1.3890 (structure breach)
* DXY sharp reversal or risk-off fading
* CAD strength return via oil or BoC commentary
🌐 FUNDAMENTAL CONTEXT
Macro Driver Status
USD Strength Intact – Fed tone + inflation firm
CAD Weakness Oil soft, BoC neutral
Risk Sentiment Mildly risk-on (neutral to bullish bias)
Cross Support USDCAD, USDJPY, USDCHF all bullish
📊 Sentiment Score: +8.1 / 10
📋 FINAL TRADE SUMMARY
USDCAD has executed a clean structural breakout on H4/D1, signaling trend transition. With macro USD support and weakening CAD fundamentals, a pullback into demand at 1.3930–1.3950 will offer an elite continuation long with tight structure and high reward-to-risk.
USDCAD Analysis: Three Bounce ScenariosHello traders!
USDCAD is offering three trading scenarios on the daily timeframe.
The first scenario suggests the pair may react bullishly from the currently approached zone, setting up a bounce opportunity that could drive price higher toward the 1.41600 area.
The second scenario anticipates a bounce toward the 1.37586 region, where a mean reversion setup may come into play (if buyers step in and price action confirms bullish intent near that support).
The third scenario anticipates a bounce toward the 1.34150 region, where a mean reversion setup may come into play (if buyers step in and price action confirms bullish intent near that support).
Discretionary Trading: Where Experience Becomes the Edge
Discretionary trading is all about making decisions based on what you see, what you feel, and what you've learned through experience. Unlike systematic strategies that rely on fixed rules or algorithms, discretionary traders use their judgment to read the market in real time. It's a skill that can't be rushed, because it's built on screen time, pattern recognition, and the ability to stay calm under pressure.
There's no shortcut here. You need to see enough market conditions, wins, and losses to build that intuition—the kind that tells you when to pull the trigger or sit on your hands. Charts might look the same, but context changes everything, and that's something only experience can teach you.
At the end of the day, discretionary trading is an art, refined over time, sharpened through mistakes, and driven by instinct. It's not for everyone, but for those who've put in the work, it can be a powerful way to trade.

Bullish bounce off 38.2% Fibonacci support?The Loonie (USD/CAD) is falling towards the pivot and could bounce to the 1st resistance, which has been identified as a pullback resistance.
Pivot: 1.3904
1st Support: 1.3840
1st Resistance: 1.4063
Risk Warning:
Trading Forex and CFDs carries a high level of risk to your capital and you should only trade with money you can afford to lose. Trading Forex and CFDs may not be suitable for all investors, so please ensure that you fully understand the risks involved and seek independent advice if necessary.
Disclaimer:
The above opinions given constitute general market commentary, and do not constitute the opinion or advice of IC Markets or any form of personal or investment advice.
Any opinions, news, research, analyses, prices, other information, or links to third-party sites contained on this website are provided on an "as-is" basis, are intended only to be informative, is not an advice nor a recommendation, nor research, or a record of our trading prices, or an offer of, or solicitation for a transaction in any financial instrument and thus should not be treated as such. The information provided does not involve any specific investment objectives, financial situation and needs of any specific person who may receive it. Please be aware, that past performance is not a reliable indicator of future performance and/or results. Past Performance or Forward-looking scenarios based upon the reasonable beliefs of the third-party provider are not a guarantee of future performance. Actual results may differ materially from those anticipated in forward-looking or past performance statements. IC Markets makes no representation or warranty and assumes no liability as to the accuracy or completeness of the information provided, nor any loss arising from any investment based on a recommendation, forecast or any information supplied by any third-party.


USDCAD Long
USDCAD is now net long on the regression break.
I am considering my options on all pairs and the EA's to use.

USDCAD 1W is BullishThe pair has reacted to the bottom of its ascending channel, and with a positive hidden divergence alongside the weekly candlestick, an uptrend can be envisaged.
enjoy :)

Bearish reversal off pullback resistance?USD/CAD is rising towards the resistance level, which is a pullback resistance that lines up with the 61.8% Fibonacci retracement and could reverse from this level to our take profit.
Entry: 1.4060
Why we like it:
There is a pullback resistance level that lines up with the 61.8% Fibonacci retracement.
Stop loss: 1.4163
Why we like it:
There is a pullback resistance level that lines up with the 78.6% Fibonacci retracement.
Take profit: 1.3904
Why we like it:
There is a pullback support level.
Enjoying your TradingView experience? Review us!
Please be advised that the information presented on TradingView is provided to Vantage (‘Vantage Global Limited’, ‘we’) by a third-party provider (‘Everest Fortune Group’). Please be reminded that you are solely responsible for the trading decisions on your account. There is a very high degree of risk involved in trading. Any information and/or content is intended entirely for research, educational and informational purposes only and does not constitute investment or consultation advice or investment strategy. The information is not tailored to the investment needs of any specific person and therefore does not involve a consideration of any of the investment objectives, financial situation or needs of any viewer that may receive it. Kindly also note that past performance is not a reliable indicator of future results. Actual results may differ materially from those anticipated in forward-looking or past performance statements. We assume no liability as to the accuracy or completeness of any of the information and/or content provided herein and the Company cannot be held responsible for any omission, mistake nor for any loss or damage including without limitation to any loss of profit which may arise from reliance on any information supplied by Everest Fortune Group.

USDCAD 1 MIN Chart Sell TrendHello,
I’m like a ghost, I come every so and so. Ready for some free trades?
USDCAD 1 MIN chart is showing a sell trend.
Please use risk management as sometimes they trends keep going up or down until they go with the trade.
I will advise you at the comments below when to close the trades.
So please follow for any notifications.
Thanks,
P.S… Should I start a trading community within TradingView? What’s your thoughts?

USDCAD: Short Trade Explained
USDCAD
- Classic bearish formation
- Our team expects fall
SUGGESTED TRADE:
Swing Trade
Sell USDCAD
Entry Level - 1.3979
Sl - 1.4016
Tp - 1.3901
Our Risk - 1%
Start protection of your profits from lower levels
Disclosure: I am part of Trade Nation's Influencer program and receive a monthly fee for using their TradingView charts in my analysis.
❤️ Please, support our work with like & comment! ❤️

2 continuation long playsFollowing this 18h BOS can we get retracement involvement to ride this high enough.
I will be looking for a MS change bullishly on the retracement leg.

USDCAD buy setup H1Hello! Friends,
Greetings. Please leave a Like if you like the idea.
Before start talking about technical Let's share your LOVE by giving me LIKES to support this work. Thanks in advance.

USD/CAD Bulls Could Just be Getting Warmed UpWe finally saw the reversal higher on USD/CAD last week, with a notable bullish engulfing candle strongly suggesting an important swing low. I take a quick look at last week's signal, update the analysis then wrap up on Canadian dollar futures positioning.
Matt Simpson, Market Analyst at City Index and Forex.com

Pottential buy at 0.39000Trading Journal Entry –
Trade Setup:
Monitoring a potential buy opportunity around the 0.39000 level.
Rationale:
On the higher timeframes (Daily/Weekly), the 0.39000 zone stands out as a significant long-term support level. This area has historically acted as a strong demand zone, where price found solid buying interest and reversed to the upside. It represents a potential accumulation area, likely to attract institutional orders if retested.
The overall market structure suggests a mean-reverting behavior, and with price approaching the lower bounds of the historical range, this level could serve as a high-probability entry point for long positions, especially if supported by bullish confirmation on lower timeframes. Price action and momentum indicators will be monitored closely for signs of strength and reversal near this level.

AUDCAD SHORT FORECAST Q2 W20 D12 Y25AUDCAD SHORT FORECAST Q2 W20 D12 Y25
Professional Risk Managers👋
Welcome back to another FRGNT chart update📈
Diving into some Forex setups using predominantly higher time frame order blocks alongside confirmation breaks of structure.
Let’s see what price action is telling us today!
💡Here are some trade confluences📝
✅ Weekly order block
✅Intraday 15 order block
✅Tokyo ranges to be filled
✅Intraday bearish breaks of structure to be confirmed
🔑 Remember, to participate in trading comes always with a degree of risk, therefore as professional risk managers it remains vital that we stick to our risk management plan as well as our trading strategies.
📈The rest, we leave to the balance of probabilities.
💡Fail to plan. Plan to fail.
🏆It has always been that simple.
❤️Good luck with your trading journey, I shall see you at the very top.
🎯Trade consistent, FRGNT X

Possibility of uptrend It is expected that the uptrend will form until the specified resistance levels. Then there is a possibility of a trend change and the start of a correction. By crossing the resistance trend line, the continuation of the uptrend will be possible.

Heading into overlap resistance?The Loonie (USD/CAD) is rising towards the pivot, which has been identified as an overlap resistance and could reverse to the 1st support.
Pivot: 1.4097
1st Support: 1.3896
1st Resistance: 1.4268
Risk Warning:
Trading Forex and CFDs carries a high level of risk to your capital and you should only trade with money you can afford to lose. Trading Forex and CFDs may not be suitable for all investors, so please ensure that you fully understand the risks involved and seek independent advice if necessary.
Disclaimer:
The above opinions given constitute general market commentary, and do not constitute the opinion or advice of IC Markets or any form of personal or investment advice.
Any opinions, news, research, analyses, prices, other information, or links to third-party sites contained on this website are provided on an "as-is" basis, are intended only to be informative, is not an advice nor a recommendation, nor research, or a record of our trading prices, or an offer of, or solicitation for a transaction in any financial instrument and thus should not be treated as such. The information provided does not involve any specific investment objectives, financial situation and needs of any specific person who may receive it. Please be aware, that past performance is not a reliable indicator of future performance and/or results. Past Performance or Forward-looking scenarios based upon the reasonable beliefs of the third-party provider are not a guarantee of future performance. Actual results may differ materially from those anticipated in forward-looking or past performance statements. IC Markets makes no representation or warranty and assumes no liability as to the accuracy or completeness of the information provided, nor any loss arising from any investment based on a recommendation, forecast or any information supplied by any third-party.

USDCAD TRADE SETUPWait for retest the entry level then take a trade for Buy otherwise skip this setup

USDCAD switch to bullrun, corection weeklyWe are curently switched last week on daily timeframe to bulish, 4h bulish, and so I expect to continue after retracement to buys until the resistance of weekly above

While above 1.3900, It Could Reach to 1.4030.Dear traders, last week we witnessed a clear and strong breakout of the falling trendline and the resistance at 1.3900, as well. This implies a strong possibility on continuation of the bullish impulse towards 1.4030 and maybe beyond, as long as the current support at 1.3900 holds. Thus, the pair may experience some consolidations above the support before the bullish move. Let's See!
