Possibility of uptrend The price is expected to consolidate above the support area, then if the resistance trend line is broken, a continuation of the uptrend is likely.
CADUSD trade ideas

USDCAD swing longsFrom fundamental analysis on CAD futures derived from "barchart.com". Currently as of writing (Monday 30th April 2025), we can see the CAD futures price increasing from this day but the Open Interest has been decreasing steadily so we can anticipate a reversal soon for the futures price (to flip bearish), which means bullish PA for USDCAD (this could also give you a slight insight/confirmation to DXY’s potential price).
Technicals outlined in chart using price action.

USDCAD LONG FORECAST Q2 W18 D30 Y25 USDCAD LONG FORECAST Q2 W18 D30 Y25
Professional Risk Managers👋
Welcome back to another FRGNT chart update📈
Diving into some Forex setups using predominantly higher time frame order blocks alongside confirmation breaks of structure.
Let’s see what price action is telling us today!
💡Here are some trade confluences📝
✅Intraday bullish breaks of structure
✅Tokyo ranges to be filled
✅Daily low rejection
✅1' order block identified
🔑 Remember, to participate in trading comes always with a degree of risk, therefore as professional risk managers it remains vital that we stick to our risk management plan as well as our trading strategies.
📈The rest, we leave to the balance of probabilities.
💡Fail to plan. Plan to fail.
🏆It has always been that simple.
❤️Good luck with your trading journey, I shall see you at the very top.
🎯Trade consistent, FRGNT X

USDCAD – DAILY OUTLOOK – APRIL 29Looking at the daily chart, USDCAD hasn’t done much in terms of our longer-term target but continues to reject 1.38618, which adds confluence to the bearish bias.
That being said, the consistent failure to push higher makes me doubt we’ll see the deeper pullback to 1.39621—unless we get a strong fundamental catalyst. So for now:
📉 Current sell zones:
– 1.37871
– 1.36647
🎯 First target = 1.34380 (300+ pips available)
Will reassess if any news shifts the bias, but structure-wise we stay short.

USDCAD | Technical Rebound or Final Stop Before the Crash?USDCAD is currently in a highly delicate phase: the price has reached a key weekly demand zone between 1.3720–1.3820, which overlaps with a strong Fibonacci retracement cluster (0.705–0.78) of the previous bullish leg. So far, the reaction has been muted, but price compression and fading volatility suggest a potential short-term rebound.
However, looking at the bigger picture, the macro and positioning signals are flashing red for the US dollar:
📊 COT Report: Non-Commercials are significantly increasing short positions on USD and reducing shorts on CAD → bearish bias on USDCAD
🧠 Retail sentiment: Most retail traders are long on USDCAD → contrarian bearish bias
🗓️ Seasonality: May is historically negative for the USD and positive for the CAD → further confirms the short thesis
Only a structural recovery above 1.4150 on the weekly close would invalidate the bearish setup. Until then, any retracement towards 1.3980–1.4050 should be seen as an opportunity to sell strength.
🎯 Key Levels:
Sell zone: 1.3980–1.4050
Invalidation: Weekly close > 1.4150
Targets: 1.3720 – 1.3550
🔔 Critical note: When everyone is long, often the only direction left is down.

USDCAD SHORT IDEAUnder current market conditions, the area near 1.3849 has been identified as a critical resistance zone, where the AI model detects a high-probability trade setup.
From a technical perspective, a clear directional bias based on recent price action patterns. Suppose the market demonstrates increased volume and price stability above key moving averages in the 1.3849 area. In that case, traders are advised to monitor for trend-continuation entry opportunities in alignment with the prevailing momentum.
Profit targets are defined at 1.3819 and 1.3785, corresponding to logical technical support zones. These levels are designed for staged profit-taking across different trade management styles. Stop-loss should be strictly enforced at the designated level; once breached, the strategy is considered invalidated in order to limit potential downside.

TOP DOWN ANALYSIS ON USDCAD 4HR ON THE 4HR TIMEFRAME, We established the key monthly zone + weekly trendline + wide divergence all signaling bullish and hence rhyming with the monthly, weekly and daily bullish bias. Our confirmation will be the break of the 4hr trend line for a possible quick entry long!!

TOP DOWN ANALYSIS ON USDCAD DAILY TIMEFRAME ON THE DAILY TIMEFRAME, We established the major zone + the weekly trend line + momentum loss as price approached the key zone + tight divergence all signaling bullish!!

Top Down Analysis on USDCADOn the WEEKLY timeframe We were able to establish the monthly zone rhyming with the weekly zone + the weekly trendline right at the zone + Last week Candle formation which happened to close as doji right at the Zone which all signals bullish.

TOP DOWN ANALYSIS ON USDCADMONTHLY TIME FRAME : Price dropped from a major swing high monthly zone however price is currently on another major zone again but haven't reacted as the monthly candle is not closed yet hence we wait for the monthly candle close for a possible price action on the monthly timeframe.

Daily Price Action: USDCAD Tuesday 4/29/2025In this video, we will be looking into the potential price action USDCAD.

USDCAD Buy IdeaUSDCAD is bouncing off a major daily support level around 1.38100 after a strong bearish move. Price action shows early signs of bullish interest, with the potential for a correction toward the 50-day Simple Moving Average. My target is set slightly lower at 1.4142 to ensure profits are secured before major resistance hits.

USD/CAD 4H CHART PATTERNUSD/CAD Technical Analysis
Chart Pattern: Trend Line Breakout Reversal
Target: 1.44000
1. Overall Market Structure
The chart depicts a clear downtrend, followed by sideways consolidation near a horizontal support line. A descending trend line captures the bearish structure, which has now been challenged by recent bullish momentum.
2. Support Zone & Rejection
The price has respected the support zone multiple times, forming a strong base.
Repeated bounces off this level suggest accumulation, where buyers are building positions.
3. Breakout Confirmation
Price action is attempting to break above the descending trend line, signaling a potential reversal from bearish to bullish.
The "Entry Long" point marks an ideal breakout zone, where traders could enter with confirmation (strong bullish candle close above the trend line).
4. Target Projection: 1.44000
The projected target is 1.44000, aligning with a major resistance level (previous structure highs).
This makes the trade a trend reversal play, aiming to capture the first major upward swing post-breakout .
5. Risk Management
A stop loss should be placed just below the support line or recent swing low to guard against a false breakout.
The trade offers a favorable risk-to-reward ratio, especially if entered on a retest of the breakout zone.

USDCAD Bearish Trendline RetestUSDCAD is in an overall bearish trend with the bearish trendline being tested multiple times. Every time price breaks through the trendline it quickly rejects and returns below the trendline. Main analysis was done on the 1 hour timeframe where price is currently trading under the 200 ema. Market Execution sell with SL at previous high.

USDCAD Near Key Trendline as Carney Wins ElectionUSDCAD remained relatively calm as Canadian election results began to come in. Mark Carney is projected to win, and the initial reaction was bullish for the Canadian dollar. However, the gains were short-lived, as the victory margin appears narrow.
Canada stands at a pivotal moment in its history. The newly announced tariffs will likely deal a heavy blow to the economy. Markets are cautious, recognizing that a slim majority could complicate budget negotiations and legislative decisions in Parliament. On the other hand, Carney’s background as a former central bank governor could provide economic credibility during a potential slowdown.
Carney stated, "We are over the shock of American betrayal. But we should never forget the lessons." He is expected to pursue damage-control with the U.S. through negotiation, while simultaneously turning toward the EU to boost trade. Although this blow may prove beneficial for Canada in the long run, the coming years could present serious challenges.
From a combined perspective including technical and fundamental side, the bullish trend channel in USDCAD may remain intact for now. The lower boundary of the four-year trend lies around 1.37. As long as this trendline holds, dips may present buying opportunities. For any meaningful upward movement, the 1.3670–1.37 zone must be clearly broken with multiple daily closes above. Until a breakout or breakdown occurs, range-bound and uncertain price action may persist between these levels.

USDCAD LONGMarket structure bullish on HTFs DH
Entry at both Weekly and Daily AOi
Weekly Rejection at AOi
Daily Rejection at AOi
Previous Structure point Daily
Around Psychological Level 1.38500
H4 Candlestick rejection
Rejection from Previous structure
Levels 4.1
Entry 95%
REMEMBER : Trading is a Game Of Probability
: Manage Your Risk
: Be Patient
: Every Moment Is Unique
: Rinse, Wash, Repeat!
: Christ is King.

Loonie Drops on Election Shock – Is USD/CAD Set to Rally Further⭐️The USD/CAD pair recovered from intraday losses, trading around 1.3840 in Tuesday’s early European session, as the Canadian dollar (CAD) weakened following Canada’s election results. Prime Minister Mark Carney of the Liberal Party retained power but secured only 167 of 343 seats, falling short of the majority needed for effective trade negotiations with the US. Carney declared the end of the US-led global trade system, unsettling the CAD. The USD gained from optimism in US-China trade relations, with Trump open to lowering tariffs, Beijing exempting some US imports, and ongoing talks with President Xi Jinping showing progress. Trump also proposed reducing auto tariffs, boosting market sentiment.
🔼BUY 1.37100 - 1.36900
SL 1.36600
TP1 1.37400
TP2 1.37900
🔽SELL 1.38800 - 1.39000
SL 1.39300
TP1 1.38500
TP2 Open

USDCAD: Your Next Bearish Signal USDCAD is currently trading within a downward channel following a significant decrease in value in recent weeks.
The price has formed an inside bar candlestick pattern and is currently consolidating within the range of the mother bar.
To confirm a sell signal, wait for the price to drop below 1.3797 and close below that level. It is likely that the pair will continue to decline and potentially reach 1.3749, then the psychological level of 1.3700.

Carney wins, US jobs are in spotlight. Short-term USDCAD reviewThe former BoE chief Mark Carney became the new PM of Canada. US JOLTs, ADP and NFP numbers are carefully monitored by USD traders. What could happen with MARKETSCOM:USDCAD ?
Let's find out.
FX_IDC:USDCAD
Let us know what you think in the comments below.
Thank you.
77.3% of retail investor accounts lose money when trading CFDs with this provider. You should consider whether you understand how CFDs work and whether you can afford to take the high risk of losing your money. Past performance is not necessarily indicative of future results. The value of investments may fall as well as rise and the investor may not get back the amount initially invested. This content is not intended for nor applicable to residents of the UK. Cryptocurrency CFDs and spread bets are restricted in the UK for all retail clients.

USDCAD Triple TopSince 2015 up to 2025, USDCAD is moving inside a range from 1.20ish to 1.5ish. Currently, we are seeing another rejection to pass 1.5 area. On the previous years after hitting the 1.5 area, the price fell back to the 1.2 area which happened 2 times. Will this repeat the pattern again and go back the 1.2 area ?

USD/CAD(20250429)Today's AnalysisMarket news:
The U.S. Treasury Department raised its second quarter debt forecast to $514 billion. U.S. Treasury Secretary: The "X Day" for the debt ceiling issue will be announced soon.
Technical analysis:
Today's buying and selling boundaries:
1.3845
Support and resistance levels:
1.3921
1.3892
1.3874
1.3816
1.3798
1.3769
Trading strategy:
If the price breaks through 1.3845, consider buying, the first target price is 1.3874
If the price breaks through 1.3816, consider selling, the first target price is 1.3798

Canadian Dollar Rises Amid Tariff Concerns and Oil GainsHello,
FX:USDCAD : The Canadian dollar slightly rose against the U.S. dollar, with bond yields reaching multi-month highs, partly recovering from recent declines due to U.S. trade tariff threats. The loonie traded at 1.4405 to the U.S. dollar, recovering from a near 5-year low in December. Concerns about potential U.S. tariffs and their impact on the Bank of Canada have influenced the market. Despite strong job data in December, investor confidence in further BoC rate cuts has waned. Speculators have increased bearish bets on the Canadian dollar. Meanwhile, the U.S. dollar gained against major currencies as expectations for Federal Reserve rate cuts diminished. Oil prices rose 2.9% to $78.82 per barrel due to anticipated U.S. sanctions on Russian oil. The Canadian 10-year yield increased to 3.507%, marking its highest level since July 9.
For this pair a bearish reversal is still anticipated in the near future!
No Nonsense. Just Really Good Market Insights. Leave a Boost
TradeWithTheTrend3344

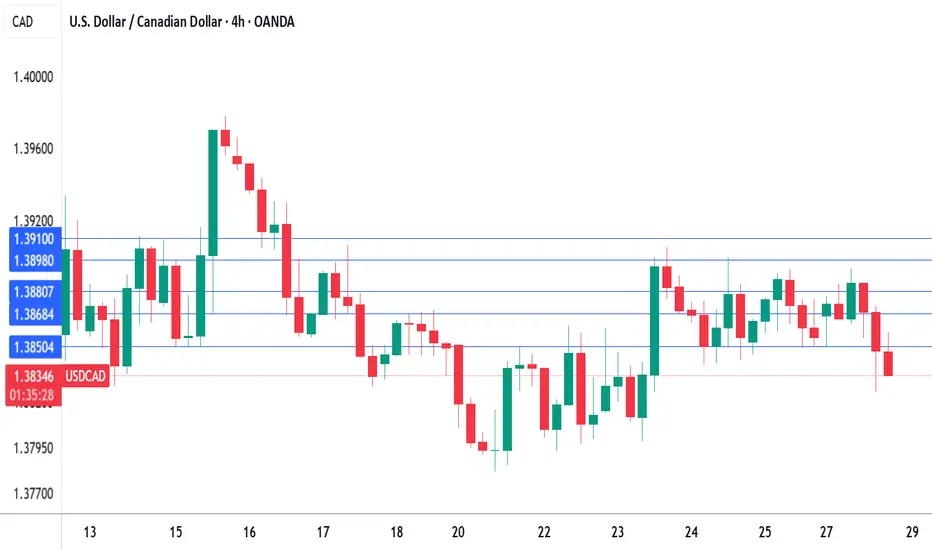
Canadian dollar in holding pattern on Election DayThe Canadian dollar is showing limited movement on Monday. In the European session, USD/CAD is trading at 1.3868, up 0.10% on the day. There are no economic releases out of the US or Canada today.
It's Election Day in Canada. Prime Minister Mark Carney, who has only been in office since March, is favored to win the election. Carney's Liberal Party was badly trailing the Conservatives but US President Trump has ignited Canadian nationalism and turned the election race upside down.
Trump has talked about annexing Canada and although most Canadians don't expect that to happen, there is strong resentment against the US tariff policy, which has hit Canada even though the two countries have a free trade agreement.
Carney is viewed as a strong leader who can stand up to Trump and the markets have priced in a Liberal majority. If the Liberals are forced to make a coalition with the smaller parties, the new government would be considered less stable and that would likely trigger some CAD weakness. If the Conservatives manage to pull out a surprise election victory, the Canadian dollar would likely get a boost.
Canada's retail sales declined 0.4% m/m in February but bounced back in March with a strong gain of 0.7%. On an annualized basis, retail sales slipped to 4.7% in February, down from a revised 5.3% in January.
The improvement in March was driven by consumers making purchases ahead of US tariffs, but consumer spending is likely to deteriorate. The Bank of Canada will be keeping a close eye and will have to consider further rate cuts if upcoming economic data is weak. The BoC maintained the cash rate at 2.75% earlier this month and meets next on June 4.
USD/CAD is testing resistance at 1.3868. Above, there is resistance at 1.3880 and 1.3910
1.3850 and 1.3838 are the next support levels