USDCAD still bullish?
OANDA:USDCAD what's next, we are have bullish push, currently price in ASCENDING CHANNEL and in ascending channel is visible and one more ASCENDING CHANNEL (marked yelow), interesting chart,- can we see higher bullish push?
SUP zone: 1.36800
RES zone: 1.37600, 1.37900
CADUSD trade ideas

USD/CAD - Potential TargetsDear Friends in Trading,
How I see it,
PIVOT AREA @ 1.37000 - 1.37208
1) Pair is under fundamental pressure at this time.
2) We need a strong breach above PIVOT area to signal any
chance for broader bullish price action.
Keynote:
1.35775 = Key Demand
I sincerely hope my point of view offers a valued insight.
Thank you for taking the time to study my analysis.

USDCAD MARKET OUTLOOK📊 USDCAD Institutional Market Outlook
🔷 Monthly & Weekly Structure – Bearish Bias
A Monthly Fair Value Gap (FVG) was formed after a breakaway gap, closing all prior bullish FVGs. This signals strong bearish intent from institutions, with a likely draw toward the next key liquidity level at 1.34210.
Similarly, a Weekly FVG, also formed from a breakaway imbalance, is currently acting as an unmitigated supply zone. Historically, FVGs formed from breakaway moves are not revisited until the market completes its delivery to a main liquidity pool — in this case, the 1.34210 level.
Price is now consolidating below this weekly FVG, reinforcing a continuation bias rather than reversal.
🔹 Daily Structure – Short-Term Countertrend Rally
A bullish Daily FVG has recently formed, suggesting a possible short-term countertrend rally.
However, due to the breakaway nature of the weekly FVG, price is unlikely to reach back up to 1.3760 before continuing its bearish path.
A probable scenario: price may react from daily demand zones, push into a short-term premium area, then resume its decline toward 1.34210.
🌐 Fundamental Confluence
🟥 CAD Weakness:
U.S. tariff policy is placing heavy pressure on the Canadian economy, especially in autos, steel, and oil sectors.
Recent SECO reports and tariff-related projections expect a long-term GDP drag of ~2.1%.
Although oil prices have slightly rebounded, it's not enough to counterbalance the trade and policy headwinds.
🟩 USD Strength:
The U.S. dollar remains supported by global safe haven flows and a resilient macro backdrop.
No significant shift in Fed policy tone has emerged, and the USD continues to benefit from relative strength across multiple pairs.
| Timeframe | Bias | Reason |
| ------------ | ------------------------ | ------------------------------------------------------------------------- |
| Monthly | Bearish | Breakaway FVG + closed bullish zones → draw toward 1.34210 |
| Weekly | Bearish | Consolidation below breakaway supply zone |
| Daily | Short-term bullish | Countertrend move expected into local premium, likely to fail near 1.3760 |
| Fundamentals | Bearish CAD, Bullish USD | Tariff risks + economic divergence

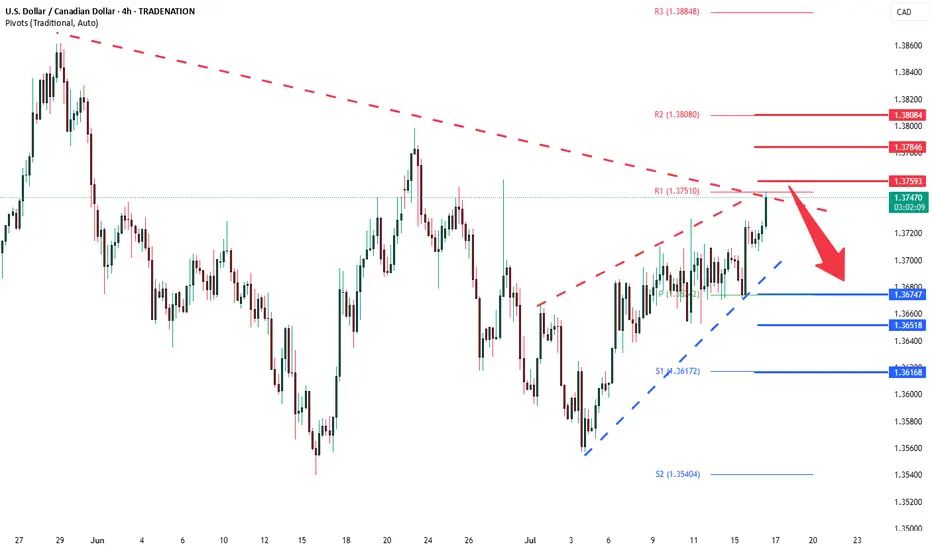
USDCAD oversold consolidation, resistance at 1.3760The USDCAD pair is currently trading with a bearish bias, aligned with the broader downward trend. Recent price action shows a retest of the previous resistance zone, suggesting a temporary sideways consolidation within the downtrend.
Key resistance is located at 1.3760, a prior consolidation zone. This level will be critical in determining the next directional move.
A bearish rejection from 1.3760 could confirm the resumption of the downtrend, targeting the next support levels at 1.3670, followed by 1.3650 and 1.3620 over a longer timeframe.
Conversely, a decisive breakout and daily close above 1.3760 would invalidate the current bearish setup, shifting sentiment to bullish and potentially triggering a move towards 1.3785, then 1.3800.
Conclusion:
The short-term outlook remains bearish unless the pair breaks and holds above 1.3760 Traders should watch for price action signals around this key level to confirm direction. A rejection favours fresh downside continuation, while a breakout signals a potential trend reversal or deeper correction.
This communication is for informational purposes only and should not be viewed as any form of recommendation as to a particular course of action or as investment advice. It is not intended as an offer or solicitation for the purchase or sale of any financial instrument or as an official confirmation of any transaction. Opinions, estimates and assumptions expressed herein are made as of the date of this communication and are subject to change without notice. This communication has been prepared based upon information, including market prices, data and other information, believed to be reliable; however, Trade Nation does not warrant its completeness or accuracy. All market prices and market data contained in or attached to this communication are indicative and subject to change without notice.

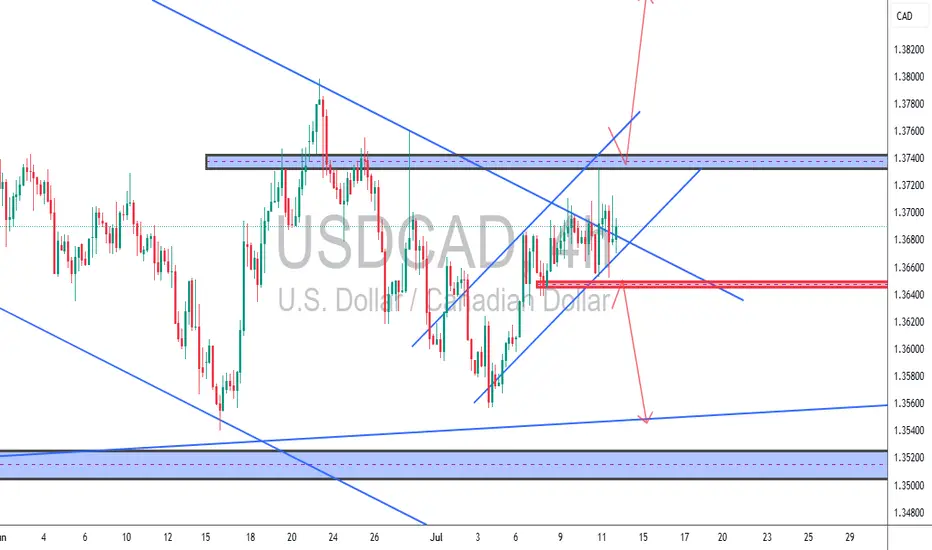
SDCAD 4H – Compression at Resistance📉📈 USDCAD 4H – Compression at Resistance | Breakout or Rejection?
Price is consolidating near a major supply zone inside a wedge structure.
We're at a key decision point: a clean breakout above 1.3750 = bullish continuation; a rejection and break of minor trendline support = bearish drop back to demand.
🧠 TCB Strategy in play: waiting for breakout confirmation or reversal candle.
Long above 1.3750 → Target 1.3840
Short below 1.3660 → Target 1.3560
🎯 High RRR in both directions.
USDCAD (U.S. Dollar/Canadian Dollar) long (buy) setupUSDCAD (U.S. Dollar/Canadian Dollar) long (buy) setup. Here's the breakdown:
**Setup Overview**
* **Entry Level:** Around 1.3700
* **Take Profit (TP):** 1.3812 (upper green zone)
* **Stop Loss (SL):** 1.3638 (lower red zone)
**Technical Observations**
* Price is bouncing from a rising trendline (diagonal black line), suggesting bullish support.
* Price is trading above the 50 EMA, 21 EMA, and 7 EMA — indicating bullish momentum.
* A strong bullish candle with high volume occurred before consolidation, showing buyer interest.
* Tight consolidation near the entry level suggests potential for a breakout continuation upward.
**Bias**
* **Bullish** bias as long as price remains above the trendline and EMAs.
* The trade offers a favorable risk-to-reward ratio, targeting a \~110 pip gain vs. \~60 pip risk.
*Summary**
The chart shows a bullish trade setup on USDCAD based on trendline support, EMA alignment, and volume confirmation. A breakout above 1.3700 aims for 1.3812, while invalidation lies below 1.3638.


USDCAD LONG DAILY FORECAST Q3 D14 W29 Y25USDCAD LONG DAILY FORECAST Q3 D14 W29 Y25
Professional Risk Managers👋
Welcome back to another FRGNT chart update📈
Diving into some Forex setups using predominantly higher time frame order blocks alongside confirmation breaks of structure.
Let’s see what price action is telling us today! 👀
💡Here are some trade confluences📝
✅Daily Order block identified
✅4H Order Block identified
✅1H Order Block identified
📈 Risk Management Principles
🔑 Core Execution Rules
Max 1% risk per trade — protect your capital, preserve your edge
Set alerts — let price come to your levels, not the other way around
Minimum 1:2 RR — if the reward doesn’t justify the risk, it’s not worth it
Focus on process, not outcomes — the outcome is random, your process is not
🧠 Remember: The edge lies in execution, not prediction. Your strategy is only as good as your discipline to follow it.
🧠 FRGNT Insight of the Day
"The market rewards structure and patience — not emotion or urgency."
Execute like a robot. Manage risk like a pro. Let the chart do the talking.
🏁 Final Words from FRGNT
📌 USDCAD is offering textbook alignment — structure, order flow, and confirmation are all in place.
📌 The opportunity is there — now it’s about how you show up to execute.
🎯 Trade with clarity. Act with conviction. Manage with precision.
🔑 Remember, to participate in trading comes always with a degree of risk, therefore as professional risk managers it remains vital that we stick to our risk management plan as well as our trading strategies.
📈The rest, we leave to the balance of probabilities.
💡Fail to plan. Plan to fail.
🏆It has always been that simple.
❤️Good luck with your trading journey, I shall see you at the very top.
🎯Trade consistent, FRGNT X


USDCAD I Weekly CLS I Model 1 I KL - OB I Target CLS LowYo Market Warriors ⚔️
BIG SHORT — if you’ve been riding with me, you already know:
🎯My system is 100% mechanical. No emotions. No trend lines. No subjective guessing. Just precision, structure, and sniper entries.
🧠 What’s CLS?
It’s the real smart money. The invisible hand behind $7T/day — banks, algos, central players.
📍Model 1:
HTF bias based on the daily and weekly candles closes,
Wait for CLS candle to be created and manipulated. Switch to correct LTF and spot CIOD. Enter and target 50% of the CLS candle.
For high probability include Dealing Ranges, Weekly Profiles and CLS Timing.
Trading is like a sport. If you consistently practice you can learn it.
“Adapt what is useful. Reject whats useless and add whats is specifically yours.”
David Perk aka Dave FX Hunter
💬 Don't hesitate to ask any questions or share your opinions

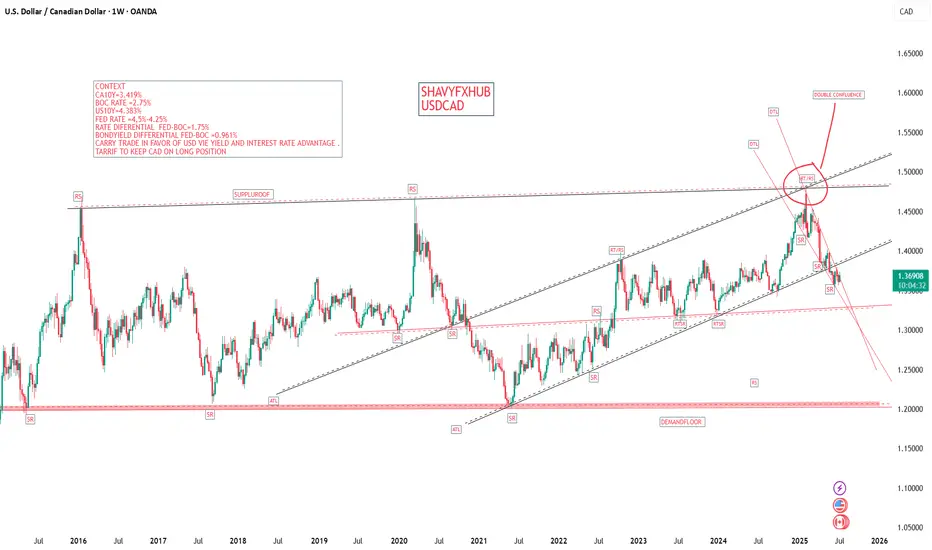
USDCADThe US tariffs have had a mixed but generally weakening effect on the Canadian dollar (CAD) , influencing the USD/CAD exchange rate
Current Exchange Rate Context
As of July 11, 2025, the USD/CAD rate is around 1.37-1.3698 , with the US dollar strengthening and the Canadian dollar weakening about 0.7% over the past month.
Impact of US Tariffs on CAD Strength
Trade Exposure:
Canada is highly integrated with the US economy, with over 70% of Canadian exports going to the US. Tariffs on Canadian goods or retaliatory tariffs can reduce trade volumes and economic growth in Canada, weakening the CAD.
Market Sentiment and Risk:
Tariff uncertainties create volatility and risk aversion, often benefiting the safe-haven USD at the expense of commodity-linked currencies like CAD.
Commodity Prices:
Tariffs can disrupt global supply chains and commodity demand. Since Canada is a major oil exporter, any negative impact on oil prices due to trade tensions tends to weaken the CAD.
Interest Rate and Economic Outlook:
Trade tensions may lead to cautious monetary policy by the Bank of Canada, limiting rate hikes or prompting cuts, which can reduce the interest rate differential versus the US and weigh on CAD
2. Interest Rates
Bank of Canada (BoC) Overnight Target Rate: 2.75% (held steady as of July 9, 2025).
Canadian government 10 year bond yield is 3.419%
US Federal Reserve Rate: Around 4.5% (market consensus for mid-2025).
United states government 10 year bond yield is 4.38%-4.4%
The interest rate differential between the US and Canada remains significant, favoring USD, which supports USD strength against CAD.
US 10-Year Treasury Yield: Generally higher than Canadian yields, around 4.38%–4.4% (market consensus), maintaining a yield advantage for USD assets.
4. Impact on USD/CAD
The higher US interest rates and bond yields relative to Canada make USD-denominated assets more attractive, contributing to the USD’s strength against CAD.
Conclusion
The US tariff policies in 2025 have contributed to a weaker Canadian dollar by increasing economic uncertainty, disrupting trade, and pressuring commodity prices. This has supported the US dollar’s recent strength against CAD, pushing the USD/CAD rate toward the higher .
#usdcad #cad #usd
USDCAD's Opportunity Bell Is Ringing — Don’t Miss Out!Hey there, my valued friends!
I’ve prepared a fresh USDCAD analysis just for you.
📌 If the 1.37245 level breaks, the next target will be 1.38000.
Every single like you send my way is the biggest motivation behind sharing these analyses.
🙌 Huge thanks to each and every one of you who supports me!
Would you like to add a visual or a catchy headline to boost engagement even more? I can help with that too.


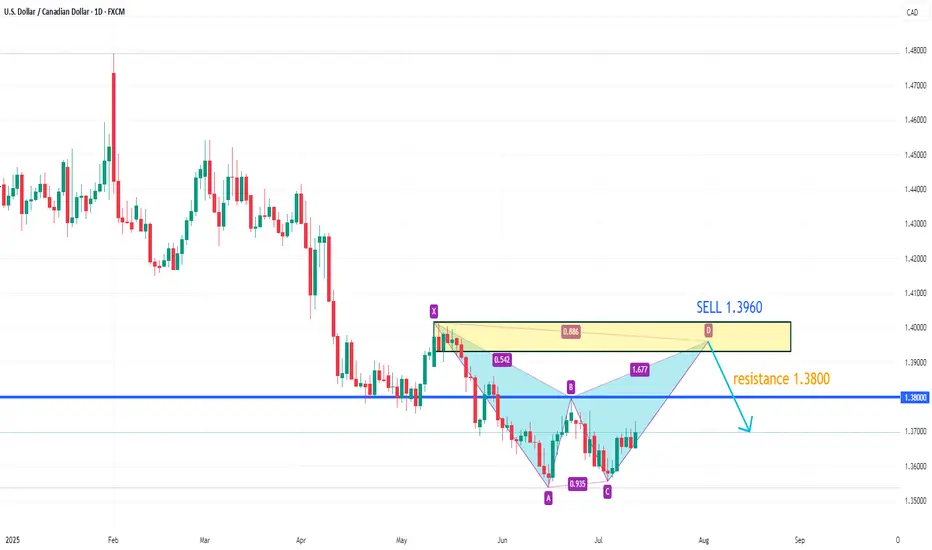
USDCAD upside target 1.3960On the 4-hour chart, USDCAD stabilized and moved upward, with bulls taking the upper hand. The current market has formed a potential double bottom pattern. In the short term, attention can be paid to the resistance near 1.380. A breakthrough will hopefully continue to move higher, with the upward target around 1.3960. When the price reaches 1.3960, attention can be paid to the bearish bat pattern.
USDCAD LONG DAILY FORECAST Q3 D11 W28 Y25USDCAD LONG DAILY FORECAST Q3 D11 W28 Y25
It’s Fun Coupon Friday! 💸🔥
Professional Risk Managers👋
Welcome back to another FRGNT chart update📈
Diving into some Forex setups using predominantly higher time frame order blocks alongside confirmation breaks of structure.
Let’s see what price action is telling us today! 👀
💡Here are some trade confluences📝
✅Daily Order block identified
✅4H Order Block identified
✅1H Order Block identified
🔑 Remember, to participate in trading comes always with a degree of risk, therefore as professional risk managers it remains vital that we stick to our risk management plan as well as our trading strategies.
📈The rest, we leave to the balance of probabilities.
💡Fail to plan. Plan to fail.
🏆It has always been that simple.
❤️Good luck with your trading journey, I shall see you at the very top.
🎯Trade consistent, FRGNT X

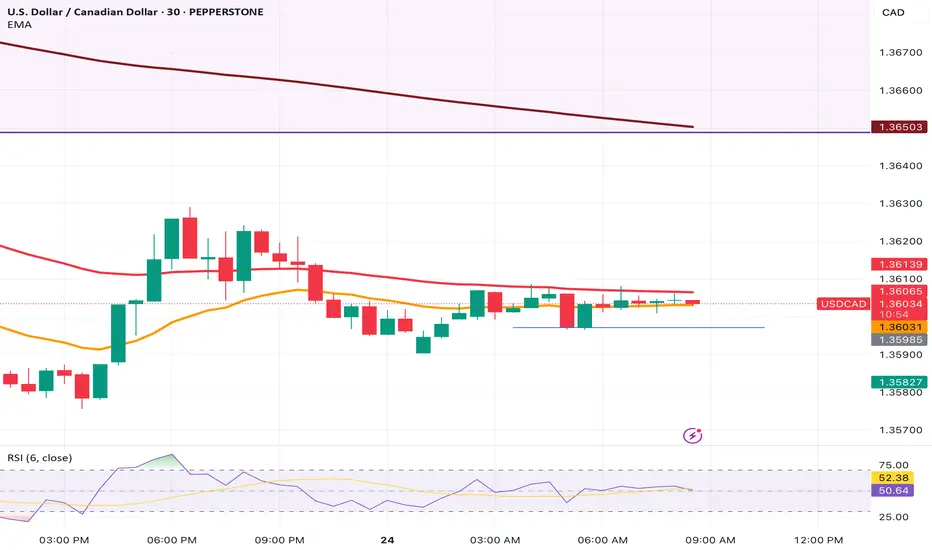
USD/CAD(20250725)Today's AnalysisMarket news:
The European Central Bank announced that it would maintain the three key interest rates unchanged, reiterated data dependence, warned that the external environment is highly uncertain, and President Lagarde did not rule out the possibility of future rate hikes. Traders reduced their bets on ECB rate cuts.
Technical analysis:
Today's buying and selling boundaries:
1.3626
Support and resistance levels:
1.3689
1.3666
1.3651
1.3602
1.3587
1.3563
Trading strategy:
If the price breaks through 1.3651, consider buying, with the first target price of 1.3666
If the price breaks through 1.3626, consider selling, with the first target price of 1.3602

USDCAD...potential further upside expectedHey Hey TradingView fam! Hope you guys are doing absolutely amazing today...hope your trading weeks are off to an amazing start and hopefully this post can be helpful for the remainder of this week for you! Let's dive in!
OK so for USDCAD this is a post to piggyback off of the previous swing position post I did for USDCAD longs a couple weeks ago...those positions played out well and now wanted to revisit this currency pair because it is giving another potential opportunity to mover to the upside and so wanted to break down what I see here. Let's make it simple
1. Weekly demand zone
2. Strong momentum from buyers on Daily timeframe
3. Higher low formed WITH STRENGTH (big clue of interest)
4. Fib extension lining up with daily supply zone
5. Higher low forming would then now expect a new higher high to form
OK hope that made sense! I want to make these posts as simple as possible so hopefully this added some value for you guys!
Please boost and follow my page for more highly accurate setups! Cheers!


Is USDCAD staring at a new low for 2025?FX_IDC:USDCAD ready for a lower low? Let's see.
MARKETSCOM:USDCAD
Let us know what you think in the comments below.
Thank you.
75.2% of retail investor accounts lose money when trading CFDs with this provider. You should consider whether you understand how CFDs work and whether you can afford to take the high risk of losing your money. Past performance is not necessarily indicative of future results. The value of investments may fall as well as rise and the investor may not get back the amount initially invested. This content is not intended for nor applicable to residents of the UK. Cryptocurrency CFDs and spread bets are restricted in the UK for all retail clients.