USDCAD...potential further upside expectedHey Hey TradingView fam! Hope you guys are doing absolutely amazing today...hope your trading weeks are off to an amazing start and hopefully this post can be helpful for the remainder of this week for you! Let's dive in!
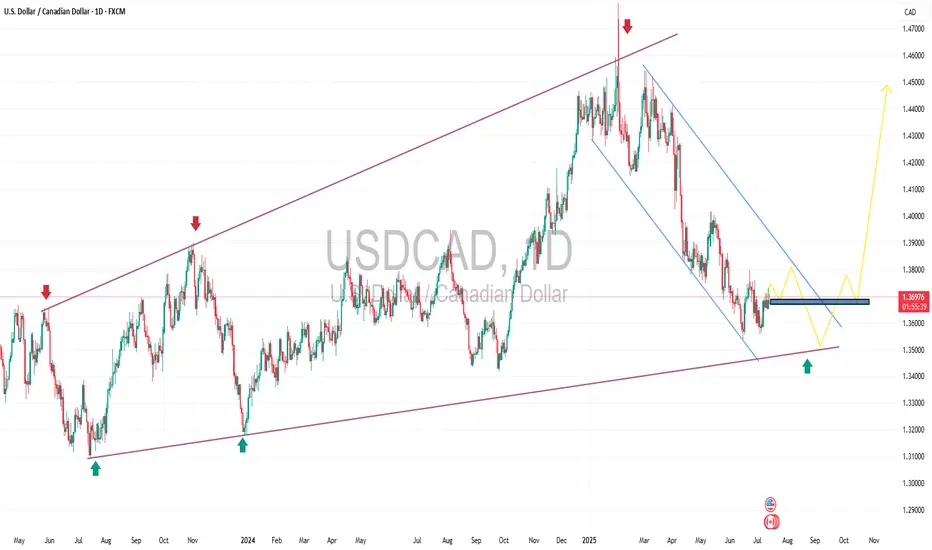
OK so for USDCAD this is a post to piggyback off of the previous swing position post I did for USDCAD longs a couple weeks ago...those positions played out well and now wanted to revisit this currency pair because it is giving another potential opportunity to mover to the upside and so wanted to break down what I see here. Let's make it simple
1. Weekly demand zone
2. Strong momentum from buyers on Daily timeframe
3. Higher low formed WITH STRENGTH (big clue of interest)
4. Fib extension lining up with daily supply zone
5. Higher low forming would then now expect a new higher high to form
OK hope that made sense! I want to make these posts as simple as possible so hopefully this added some value for you guys!
Please boost and follow my page for more highly accurate setups! Cheers!
CADUSD trade ideas


Is USDCAD staring at a new low for 2025?FX_IDC:USDCAD ready for a lower low? Let's see.
MARKETSCOM:USDCAD
Let us know what you think in the comments below.
Thank you.
75.2% of retail investor accounts lose money when trading CFDs with this provider. You should consider whether you understand how CFDs work and whether you can afford to take the high risk of losing your money. Past performance is not necessarily indicative of future results. The value of investments may fall as well as rise and the investor may not get back the amount initially invested. This content is not intended for nor applicable to residents of the UK. Cryptocurrency CFDs and spread bets are restricted in the UK for all retail clients.

USDCAD 1H Short The US Dollar is generally exhibiting weakness.
The USDCAD pair maintains a bearish outlook based on a top-down analysis, from the daily timeframe (1D) down to the hourly (1H).
Two potential scenarios are unfolding:
The price may retrace to test the 0.382 Fibonacci level, potentially activating a sell limit order.
Alternatively, the pair could continue its downward movement and break the previous lower low (LL).


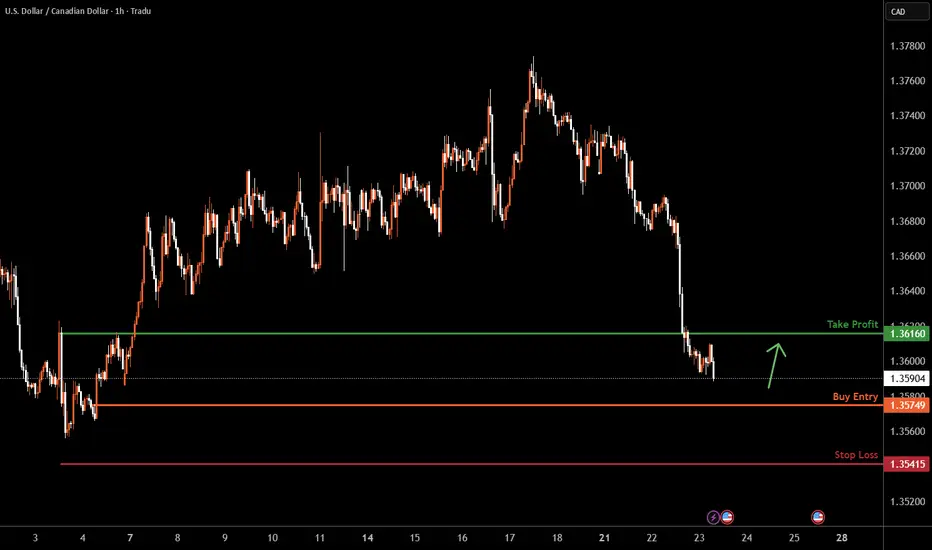
USDCAD H1 I Bullish Bounce Based on the H1 chart analysis, the price is approaching our buy entry level at 1.3574, a pullback support.
Our take profit is set at 1.3616, a pullback resistance.
The stop loss is placed at 1.3541, below swing low support.
High Risk Investment Warning
Trading Forex/CFDs on margin carries a high level of risk and may not be suitable for all investors. Leverage can work against you.
Stratos Markets Limited (tradu.com ):
CFDs are complex instruments and come with a high risk of losing money rapidly due to leverage. 66% of retail investor accounts lose money when trading CFDs with this provider. You should consider whether you understand how CFDs work and whether you can afford to take the high risk of losing your money.
Stratos Europe Ltd (tradu.com ):
CFDs are complex instruments and come with a high risk of losing money rapidly due to leverage. 66% of retail investor accounts lose money when trading CFDs with this provider. You should consider whether you understand how CFDs work and whether you can afford to take the high risk of losing your money.
Stratos Global LLC (tradu.com ):
Losses can exceed deposits.
Please be advised that the information presented on TradingView is provided to Tradu (‘Company’, ‘we’) by a third-party provider (‘TFA Global Pte Ltd’). Please be reminded that you are solely responsible for the trading decisions on your account. There is a very high degree of risk involved in trading. Any information and/or content is intended entirely for research, educational and informational purposes only and does not constitute investment or consultation advice or investment strategy. The information is not tailored to the investment needs of any specific person and therefore does not involve a consideration of any of the investment objectives, financial situation or needs of any viewer that may receive it. Kindly also note that past performance is not a reliable indicator of future results. Actual results may differ materially from those anticipated in forward-looking or past performance statements. We assume no liability as to the accuracy or completeness of any of the information and/or content provided herein and the Company cannot be held responsible for any omission, mistake nor for any loss or damage including without limitation to any loss of profit which may arise from reliance on any information supplied by TFA Global Pte Ltd.
The speaker(s) is neither an employee, agent nor representative of Tradu and is therefore acting independently. The opinions given are their own, constitute general market commentary, and do not constitute the opinion or advice of Tradu or any form of personal or investment advice. Tradu neither endorses nor guarantees offerings of third-party speakers, nor is Tradu responsible for the content, veracity or opinions of third-party speakers, presenters or participants.
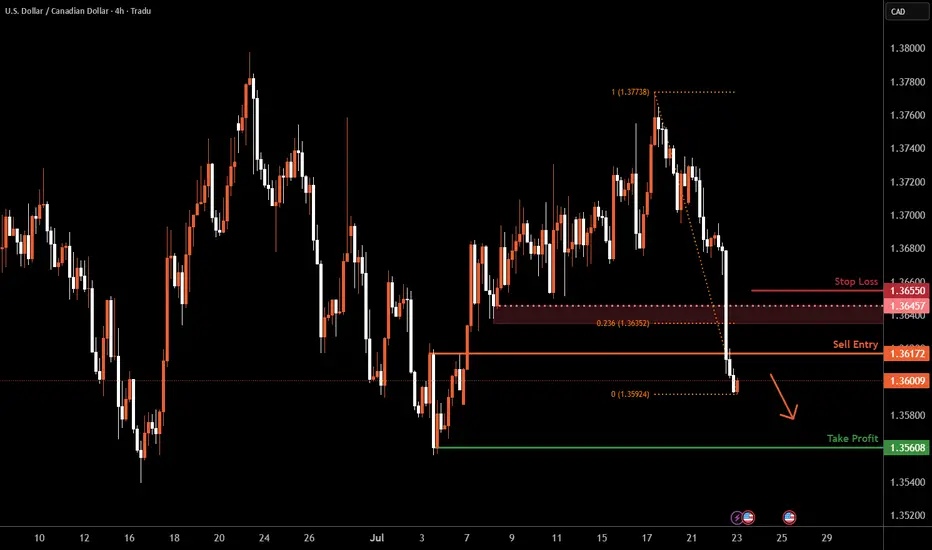
USD/CAD H4 | Potential bearish reversalUSD/CAD is rising towards a pullback resistance and could potentially reverse off this level to drop lower.
Sell entry is at 1.3617 which is a pullback resistance.
Stop loss is at 1.3655 which is a level that sits above the 23.6% Fibonacci retracement and a pullback resistance.
Take profit is at 1.3560 which is a swing-low support.
High Risk Investment Warning
Trading Forex/CFDs on margin carries a high level of risk and may not be suitable for all investors. Leverage can work against you.
Stratos Markets Limited (tradu.com ):
CFDs are complex instruments and come with a high risk of losing money rapidly due to leverage. 66% of retail investor accounts lose money when trading CFDs with this provider. You should consider whether you understand how CFDs work and whether you can afford to take the high risk of losing your money.
Stratos Europe Ltd (tradu.com ):
CFDs are complex instruments and come with a high risk of losing money rapidly due to leverage. 66% of retail investor accounts lose money when trading CFDs with this provider. You should consider whether you understand how CFDs work and whether you can afford to take the high risk of losing your money.
Stratos Global LLC (tradu.com ):
Losses can exceed deposits.
Please be advised that the information presented on TradingView is provided to Tradu (‘Company’, ‘we’) by a third-party provider (‘TFA Global Pte Ltd’). Please be reminded that you are solely responsible for the trading decisions on your account. There is a very high degree of risk involved in trading. Any information and/or content is intended entirely for research, educational and informational purposes only and does not constitute investment or consultation advice or investment strategy. The information is not tailored to the investment needs of any specific person and therefore does not involve a consideration of any of the investment objectives, financial situation or needs of any viewer that may receive it. Kindly also note that past performance is not a reliable indicator of future results. Actual results may differ materially from those anticipated in forward-looking or past performance statements. We assume no liability as to the accuracy or completeness of any of the information and/or content provided herein and the Company cannot be held responsible for any omission, mistake nor for any loss or damage including without limitation to any loss of profit which may arise from reliance on any information supplied by TFA Global Pte Ltd.
The speaker(s) is neither an employee, agent nor representative of Tradu and is therefore acting independently. The opinions given are their own, constitute general market commentary, and do not constitute the opinion or advice of Tradu or any form of personal or investment advice. Tradu neither endorses nor guarantees offerings of third-party speakers, nor is Tradu responsible for the content, veracity or opinions of third-party speakers, presenters or participants.
USD/CAD LongLooking for a retest of 1.35600 zone for a bounce back up to 1.37650 supply zone
FX:USDCAD
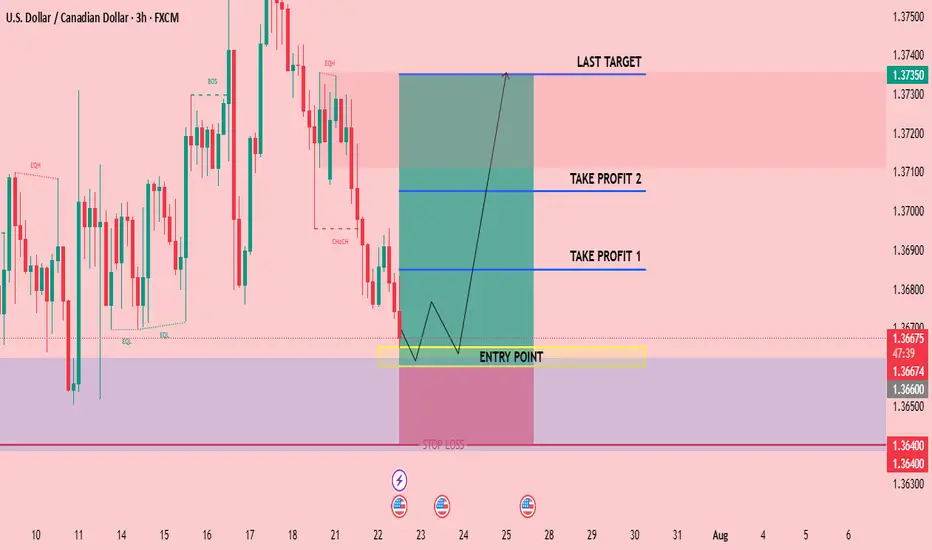
CHECK USDCAD SIGNAL READ THE CAPTAINEntry Point: Around 1.36650 1.36600
Stop Loss: Around 1.36400
🎯 Target Levels
Take Profit 1:
1.36850
Take Profit 2:
1.37050
last target
1.37350
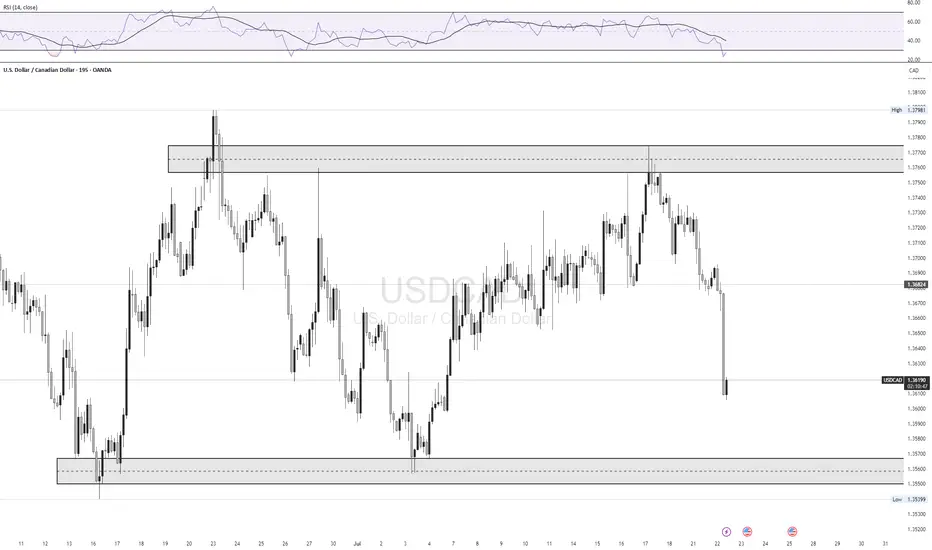
🇨🇦 USDCAD — July 22nd OutlookCurrent Price Behaviour:
USDCAD remains rangebound, sitting just above our key support level of 1.36647. The pair has failed to show any clean breakouts since Monday and remains stuck inside a tight intraday channel.
What We're Watching:
📍 Break of 1.36647 = trigger for continuation of bearish move
🎯 Target: 1.35822 (80 pip move)
⚠️ No active trade until this breaks — structure still unclear
HTF Bias: Bearish
Current Play: Stay out until 1.36647 breaks cleanly with strong momentum and volume. That level unlocks a smoother sell opportunity into our first target.
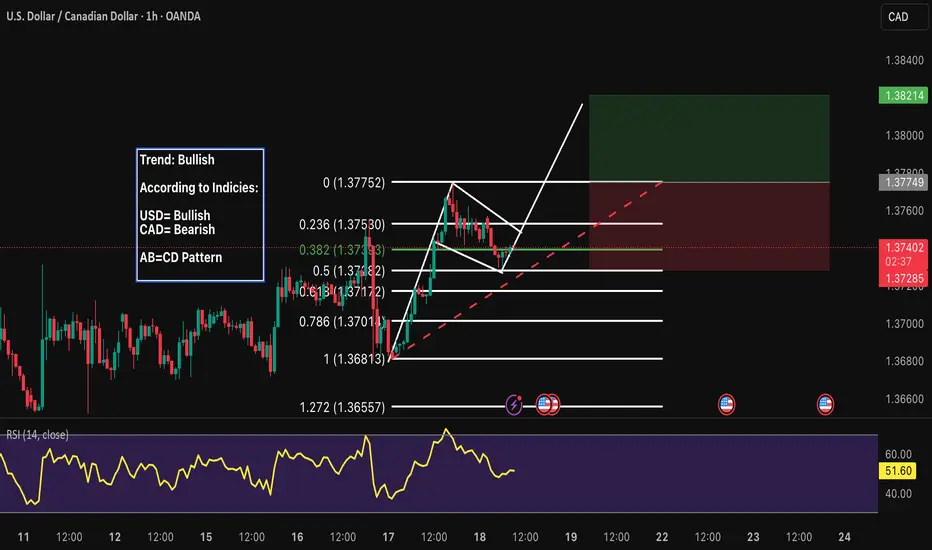
AUDCAD LONG 17-7-2025Indices : dxy bullish
cxy : bearish
trend : buliish
divergence : n/a
continuation hh & hl
reversal : n/a
harmonics : n/a
bias : bullish
order typr : buy limit at fib 0.5

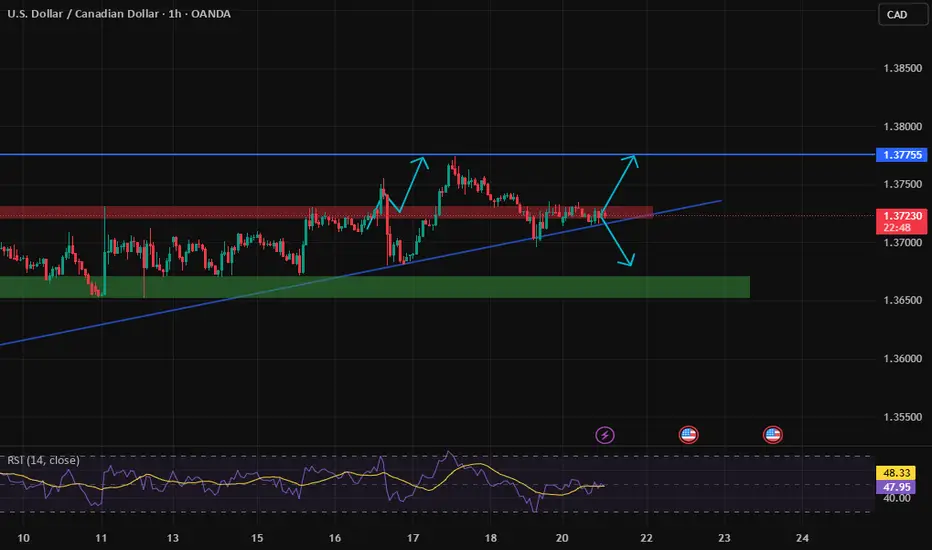
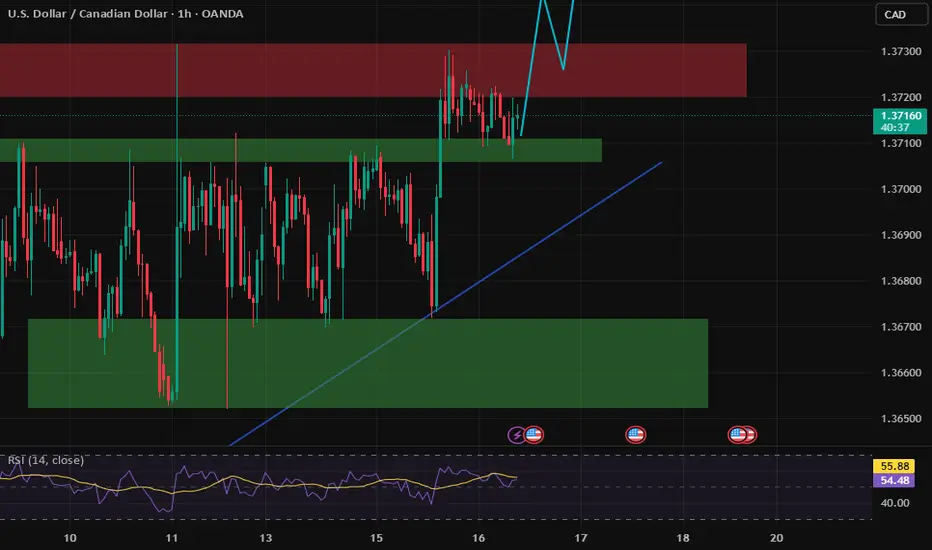
USDCADBroke H1 resistance and price is forming a bullish flag as it retests the zone. Possible movement to next H4 resistance around 1.37700
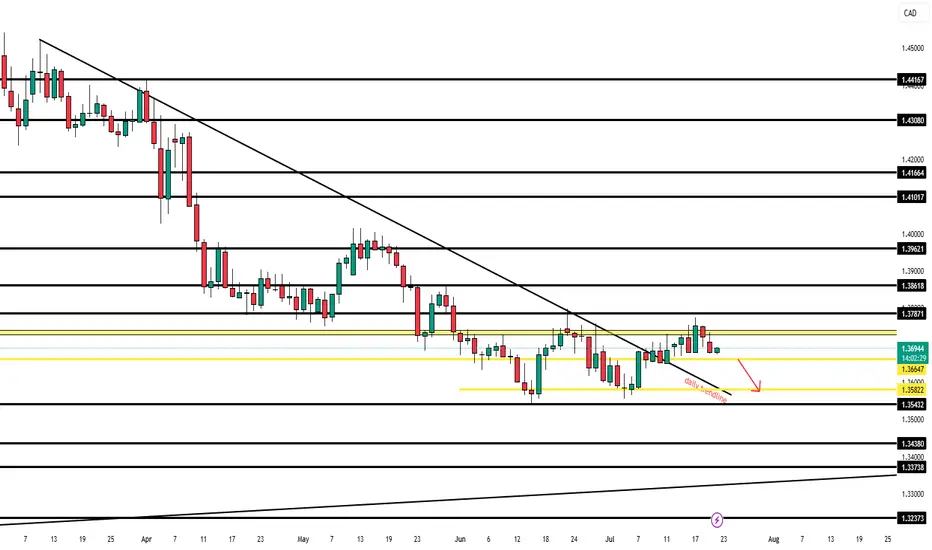
uptrendGiven the support trend line being broken, it is expected that the upward trend will form up to the specified resistance area and then a trend change will be likely. Then the continuation of the downward trend will be possible.

USD/CAD(20250716)Today's AnalysisMarket news:
① The annual rate of the overall CPI in the United States in June rose to 2.7%, the highest since February, in line with market expectations, and the monthly rate was 0.3%, the highest since January, in line with market expectations; the annual rate of the core CPI rose to 2.9%, the highest since February, lower than the expected 3%, but slightly higher than 2.8% last month, and the monthly rate was 0.2%, lower than the market expectation of 0.3%.
② Interest rate futures still show that the Fed is unlikely to cut interest rates this month, but there is a high possibility of a 25 basis point cut in September.
③ Fed mouthpiece: The CPI report will not change the Fed's policy direction.
④ Trump: Consumer prices are low and the federal funds rate should be lowered immediately. The Fed should cut interest rates by 3 percentage points.
⑤ Fed Collins: The core inflation rate is expected to remain at about 3% by the end of the year, and the Fed should maintain active patience.
Technical analysis:
Today's buying and selling boundaries:
1.3708
Support and resistance levels:
1.3766
1.3744
1.3730
1.3685
1.3671
1.3650
Trading strategy:
If the price breaks through 1.3730, consider buying, the first target price is 1.3744
If the price breaks through 1.3708, consider selling, the first target price is 1.3685

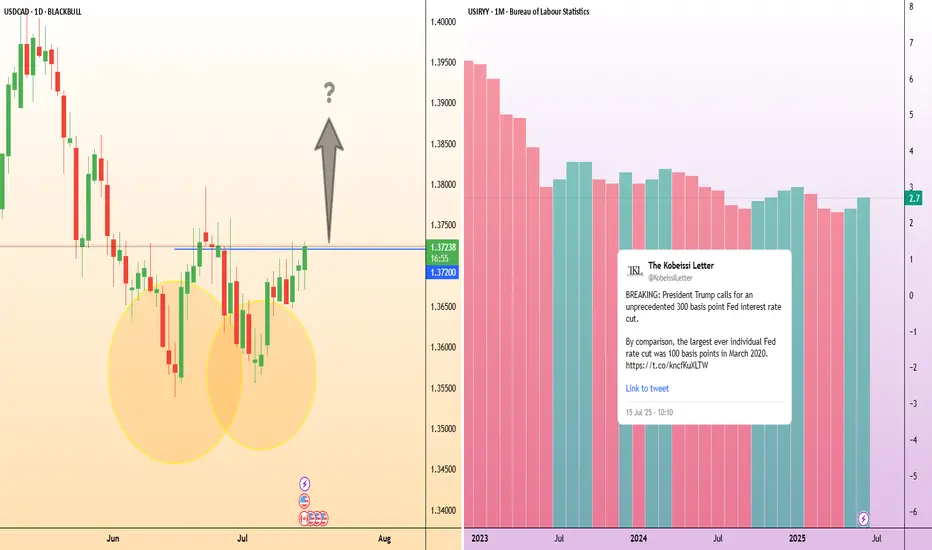
USD/CAD: Inflation gaps create opportunityIn the U.S., inflation accelerated for a second straight month, with headline CPI reaching 2.7% year-on-year in June as President Trump’s tariffs begin to push up the cost of a range of goods.
Increasing inflation could likely heighten the Federal Reserve’s reluctance to cut its interest rate, in defiance of Trump’s public demand. This could provide upward momentum for USD/CAD if expectations for rate cuts are delayed.
USD/CAD is showing signs of a potential trend reversal after finding strong support around 1.3600 in late June. Price action has since formed a series of higher lows, and the recent breakout attempt above 1.3720 suggests bullish momentum could be building.
Canada’s inflation rate, released at the same time as the US’s, edged up to 1.9%, staying below the Bank of Canada’s 2% target for a third consecutive month. With the BoC already signalling easing bias, this divergence in inflation paths may limit CAD strength.
USD/CAD Coils Below Key ResistanceUSD/CAD has rallied nearly 1.3% off the monthly low with the advance now testing resistance at 1.3729/50- a region defined by the 38.2% retracement of the 2021 rally and the May opening-range lows. Note that pitchfork resistance converges on this threshold over the next few days and further highlights the technical significance of this key zone- looking for a reaction off this mark this week.
USD/CAD is trading within the confines of an embedded channel extending off the monthly low with the weekly opening range taking shape just below confluent resistance at 1.3729/50. Ultimately, a breach / close above the June high / 61.8% retracement of the December 2023 advance at 1.3795/98 is needed to suggest a more significant low was registered last month / a larger trend reversal is underway. Subsequent resistance seen at the 2022 high close / 2023 high at 1.3881/99 and the 2022 high / 2020 March weekly-reversal close at 1.3977/90- both levels of interest for possible topside exhaustion / price inflection IF reached.
Initial support rests with the weekly range lows at 1.3670- a break / close below the monthly channel would threaten resumption of the broader downtrend. Subsequent support objectives unchanged at the yearly low-day close (LDC) / May, June, July lows at 1.3571/90 and the Fibonacci confluence at 1.3504/23.
Bottom line: The USD/CAD is testing confluent resistance at the February downtrend with the weekly opening-range set just below- look for the breakout in the days ahead and watch the weekly close here. From a trading standpoint, losses would need to be limited to the weekly lows IF price is heading for a breakout on this stretch with a close above 1.3795 ultimately needed to put the bulls in control.
-MB

USDCADwe see price trading inside a channel , and we have downtrend inside channel were expecting breakout and retest and long term BUY
USDCAD LONG DAILY FORECAST Q3 D14 W29 Y25USDCAD LONG DAILY FORECAST Q3 D14 W29 Y25
Professional Risk Managers👋
Welcome back to another FRGNT chart update📈
Diving into some Forex setups using predominantly higher time frame order blocks alongside confirmation breaks of structure.
Let’s see what price action is telling us today! 👀
💡Here are some trade confluences📝
✅Daily Order block identified
✅4H Order Block identified
✅1H Order Block identified
📈 Risk Management Principles
🔑 Core Execution Rules
Max 1% risk per trade — protect your capital, preserve your edge
Set alerts — let price come to your levels, not the other way around
Minimum 1:2 RR — if the reward doesn’t justify the risk, it’s not worth it
Focus on process, not outcomes — the outcome is random, your process is not
🧠 Remember: The edge lies in execution, not prediction. Your strategy is only as good as your discipline to follow it.
🧠 FRGNT Insight of the Day
"The market rewards structure and patience — not emotion or urgency."
Execute like a robot. Manage risk like a pro. Let the chart do the talking.
🏁 Final Words from FRGNT
📌 USDCAD is offering textbook alignment — structure, order flow, and confirmation are all in place.
📌 The opportunity is there — now it’s about how you show up to execute.
🎯 Trade with clarity. Act with conviction. Manage with precision.
🔑 Remember, to participate in trading comes always with a degree of risk, therefore as professional risk managers it remains vital that we stick to our risk management plan as well as our trading strategies.
📈The rest, we leave to the balance of probabilities.
💡Fail to plan. Plan to fail.
🏆It has always been that simple.
❤️Good luck with your trading journey, I shall see you at the very top.
🎯Trade consistent, FRGNT X

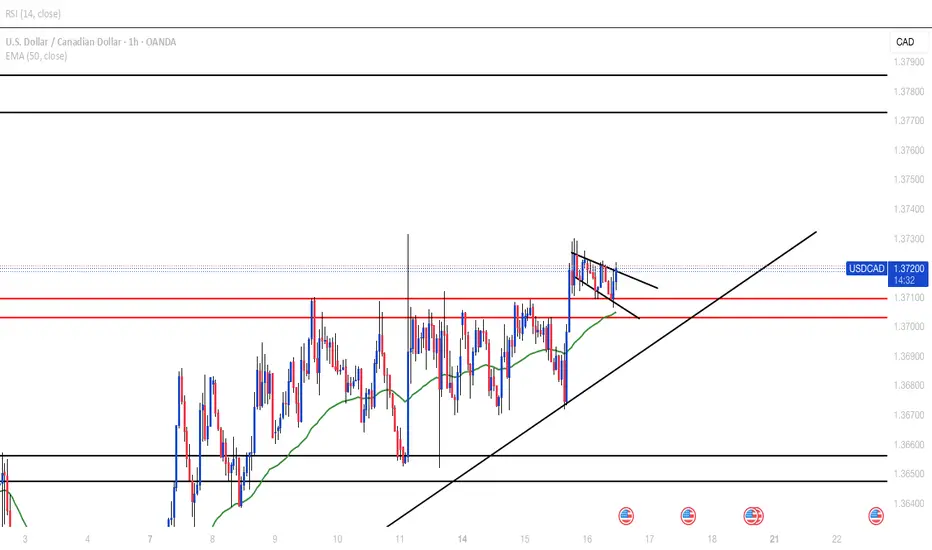
possibility of uptrendConsidering the price behavior in the current resistance range, possible scenarios have been identified. With the resistance range broken and stabilized above, a continuation of the upward trend is likely.

usd cad cup and handleit seems the handle is broken and if you touch the body you may burn your hand, for archiving the matter im doing this idea feel free to comment and share your ideas
