sell from pivotgood RR
on Daily chart I saw down trend
so I was looking for sell
price now is retsting the pivot
that was resistance, broke down and now may be support for continuing the down trend
CADUSD trade ideas
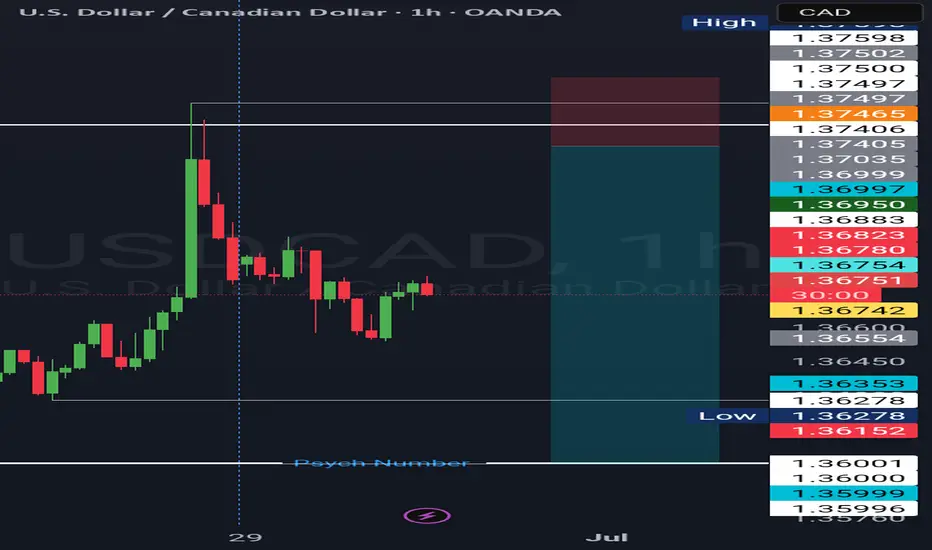
USDCAD H1 I Bearish Reversal Based on the H1chart analysis, the price is approaching our buy entry level at 1,3623, a pullback support.
Our take profit is set at 1.3697, a pullback resistance that aligns with the 61.8% Fib retracement.
The stop loss is placed at 1.3590, a swing low support.
High Risk Investment Warning
Trading Forex/CFDs on margin carries a high level of risk and may not be suitable for all investors. Leverage can work against you.
Stratos Markets Limited (tradu.com ):
CFDs are complex instruments and come with a high risk of losing money rapidly due to leverage. 63% of retail investor accounts lose money when trading CFDs with this provider. You should consider whether you understand how CFDs work and whether you can afford to take the high risk of losing your money.
Stratos Europe Ltd (tradu.com ):
CFDs are complex instruments and come with a high risk of losing money rapidly due to leverage. 63% of retail investor accounts lose money when trading CFDs with this provider. You should consider whether you understand how CFDs work and whether you can afford to take the high risk of losing your money.
Stratos Global LLC (tradu.com ):
Losses can exceed deposits.
Please be advised that the information presented on TradingView is provided to Tradu (‘Company’, ‘we’) by a third-party provider (‘TFA Global Pte Ltd’). Please be reminded that you are solely responsible for the trading decisions on your account. There is a very high degree of risk involved in trading. Any information and/or content is intended entirely for research, educational and informational purposes only and does not constitute investment or consultation advice or investment strategy. The information is not tailored to the investment needs of any specific person and therefore does not involve a consideration of any of the investment objectives, financial situation or needs of any viewer that may receive it. Kindly also note that past performance is not a reliable indicator of future results. Actual results may differ materially from those anticipated in forward-looking or past performance statements. We assume no liability as to the accuracy or completeness of any of the information and/or content provided herein and the Company cannot be held responsible for any omission, mistake nor for any loss or damage including without limitation to any loss of profit which may arise from reliance on any information supplied by TFA Global Pte Ltd.
The speaker(s) is neither an employee, agent nor representative of Tradu and is therefore acting independently. The opinions given are their own, constitute general market commentary, and do not constitute the opinion or advice of Tradu or any form of personal or investment advice. Tradu neither endorses nor guarantees offerings of third-party speakers, nor is Tradu responsible for the content, veracity or opinions of third-party speakers, presenters or participants.

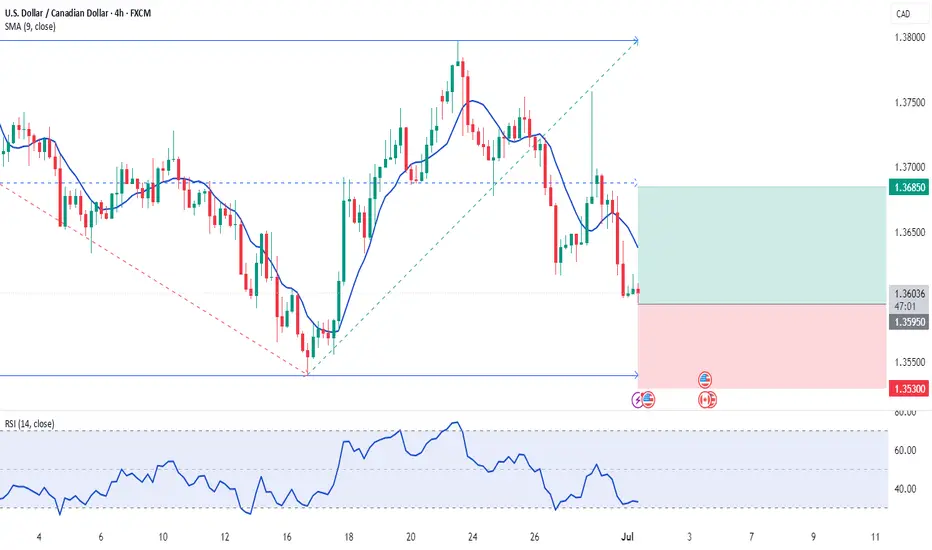
01.07.02025 #USDCADBUY 1.35950 | STOP 1.35300 | TAKE 1.36850 | Upward price movement from the levels of the local support range.
USDCAD Expected Growth! BUY!
My dear friends,
My technical analysis for USDCAD is below:
The market is trading on 1.3649 pivot level.
Bias - Bullish
Technical Indicators: Both Super Trend & Pivot HL indicate a highly probable Bullish continuation.
Target - 1.3697
Recommended Stop Loss - 1.3624
About Used Indicators:
A pivot point is a technical analysis indicator, or calculations, used to determine the overall trend of the market over different time frames.
Disclosure: I am part of Trade Nation's Influencer program and receive a monthly fee for using their TradingView charts in my analysis.
———————————
WISH YOU ALL LUCK

USDCADHere’s a detailed breakdown. Of course, those fully engaged in trading will understand this right away. Basically, when the price reaches the D point zone (ABCD pattern), we start looking for a short setup. Most likely, the price will move toward the projected target zone — and that’s what we’re aiming for.
For those who are impatient, there are also two potential entry zones for long trades. As you can see, there’s a white trendline on the chart. The first buy setup is from the area after a retest of this trendline. The second long opportunity appears if the price breaks above the 61.8% Fibonacci zone — in that case, you can buy again on the retest, aiming for the TP zone.

USDCAD LONG DAILY FORECAST Q3 D1 W27 Y25USDCAD LONG DAILY FORECAST Q3 D1 W27 Y25
IS USDCAD FINALLY READY TO LONG !
Professional Risk Managers👋
Welcome back to another FRGNT chart update📈
Diving into some Forex setups using predominantly higher time frame order blocks alongside confirmation breaks of structure.
Let’s see what price action is telling us today! 👀
💡Here are some trade confluences📝
✅Daily Order block identified
✅4H Order Block identified
✅1H Order Block identified
🔑 Remember, to participate in trading comes always with a degree of risk, therefore as professional risk managers it remains vital that we stick to our risk management plan as well as our trading strategies.
📈The rest, we leave to the balance of probabilities.
💡Fail to plan. Plan to fail.
🏆It has always been that simple.
❤️Good luck with your trading journey, I shall see you at the very top.
🎯Trade consistent, FRGNT X
USDCAD OVERVIEW I am bearish on USDCAD.I will be looking more for sells.CAD is also largely influenced by Oil but remember their have been also bearish outlook on the dollar.Dollar weakness is a big factor

USDCAD -bias long Bullish indications :
Inverted hammer candle daily
previous day support respected.
IHS formation in 1 hr at higher low.
Fib level 0.786 respected and bounced
Bearish indications:
LLLH in daily frame.
Trade plan buy stop at 1.36766
SL:1.3651
TP1:1.37034
TP2:1.3730

USDCAD Is Going Up! Buy!
Please, check our technical outlook for USDCAD.
Time Frame: 2h
Current Trend: Bullish
Sentiment: Oversold (based on 7-period RSI)
Forecast: Bullish
The market is approaching a key horizontal level 1.356.
Considering the today's price action, probabilities will be high to see a movement to 1.360.
P.S
We determine oversold/overbought condition with RSI indicator.
When it drops below 30 - the market is considered to be oversold.
When it bounces above 70 - the market is considered to be overbought.
Disclosure: I am part of Trade Nation's Influencer program and receive a monthly fee for using their TradingView charts in my analysis.
Like and subscribe and comment my ideas if you enjoy them!

USDCAD Will Go Up From Support! Buy!
Please, check our technical outlook for USDCAD.
Time Frame: 1h
Current Trend: Bullish
Sentiment: Oversold (based on 7-period RSI)
Forecast: Bullish
The market is approaching a key horizontal level 1.365.
Considering the today's price action, probabilities will be high to see a movement to 1.369.
P.S
Please, note that an oversold/overbought condition can last for a long time, and therefore being oversold/overbought doesn't mean a price rally will come soon, or at all.
Disclosure: I am part of Trade Nation's Influencer program and receive a monthly fee for using their TradingView charts in my analysis.
Like and subscribe and comment my ideas if you enjoy them!

SELL POI expectancy USDCAD approaching Friday high,800Ema and a round number 1.3750 and hopefully we might get a rejection around that zone before it starts selling
USDCAD – Long Bias LiveUSDCAD – Long Bias Live
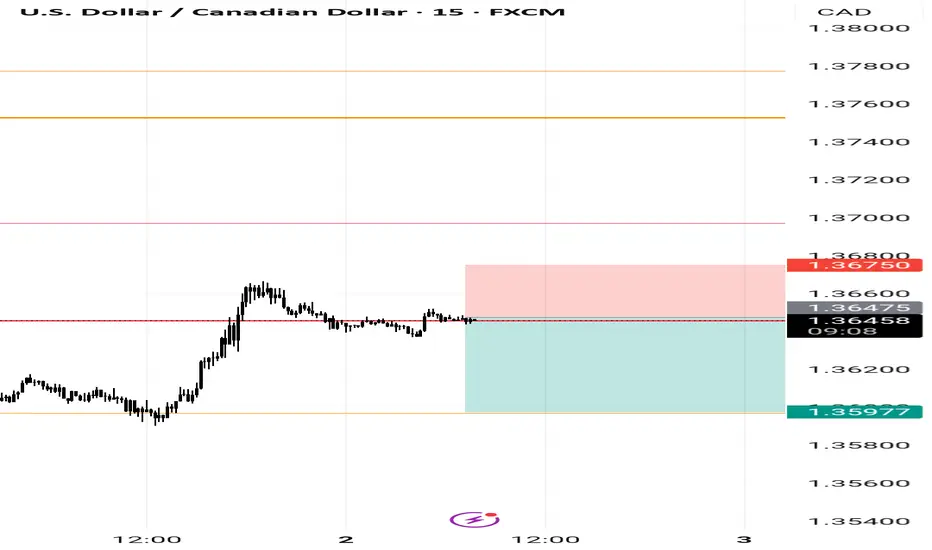
🔹 Entered long near market open at ~1.36780
🎯 Target: 1.37112 (previous swing area highlighted)
⏳ Expect to hold into next London/New York session
After a sharp spike up into the yellow zone (~1.37283) and subsequent retrace, price has found support around 1.36780 (lower white curve). I’m anticipating a bounce back up toward the red resistance band at 1.37112 (former swing level).
• Entry: ~1.36780 support
• Target: 1.37112 resistance
• Timeframe: 15 min chart, swing through today’s London open
All setups can be replayed on TradingView for confirmation.
⚠️ Not financial advice—always trade with proper risk management!
#USDCAD #Forex #TradingView #PriceAction #SwingTrade

CADUSD - BullishMarket formed a BUllihs divergence on 1H time frame followed by the inverse H&S pattern. Market broke the last LH, and then formed the 1st HH and HL and 2nd HL is being formed. which is clear sign of bullish trend. we take instant entry and place our SL below the right Shoulder of pattern.
we anticipate the market to remain bullish and put TPs 1 and 2 accordingly with 1:1 and 1:2 R:R ratio.
Happy Trading Guyz .

Is it too late for a TACO trade on USD/CAD? USD/CAD jumped nearly 900 pips on Monday after President Donald Trump announced he is “terminating” trade negotiations with Canada. But the surge didn’t stick. Within hours, the pair gave up most of its gains, slipping back below the 1.3700 breakout level.
There’s been no reversal from Trump — not yet. But price action suggests the market might be front-running one. Traders have seen this before: the “TACO” setup — Trump Always Chickens Out.
In that context, traders may be cautious about chasing the spike without confirmation that the trade breakdown will be long-lasting. The USD/CAD trade now hinges on updates from Trump for more TACO setups.
If USD/CAD stays below 1.3700, the focus shifts back to 1.3628 and possibly lower. Below that, the long-term structure suggests a broader range between 1.3500 and 1.3770.

USDCAD possible Long ideaUSDCAD seems to have turned bullish and doing a retracement in H4.
Based on existing confirmation, there is a chance that it reach to liquidity level 1.37392
This is for educational purpose only. Not an investment or financial advise.

USDCAD - Bullish Story: Strong Bullish rally from previous - Market make a corrective move till 0.382 level of FIB and followed by Bullish Flag pattern.
Anticipate : we anticipate market to continue the bullish trend and we plan our entry on the breakout of flag neck line.
PLAN : entry point is break of neckline level, TPs will be as projected through Pole of FLAG.

USDCAD RT of Supply Zone then ShortPrice has retraced back into a key supply zone just under the June High. We are now watching for strong bearish price action (PA) to confirm a potential short entry from this area.
Key Zone to Watch:
Supply Zone: 1.3756 – 1.3796
Optimistic stops can be placed above the zone if strong rejection occurs
Plan:
Seek bearish PA within the highlighted supply zone
Wait for confirmation via a bearish candle close
Enter below the trigger candle once setup forms
Targets:
Target 1: 1.3622
Extended Target / June Low: 1.3543
If no rejection occurs and price breaks above the zone with conviction, the setup becomes invalid and we reassess.
Execution will be reactive, not predictive — we trade confirmation, not speculation.

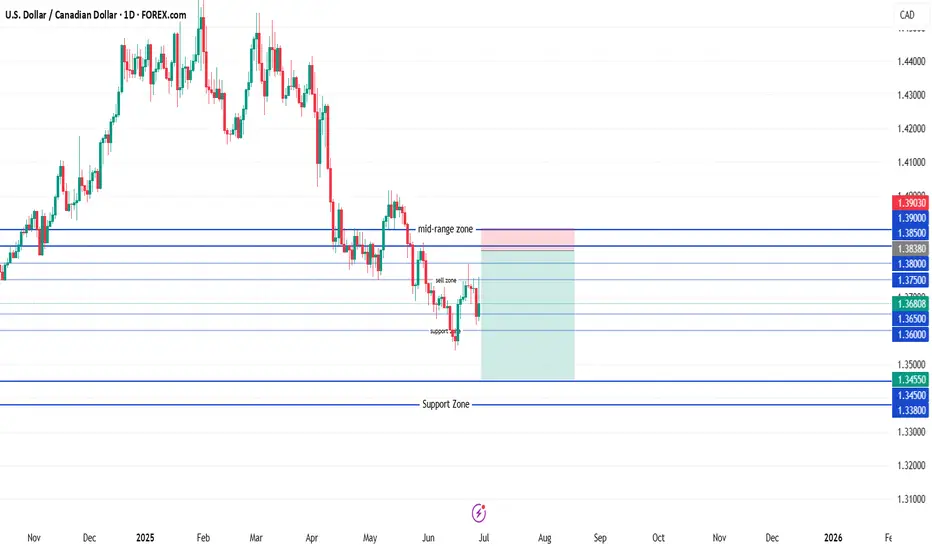
USD/CAD ShortSell-limit order: 1.3838
Stop-loss: 1.3903
Target 1: 1.3705
Target 2: 1.3605
Target 3 (optional runner): 1.3455
Place the limit at 1.3838 and keep the stop above 1.3900; scale out at the listed targets as price moves in your favor.
Should we keep an eye on it?!Hello friends..
This week we should be more on the chart, because most of the charts are in an attractive range for trading.
What our team sees is that the chart (US Dollar to Canadian Dollar) has hit a good range that we previously identified in the daily time frame and has managed to change the trend from a bearish to an upward trend. In the 4-hour time frame, the price shows us the trend change. Now we have to wait and look for a buy trade in the specified range.
The target for this trade can also be 1.3924.
It should be noted that as long as the price does not break the swing low (the line at the bottom) with the candle body, the trend remains upward.
So this week you can put this chart on your watch list.
You can follow our page to see more analysis.

USDCAD ( Weekly CLS Setup) Everything is clear here: a bearish order flow, with signs of manipulation and liquidity grabs above the structure highs. EUR/USD is trending upwards, presenting a good opportunity for a short trade on USD/CAD

When Charts Lie: How Fundamentals Rescued My Forex TradingEvery trader knows the frustration: your analysis is technically flawless, but the market moves against you. I learned this brutally in Q1 2024 when my USD/CAD short—backed by textbook bearish divergence and order block rejection—got steamrolled by a 190-pip rally after Canada’s surprise oil export announcement.
The Blind Spot in Pure Technicals
Price action traders often dismiss fundamentals as "noise," but three scenarios consistently break chart-based systems:
Policy Surprises (SNB removing EUR/CHF floor)
Geopolitical Shocks (Rubles during Ukraine invasion)
Structural Shifts (BOJ abandoning YCC)
These events share one trait: they change the market’s fundamental DNA, invalidating historical patterns.
A Practical Filter
I need to train myself to do something like this: To overlay two fundamental checks before technical entries:
Central Bank Calendar
No trades 12 hours before scheduled meetings
Monitor yield spreads (10YR US vs. DE)
Commodity Links
AUD/USD: Iron ore inventories
USD/CAD: WTI backwardation
Case Study: April 2024 GBP/USD
Technicals suggested continuation above 1.2700
Fundamental red flag: UK real wages shrinking
Outcome: False breakout, 140-pip drop
Your Turn
Try this today: On your next trade, ask:
Is there scheduled event risk?
Does this align with rate expectations?
Are commodities/equities confirming?
The goal isn’t perfection—it’s avoiding obvious mismatches.
For me, I read my own words on what should be done, and most probably, I won't do it. I think the above is too much. I believe there must be an easier way to merge Technical and Fundamental Analysis.

USD/CAD💰Symbol: { USD/CAD }
🟩Price: { 1.36868 }
🟥Stop: { 1.37236 }
1️⃣profit: { 1.36594 }
2️⃣profit: { 1.36183 }
3️⃣profit: { 1.35893 }
4️⃣profit: { 1.35562 }
📊Check your chart before entering.
🚨Check before use to make sure there is no important news.🚨

USD/CAD MILKEDUSD/CAD MILKED we went long on this trade as price delivery switched from a bearish program to a bullish program easy trades, easy setups
