CAKEUSD trade ideas


Expecting $CAKE heading to $40CAKE broke out resistance line, was trading an in uptrend channel, based on fib extension, we are probably go retest the trend line break out and head to the $40 fib level.


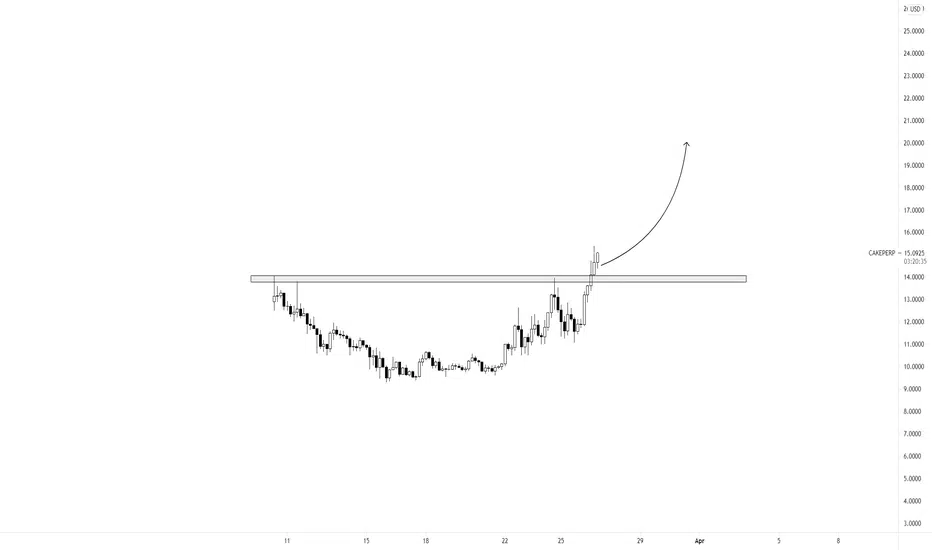
A clear indication as to why this is a bullish up trend I have 0 experience doing TA
If you listen to me you are retarded
:)


Bullish on CAKEIn my personal opinion, $CAKE could go up to 37$ in mid-term.
As we can see, even though the market dropped we touched the bottom line of the parallel channel and now we are riding the reversal patterns.
Pitchfork is showing us going straight up through fibonacci levels. We should withstand the support line and aim for the middle line of the parallel trend channel.
In case we fix in the middles, there is a high probability of us touching the upper side of the channel, which could lead up to 37$ level.
Goals: 24.7 - 26.7 - 28.3 - 33.7 - 37
SL: 21.2

CAKE/USDCake seems like a perfect Elliot wave set up. I've noticed when BNB is in an upward trend, cake is following. Going short to medium long.

Cake Potential BreakoutCake has been looking nice in this descending channel. With a double bottom followed by a break of the channel. Corrective structure has confirmed the upwards move.


PancakeSwap looking sweet!?Pancake Swap looking bullish if we get a retracement to 0.21 which is 0.382 on the fib this may be a good buy in point. The first move took 27 Days and it looks to be repeating the same pattern if so we may see something like this.?
Maybe it happens faster. A breakout would be at 0.26 probably a safer entry.
(NOT FINANCIAL ADVICE DYOR!)


PancakeSwap (CAKE) - April 9Hello?
Dear traders, nice to meet you.
By "following" you can always get new information quickly.
Please also ask for the "Like" clock.
Have a good day.
----------------------------------
Shortly after the chart was created, the support and resistance points are weak.
Check only the flow of the chart.
You should watch for any movement that deviates from the 19.4166740-21.9057849 section.
If you decline at 16.1961041, you need a short stop loss.
--------------------------------------
(CAKEBTC 1D chart)
3289 Satoshi-3686 Satoshi should be watched for any movement that deviates from it.
The next expected volatility period is around April 12th.
-------------------------------------------------- -------------------------------------------
** All indicators are lagging indicators.
So, it's important to be aware that the indicator moves accordingly with the movement of price and volume.
Just for the sake of convenience, we are talking upside down for interpretation of the indicators.
** The wRSI_SR indicator is an indicator created by adding settings and options from the existing Stochastic RSI indicator.
Therefore, the interpretation is the same as the conventional stochastic RSI indicator. (K, D line -> R, S line)
** The OBV indicator was re-created by applying a formula to the DepthHouse Trading indicator, an indicator that oh92 disclosed. (Thank you for this.)
** Check support, resistance, and abbreviation points.
** Support or resistance is based on the closing price of the 1D chart.
** All explanations are for reference only and do not guarantee profit or loss on investment.
Explanation of abbreviations displayed on the chart
R: A point or section of resistance that requires a response to preserve profits
S-L: Stop Loss point or section
S: A point or segment that can be bought for profit generation as a support point or segment
(Short-term Stop Loss can be said to be a point where profits and losses can be preserved or additionally entered through installment transactions. It is a short-term investment perspective.)
GAP refers to the difference in prices that occurred when the stock market, CME, and BAKKT exchanges were closed because they do not trade 24 hours a day.
G1: Closing price when closed
G2: Cigar at the time of opening
(Example) Gap (G1-G2)

Large CAKE Cup and handle on the dailyVery large cake cup and handle on the daily chart. Very interested to see if it hits target.

Cake trendlines and S&RHoping CAKE brakes the last highest resistance line. Thoughts on this timing? Might still be another day or so.

CAKE cup and handle. Not normally into patterns, but have been very successful with cup and handle. Interested in seeing how this one pans out?

CAKE cup and handle?Not normally into patterns, but been very successful with the cup and handle.. Interesting to see how this pans out?

CAKEUSD potential 10x ?looking at the strong performance of UNISWAP i wonder if we also could see a 5x or more gain on CAKEUSD, so far UNIUSD performed well...and pancakeswap is similar...