CakePancake swap
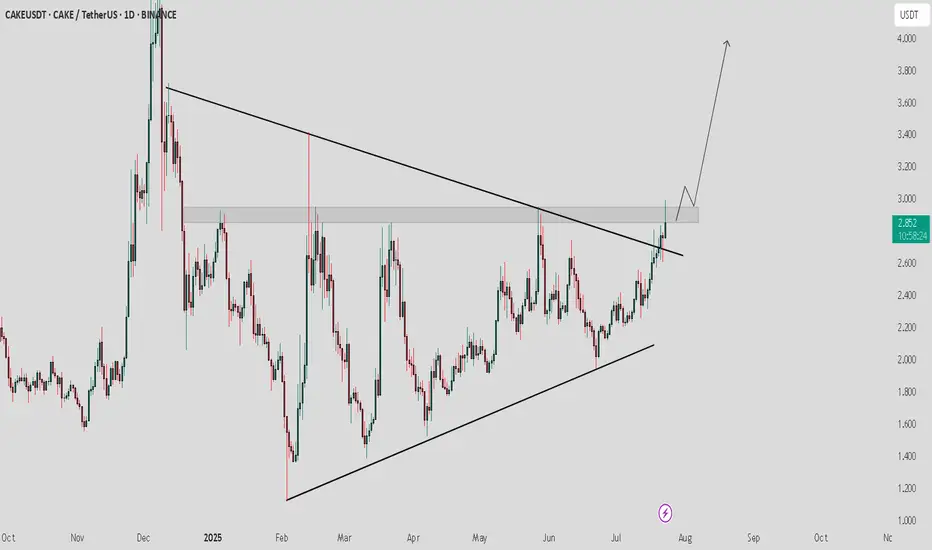
Cake usdt Daily analysis
Time frame daily
Risk rewards ratio >3.3 👈👌
Target 4$
If cake can break the resistance on 2.9 $ it can move up to my target
If can't break it my analysis is failed and must try at the other time
CAKEUSDT trade ideas

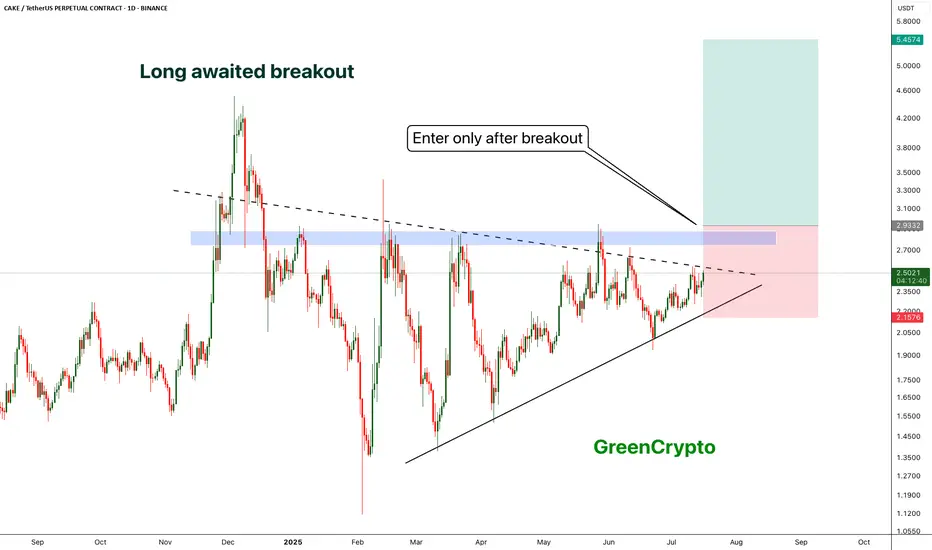
Pancake Swap (CAKE): Looking For Breakout | Bullish TrianglePancake looks good for long here, where we are at the last pressure point in that triangle pattern, which is hinting to an upcoming volatile breakout (or even breakdown, who knows).
Either way, based on the overall market status currently, we are looking more for the bullish breakout here, which would then need to be confirmed with a proper retest on smaller timeframes, which then again would give us a good opportunity for a long position!
Swallow Academy
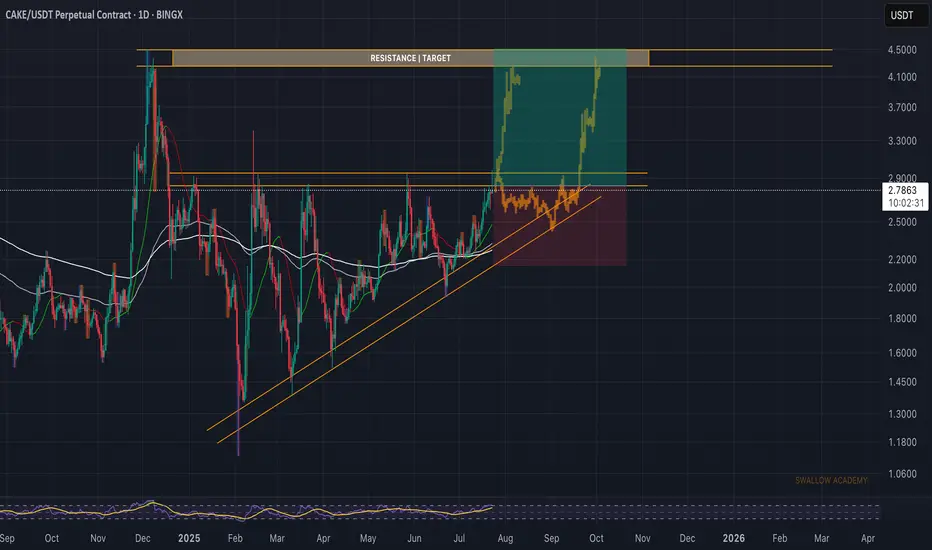
5$ is realistic target for CAKE- CAKE is trading inside the triangle since 2025
- now it seems like there is a possibility of breakout
- A clear breakout with decent volume would push the price towards 5$
- we will enter after the breakout
Entry Price: 2.9
Stop Loss: 2.15
TP1: 3.4371
TP2: 4.2671
TP3: 5.0083
Max Leverage 5x
Don't forget to keep stop loss
cheers
GreenCrypto
CAKE/USDT Bullish Trend Continues? Heres My Trade Plan📊 CAKE/USDT Trade Setup Overview
Taking a closer look at CAKE/USDT, price action has been moving nicely with a strong bullish trend on the 4H chart — printing consistent higher highs and higher lows 🔼📈.
Right now, it’s looking a little overextended, and I’m eyeing a potential pullback into my optimal entry zone around the 50%–61.8% Fibonacci retracement level 🎯📉.
That’s my point of interest, but it's important to keep in mind that the pullback may either be shallow or extend deeper before stabilizing 🌀. The key for me is to wait for price to find support in that zone, followed by a bullish break in market structure on the lower timeframe (15m or 30m) 🧱✅ — that would be my signal to enter long.
This is not financial advice — always do your own analysis before trading. ⚠️

CAKEUSDT - Weekly Breakout Watch | End of the Bear Era?After enduring a brutal multi-year downtrend since 2021, CAKE/USDT is now showing clear signs of a possible major trend reversal. The weekly chart is forming an extremely compelling setup, with the price testing the upper edge of a long-term descending trendline, signaling a high-probability breakout scenario.
📉 Multi-Year Downtrend Nearing Its End
The yellow descending trendline drawn from the 2021 all-time high has served as a strong resistance for over 3 years.
Price is now trading just below the trendline, teasing a breakout.
A clean breakout above this structure would mark the transition from distribution to re-accumulation — a key signal for long-term bulls.
📈 Pattern Structure & Key Zones
Descending Triangle Breakout in progress: This classical pattern often indicates a major reversal, especially after a long period of consolidation.
Breakout Trigger Zone: 3.45 – 4.18 USDT
Validation Zone (Confirmation Resistance): 4.75 USDT
Mid-Term Target Zone: 10.04 – 12.84 USDT
Long-Term Targets (If momentum continues): 24.75 – 40.86 USDT
🟢 Bullish Scenario
If weekly candles close convincingly above the 3.45 – 4.18 USDT range:
A breakout confirmation would be in place.
Price could rally +200% to the 10 – 13 USDT region in the mid term.
If that resistance breaks, the next leg could reach 24 – 40 USDT, in line with previous cycle recovery structures.
Strong altcoin sentiment and volume spike would strengthen the bullish case.
---
🔴 Bearish Scenario
Failure to break and hold above the trendline could trigger a rejection.
Breakdown below 2.84 USDT would invalidate the breakout and shift structure back to consolidation or downside.
In a worst-case scenario, price could revisit 1.05 USDT, the all-time cycle low.
This bearish outcome could be catalyzed by macro volatility or Bitcoin correction.
📌 Key Support & Resistance Levels
Level Significance
1.05 USDT Macro Support (Cycle Low)
2.84 USDT Accumulation Support
3.45 USDT Breakout Trigger
4.18 – 4.75 USDT Confirmation & Retest Zone
10.04 – 12.84 USDT Mid-Term Target
24.75 – 40.86 USDT Major Resistance Zone
📊 Conclusion
CAKE/USDT is at a critical inflection point. A breakout from this long-standing weekly trendline could spark a powerful multi-month rally. The current setup resembles early-stage reversals seen in other altcoins prior to explosive moves.
If confirmed, this breakout might mark the beginning of a new bull cycle for CAKE — but traders should stay disciplined and monitor volume and price action closely to avoid potential traps.
#CAKEUSDT #CryptoBreakout #TrendlineBreakout #WeeklyChart #AltcoinSetup #TechnicalAnalysis #PancakeSwap #CryptoReversal #AltcoinSeason

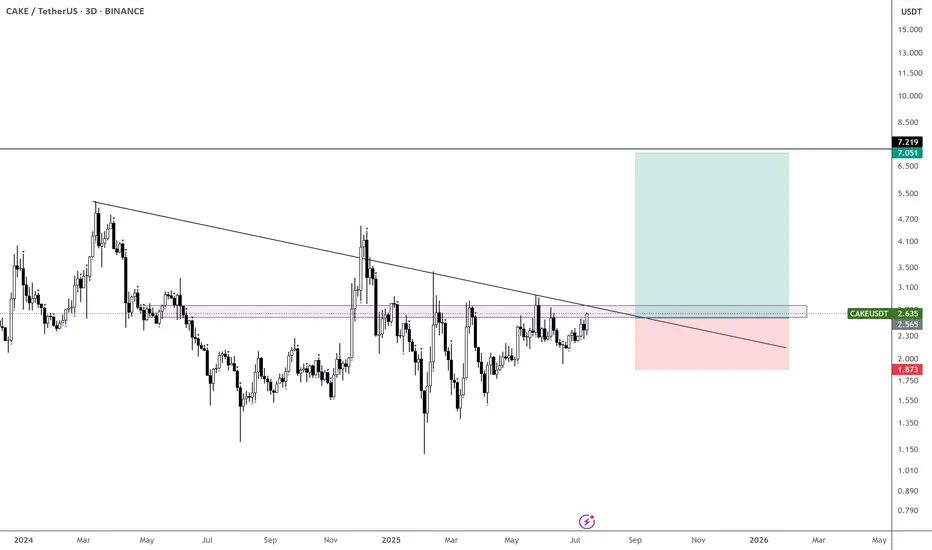
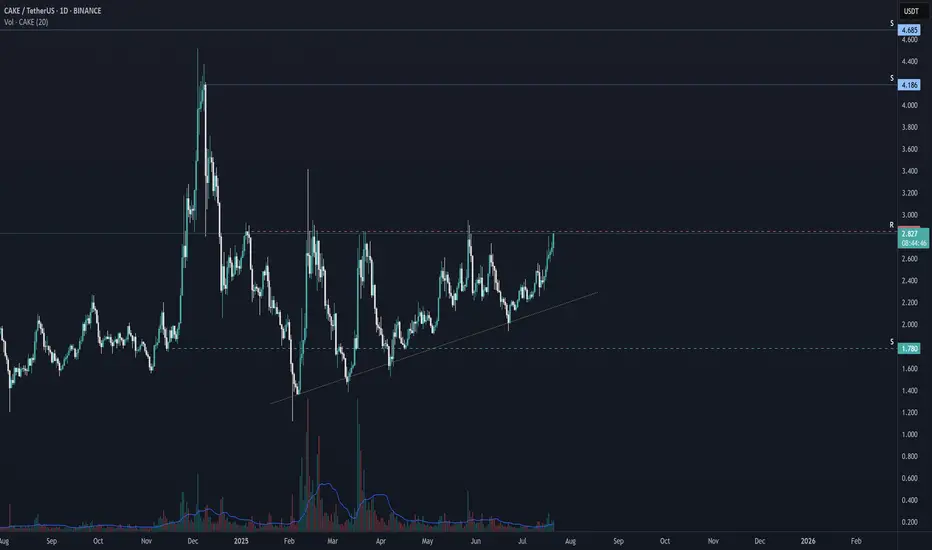
$CAKE is coiling up nicely - Aiming for $7
It hasn’t done much over the past few months, but it’s now above the yearly open and on its 6th attempt to break through the monthly supply zone.
Could this finally be the breakout that leads us toward $7?
Taking bids here and exercising patience.
With CRYPTOCAP:XRP , CRYPTOCAP:ETH , CRYPTOCAP:HBAR , and EURONEXT:ALGO already moving — and possibly CRYPTOCAP:BNB next — this could be a perfect setup for a delayed BINANCE:CAKEUSDT catch-up play.
CAKE / USDT : Trying to break horizontal resistanceCAKE/USDT - Triangle Breakout
CAKE/USDT is currently breaking out of a triangle pattern after a period of consolidation. The price is now testing the key resistance area at $2.80. Once this resistance is cleared, we can expect a strong bullish move towards $3.50 - $4.00.
Bullish Scenario:
Break above the $2.80 resistance confirms the breakout, targeting $3.50 - $4.00.
Pro Tip:
Watch for volume confirmation to ensure the breakout is sustainable. Set stop losses below the breakout zone to manage risk.
A hopeful CAKE breakoutWith all those consolidation inside the ascending triangle. I think it's time for NASDAQ:CAKE to breakout. If the market is allowing CAKE will be back on tracks soon.
CRYPTOCAP:BTC CRYPTOCAP:BNB CRYPTOCAP:ETH CRYPTOCAP:USDT AMEX:USD
Pancake (CAKE): Breakdown From Bullish Support Trend | BEARISHWell, we had a nice ride since last time, where price reached the pressure point and now is showing downside dominance, where sellers are dominating and resulting in a breakdown from the local support trend.
We are looking for further sell-side dominance and possibly a good ride to lower zones here, with our first target being at $1.50
Swallow Academy

CAKEUSDT UPDATE
Pattern: Falling Wedge Breakout
Current Price: \$3.199
Target Price: \$4.50
Target % Gain: 90.24%
Technical Analysis: CAKE has broken out of a long-term falling wedge on the daily chart, supported by strong bullish candles and increased volume. Price has cleanly closed above trendline resistance, indicating potential continuation toward \$4.50.
Time Frame: 1D

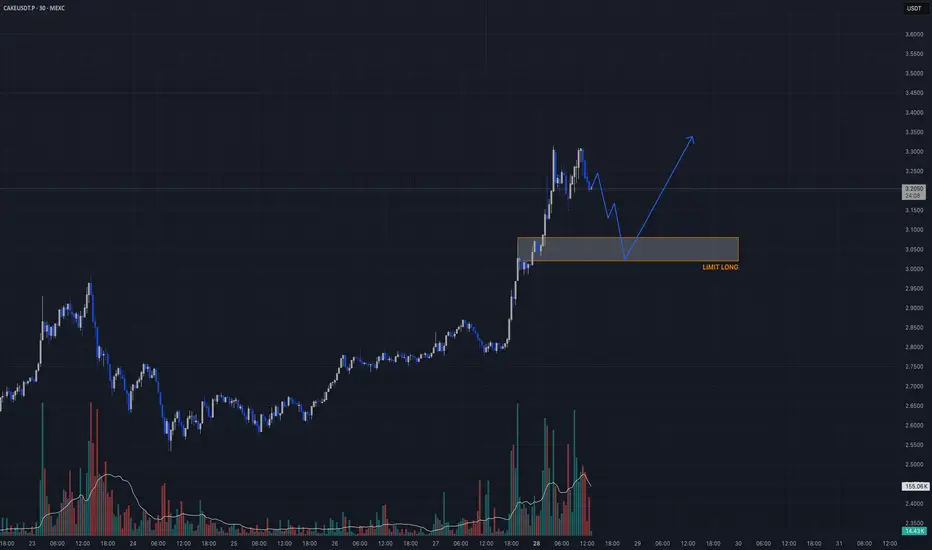
Breakout Retest (HTF Structure Shift)🔥 BINANCE:CAKEUSDT.P TRADE IDEA 🔥
📈 Bias: Long
🧠 Strategy: Breakout Retest (HTF Structure Shift)
📍 Entry Zone:
▫️ Entry: 3.02 – 3.08
🛡️ SL: 2.92
🎯 Take Profits:
▫️ TP1: 3.55
▫️ TP2: 3.88
▫️ TP3: 4.20+
Why?
– HTF breakout from long-term accumulation
– Bullish volume spike confirming trend shift
– Retesting OB + flipped structure
– 15m confirmation will validate entry
⚠️ Wait for a sweep + BOS or volume spike in entry zone
—
Posted by: Candle Craft | Signal. Structure. Execution.
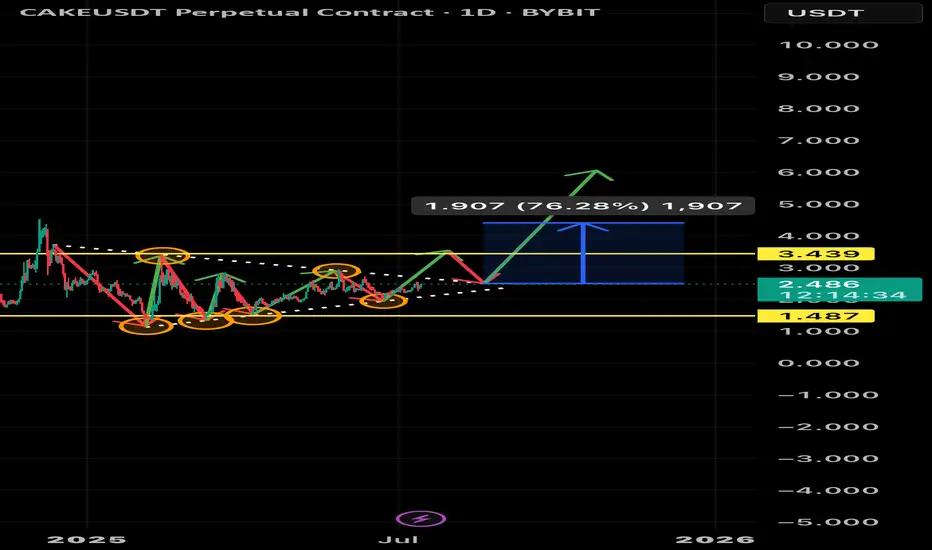
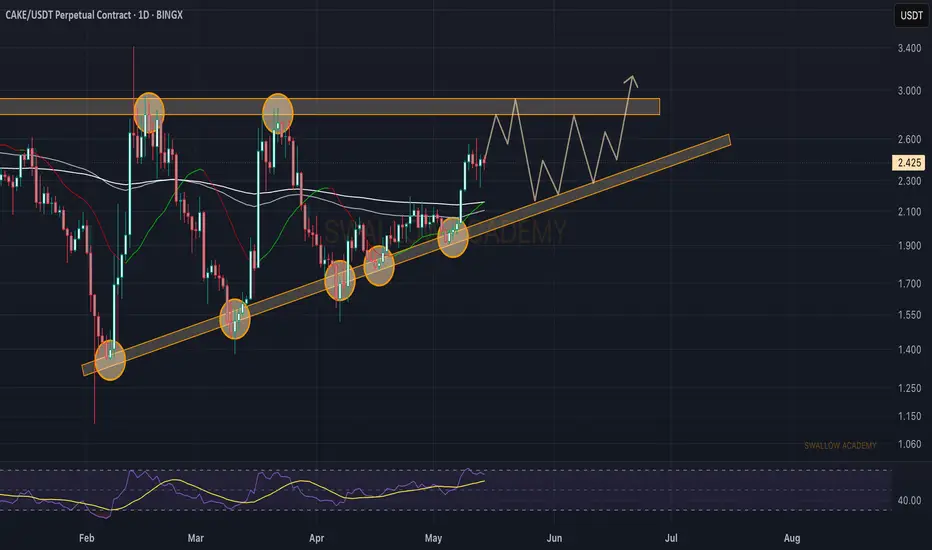
CAKEUSDT – Symmetrical Triangle Breakout Potential (1D Chart)The CAKE/USDT pair is currently consolidating inside a symmetrical triangle, showing signs of reduced volatility and building pressure. Multiple price reactions at both the upper and lower trendlines (highlighted with orange circles) confirm the triangle’s validity.
A breakout scenario appears likely, with a potential upward move of around 76%, targeting the $4.38 region. A key resistance level sits at $3.439, which may act as a pullback zone before continuation.
The support zone is well-defined near $1.487, and price has respected this level consistently.
If bulls manage to push through the triangle’s resistance, this could signal the beginning of a significant bullish leg in the coming weeks.
⚠️ As always, wait for confirmation before entering a trade and manage your risk accordingly.
#CAKE #Crypto #Breakout #TechnicalAnalysis #Altcoins #TradingView
CAKE : Are we left behind?Hello friends🙌
😉We came with a good currency analysis from the decentralized exchange Pancake Swap.
So you see that we have a good price support that buyers supported the price well after each collision.
🔊Now, considering the collision with this support, we can expect growth to the specified areas. Of course, don't forget that capital management and risk are the priority of trading.
🔥Follow us for more signals🔥
*Trade safely with us*

Pancake Swap (CAKE): Buyers Took Control Over EMAs | +22% ComingCAKE coin had recently dumped below the local triangle pattern, which would have been a good entry for a short position, but buyers took back control, it seems.
What we see is a slight pressure and dominance from buyers, which glides the price near the broken trend area, looking for explosive movement from here.
As soon as we see that break of structure near the current, we are going to look for a long, as long as buyers maintain the dominance over 200 and 100 EMA.
Swallow Academy

Pancake Swap (CAKE): Had a Good Breakout, Aiming For Upper AreaCake coin has done a nice upward movement since last touching the supportive trend, where the price has made so far 25% of the market price movement. We are now aiming to see the price reach as high as $2.90, from where we will be looking for smaller corrections to lower zones.
Swallow Academy
Pancake Swap (CAKE): Might Get Good Buy Entry SoonThe CAKE coin can make a good % upward movement if buyers manage to secure certain zones and enter back into that bullish channel we had!
More in-depth info is in the video—enjoy!
Swallow Academy

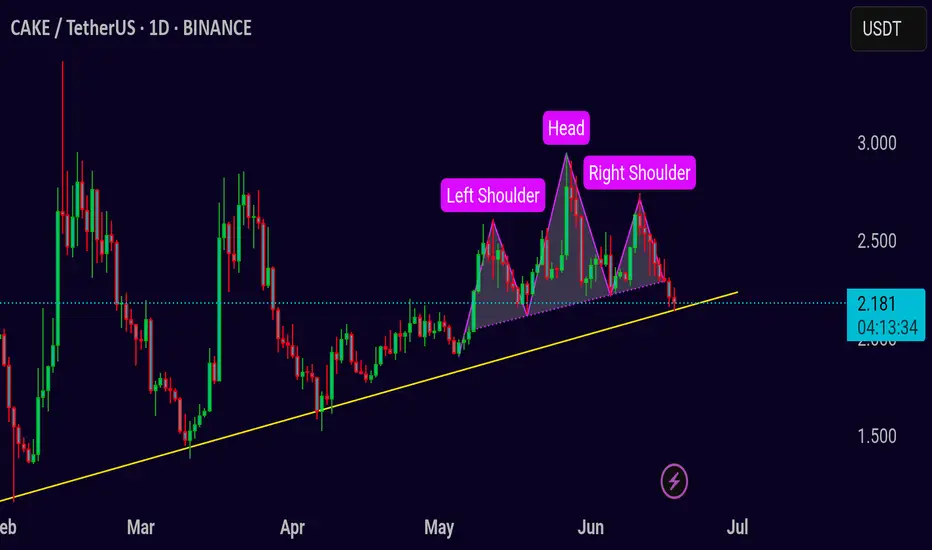
CAKE/USDT – Head & Shoulders Breakdown in Play Pair: CAKE/USDT 💱
Timeframe: 1D 📅
Pattern: Head and Shoulders Top 🧠
CAKE is developing a clear head and shoulders pattern on the daily chart, often seen as a bearish reversal setup. Price is currently testing the neckline support around 2.18, which also aligns with an ascending trendline. A breakdown here could trigger downside continuation.
Bearish scenario ❌
If CAKE closes below the neckline and trendline (under 2.15–2.10):
🎯 Target 1: 1.85
🎯 Target 2: 1.55
🛑 Stop loss: above 2.45 (right shoulder top)
Bullish reclaim ✅
If bulls defend the neckline and reclaim 2.35 with strong volume, the pattern may invalidate and lead to a rally.
⚠️ Volume confirmation is key — wait for a clean break and retest for confirmation.
CAKE/USDT R/R:6CAKE is holding strong above the key $2.20 level. For over 550 days, it has been consolidating within a gigantic box structure — a powerful pattern indicating potential for a major breakout.
This extended accumulation phase suggests significant strength, and any sustained move above the upper boundary could trigger explosive upside.
TP#1: $ 2.77
TP#1: $ 3.27
TP#1: $ 4.19
SL: 2.1

CAKE long "@members CAKE long up to Monday high than yearly open"
Swing long CAKE play form 200EMA 4h, PA looks like slow accumulation holding MO aiming for red boxes, trade taken 7th June

#CAKE/USDT#CAKE
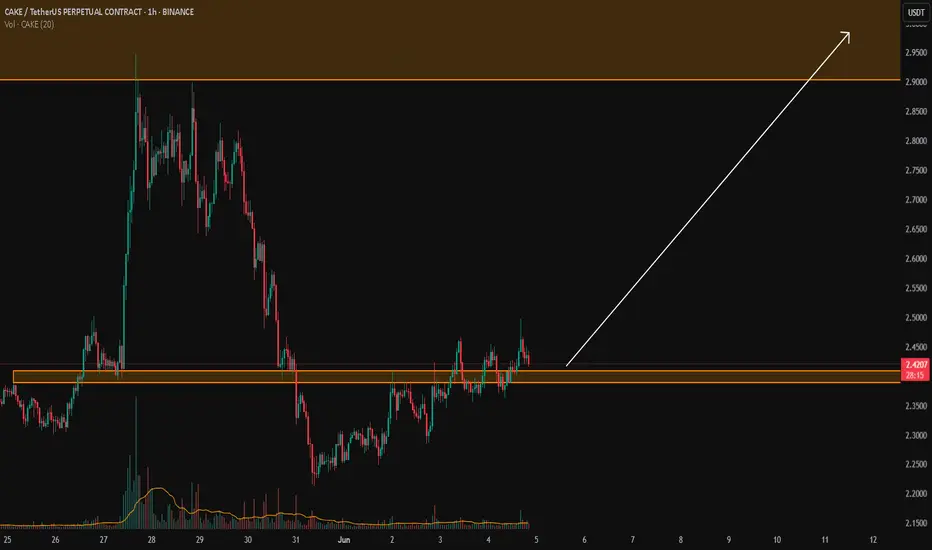
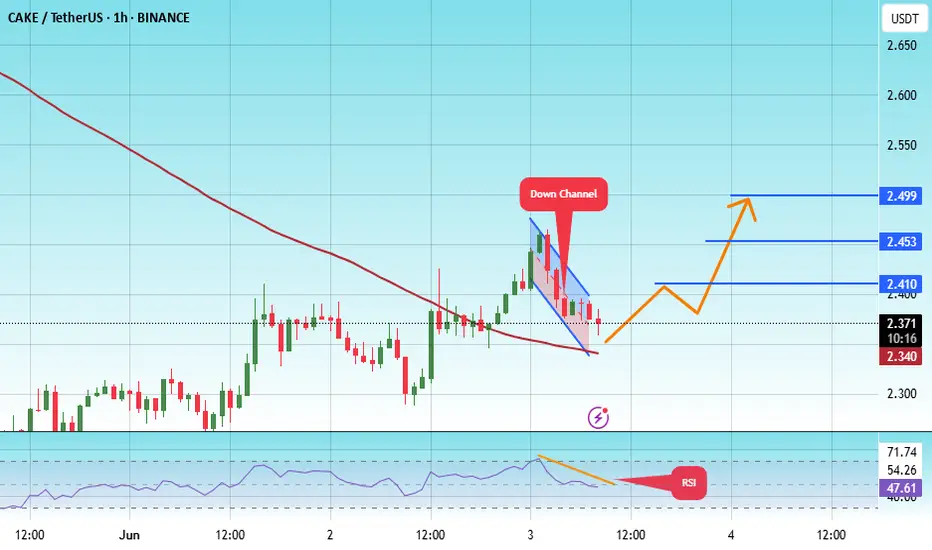
The price is moving within a descending channel on the 1-hour frame and is expected to break and continue upward.
We have a trend to stabilize above the 100 moving average once again.
We have a downtrend on the RSI indicator that supports the upward move with a breakout.
We have a support area at the lower limit of the channel at 2.29, acting as strong support from which the price can rebound.
Entry price: 2.30
First target: 2.35
Second target: 2.40
Third target: 2.46

#CAKE/USDT#CAKE
The price is moving within a descending channel on the 1-hour frame, adhering well to it, and is heading towards a strong breakout and retest.
We are experiencing a rebound from the lower boundary of the descending channel, which is support at 2.35.
We are experiencing a downtrend on the RSI indicator that is about to break and retest, supporting the upward trend.
We are heading towards stability above the 100 Moving Average.
Entry price: 2.38
First target: 2.41
Second target: 2.45
Third target: 2.50
CAKE 4H Analysis: Preparing for Breakout or More Rejection?🍰 CAKEUSDT
In the 4-hour timeframe, CAKE has printed a red candle at key resistance, signaling short-term selling pressure. However, if this doesn’t lead to a deeper move down, it could indicate that overhead supply has been cleared, potentially setting the stage for an upside breakout.
---
🟢 Long Setup:
📍 Entry Trigger: Break and close above $2.464
🛡️ Stop-loss Options:
Conservative: Below $2.41
Safer: Below $2.40
📈 Momentum Confirmation:
✅ If RSI crosses above 64 on the 1-hour timeframe, it adds further bullish confirmation for the long setup
---
🚨 Key Resistance to Watch:
Major resistance sits at $2.86
⚡ If price fails to trigger above $2.464, consider waiting for a confirmed breakout above $2.86 as an alternative long entry
---
✅ Summary:
CAKE is at a technical decision point. If current selling pressure fades and RSI supports momentum, the setup above $2.464 becomes attractive. Watch closely for volume spikes and RSI behavior to confirm strength.

CAKE/USDTKey Level Zone: 2.3880 - 2.4080
HMT v8.1 detected. The setup looks promising, supported by a previous upward/downward trend with increasing volume and momentum, presenting an excellent reward-to-risk opportunity.
HMT (High Momentum Trending):
HMT is based on trend, momentum, volume, and market structure across multiple timeframes. It highlights setups with strong potential for upward movement and higher rewards.
Whenever I spot a signal for my own trading, I’ll share it. Please note that conducting a comprehensive analysis on a single timeframe chart can be quite challenging and sometimes confusing. I appreciate your understanding of the effort involved.
Important Note :
Role of Key Levels:
- These zones are critical for analyzing price trends. If the key level zone holds, the price may continue trending in the expected direction. However, momentum may increase or decrease based on subsequent patterns.
- Breakouts: If the key level zone breaks, it signals a stop-out. For reversal traders, this presents an opportunity to consider switching direction, as the price often retests these zones, which may act as strong support-turned-resistance (or vice versa).
My Trading Rules
Risk Management
- Maximum risk per trade: 2.5%.
- Leverage: 5x.
Exit Strategy
Profit-Taking:
- Sell at least 70% on the 3rd wave up (LTF Wave 5).
- Typically, sell 50% during a high-volume spike.
- Adjust stop-loss to breakeven once the trade achieves a 1.5:1 reward-to-risk ratio.
- If the market shows signs of losing momentum or divergence, ill will exit at breakeven.
The market is highly dynamic and constantly changing. HMT signals and target profit (TP) levels are based on the current price and movement, but market conditions can shift instantly, so it is crucial to remain adaptable and follow the market's movement.
If you find this signal/analysis meaningful, kindly like and share it.
Thank you for your support~
Sharing this with love!
HMT v2.0:
- Major update to the Momentum indicator
- Reduced false signals from inaccurate momentum detection
- New screener with improved accuracy and fewer signals
HMT v3.0:
- Added liquidity factor to enhance trend continuation
- Improved potential for momentum-based plays
- Increased winning probability by reducing entries during peaks
HMT v3.1:
- Enhanced entry confirmation for improved reward-to-risk ratios
HMT v4.0:
- Incorporated buying and selling pressure in lower timeframes to enhance the probability of trending moves while optimizing entry timing and scaling
HMT v4.1:
- Enhanced take-profit (TP) target by incorporating market structure analysis
HMT v5 :
Date: 23/01/2025
- Refined wave analysis for trending conditions
- Incorporated lower timeframe (LTF) momentum to strengthen trend reliability
- Re-aligned and re-balanced entry conditions for improved accuracy
HMT v6 :
Date : 15/02/2025
- Integrated strong accumulation activity into in-depth wave analysis
HMT v7 :
Date : 20/03/2025
- Refined wave analysis along with accumulation and market sentiment
HMT v8 :
Date : 16/04/2025
- Fully restructured strategy logic
HMT v8.1 :
Date : 18/04/2025
- Refined Take Profit (TP) logic to be more conservative for improved win consistency