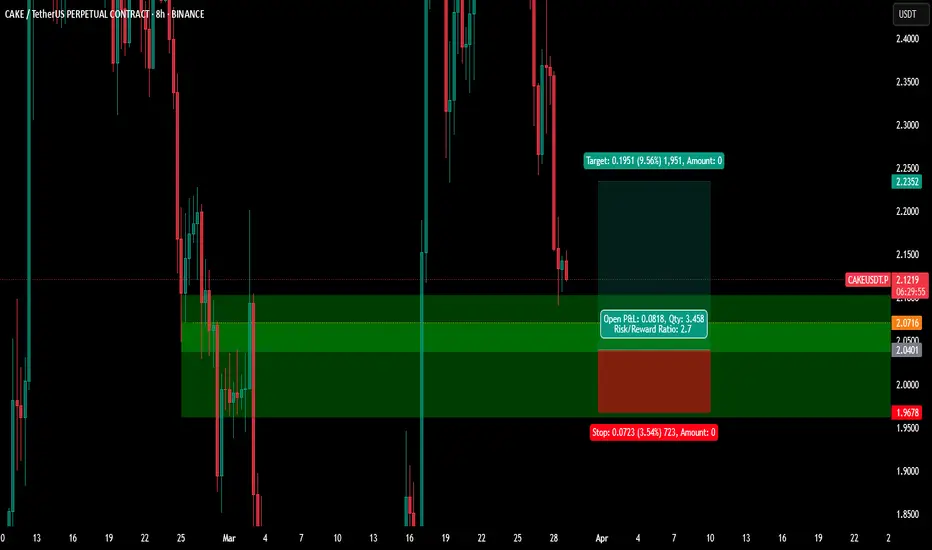
CAKE/USDT | Rising Wedge ⇒ Bearish ReversalCAKE/USDT | Rising Wedge ⇒ Bearish Reversal
Following my previous CAKE prediction—which delivered a +30% gain—the pair now looks poised to turn bearish again.
📈 Market Structure
Pattern: Rising wedge from April lows, with price compressing into higher highs and higher lows under converging blue trend-lines.
Implication: Wedges often break down as bullish momentum fades into the apex.
🎯 Supply / Short Zone
Zone: 2.257 – 2.380 USDT (blue–purple shaded area)
Lower edge aligns with the upper wedge trend-line.
Upper edge marks April’s horizontal resistance.
⚔️ Short Entry Strategies
Aggressive: Short on the initial test of 2.257–2.380 USDT with a bearish rejection signal.
Conservative: Wait for a confirmed reversal pattern near the zone.
🛑 Stop Loss
Level: Above wedge resistance at 2.45 USDT—allows for a false breakout while limiting risk.
🎯 Profit Targets
TP1: 2.135 USDT
TP2: 2.010 USDT
TP3: 1.840 USDT
🔧 Trade Management
Scale out partial positions at each TP to lock in gains.
Move stop to breakeven once TP1 is hit.
If price closes above 2.45 USDT, invalidate the setup and reassess.
CAKEUSDT trade ideas

CAKEUSDT 1D AnalysisCAKE ~ 1D Analysis
#CAKE Buy after successfully penetrating the resistant line from this pattern with a short -term target of at least 10%+


CAKEi am no days monitoring Cake and taking in consideration of the market conditions, it is about time that this project must make a move.
Long time now that Cake is totally oversold and under sell pressure, but if we see it in Daily tf, we could see that volume it is trying to increase and price going slowly up, if you see the oscillators on 4H tf, they show that it is full buy and knowing that some projects have already skyrocketed latest days, i would like to think that maybe even Cake must follow.
if breakout happens tomorrow as i could think it must, then i think Cake it will hit 2.8 - 3.5$
This is only for spot trade.
nfa
dyor

CAKE - Beautiful Signal/TA played out. 5.5% I was talking about this TA yesterday in group and wrote: "we go Long above that 4h Level" .
Boom !
5.5% till now 🎯 👌 😎
Look at my Pics below (posted in group).
Ichimoku and Fib bounce and break out of bigger yellow TL.
Follow for more ideas/Signals.💲
Just donate some of your profit to Animal rights or other charity :)✌️

CAKEUSDT Short Setup – Watching 2.40 Zone for RejectionHey Traders,
CAKEUSDT is currently trading within a well-defined downtrend, consistently forming lower highs and lower lows. The recent move appears to be a corrective rally, bringing price back toward a key daily resistance zone around 2.40, which also aligns with the descending trendline.
I’m monitoring this area closely for potential bearish price action to develop, signaling a continuation of the dominant bearish trend.
Key Confluences:
Major daily resistance at 2.40
Approaching descending trendline
Market still in a clear downtrend
Possible lower high formation in progress
Trade Plan:
If I see bearish confirmation in this zone (e.g. rejection candles, bearish structure break on lower timeframes, or weakening momentum).
A strong break and hold above 2.40 would invalidate the setup!

PancakeSwap Token: Your Altcoin Choice (S2)Bitcoin is now consolidating above $80,000. No bearish action is bullish action at this point in time. Sideways is bullish because there was strong buying and a confirmation of support after the last low. Bitcoin is consolidating before moving higher, additional growth.
PancakeSwap Token hit bottom in early February and has been growing. This pair never moves on its on. It has been growing from its base, higher lows and an ascending triangle is present on the chart.
PancakeSwap Token is bullish and building up strength for a bullish jump. The current price is trading above the November, September and August 2024 lows. What one does, the rest follows.
PancakeSwap hit bottom a long time ago and a new All-Time High in late 2025 can put prices above $44, that's more than 2,300% potential for growth. This is do-able, you will be surprised if you think this is not possible because it will be done.
Cryptocurrency is something amazing. It is highly predictable but at the same time it is hard to predict. We can easily get caught in the moment and forget that no matter what happens, the 4-year bull market is always something beyond expectations.
The 4-years cycle culminates now, in 2025, but not early 2025 rather late 2025 and in this case there is the possibility of an extension into 2026. Even if the bull market extends beyond 2025, there will be very, very strong growth this year and really high prices late 2025. So the market will grow and do so with maximum strength. Regardless if the peak happens this year or next year, we are set to experience the biggest growth cycle in a decade... Are you prepared?
Namaste.

Pancake (CAKE): Possible Good Short Incoming!Cake coin is showing similar moves just as we had on the 13th of February, where we then tested again the upper resistance trend, where before that we had a huge liquidity movement below the lower support trend.
We are expecting to see a similar movement where we should see soon a downward movement either from this zone or after having a quick liquidity hunting above that resistance zone.
We are keeping our eyes wide open right near this zone; it might be a good shorting zone.
Swallow Team

CAKEUSDT NEXT MOVESell after bearish candle stick pattern, buy after bullish candle stick pattern....
Best bullish pattern , engulfing candle or green hammer
Best bearish pattern , engulfing candle or red shooting star
NOTE: IF YOU CAN'T SEE ANY OF TOP PATTERN IN THE ZONE DO NOT ENTER
Stop lost before pattern
R/R %1/%3
Trade in 5 Min Timeframe, use signals for scalping

Who wants a piece of CAKEOne of my favorite charts right now: NASDAQ:CAKE 🍰
It’s been respecting the $1.50–$3.00 range beautifully.
Now that price is hovering near the lower bound… you know what that means.
Yep — looking for longs as long as the $1.50 support holds.📈

TradeCityPro | CAKE: Slicing Through the Market's Range Box👋 Welcome to TradeCity Pro!
Let's dive into the analysis of Bitcoin and key crypto indices, focusing today on the CAKE coin, as requested in the comments. This coin holds a market cap of $511 million, ranking 93rd on CoinMarketCap.
📅 Weekly Timeframe
In the weekly timeframe, as you can see, there's a very large range box existing from 1.093 to 4.753. This box represents a substantial range, and the price has been in this box for almost three years.
🔍 There's a significant area within this box at 1.549, which currently acts as a very important support. The price has hit this level several times but has yet to break through it.
⚡️ In this timeframe, indicators are not very useful because it's a ranging trend, and in ranging trends, these tools don't perform well. The best tool we can use to analyze a ranging market is support and resistance.
📊 Currently, there is a support at 1.549, as mentioned, which the price has hit several times and has been supported by. If this support breaks, there's another very important support at 1.093, which will be the last support area for the price.
🛒 For buying this coin in spot, there is a very strong supply zone near 4.753. I recommend waiting until this area is broken to start the main bullish trend. This break would signify a potentially strong upward move, so entering before this break could expose you to unnecessary risks given the current ranging conditions.
📝 Final Thoughts
This analysis reflects our opinions and is not financial advice.
Share your thoughts in the comments, and don’t forget to share this analysis with your friends! ❤️


Long Position CAKE/USDTPancakeSwap (CAKE) has entered a critical Long Zone between $1.48 – $1.64, where price historically found strong support before a major Long rally. After a prolonged downtrend, we’re now approaching a potential reversal zone.
🔹 Long Entry Zone: $1.48 – $1.64
🔹 Potential Upside Target: $2.82+
🔹 Rationale: Previous bounce zone + strong demand area
🟢 This is a high-reward opportunity for patient bulls waiting for a bottom formation. Watch closely for early signs of strength — if price holds and confirms a reversal, we may see a sharp push to the upside.
⚠️ Reminder: No entry without confirmation and risk management.

LONG Position CAKE/USDT#Singal
CAKE/USDT
🟢 LONG Position
🎲 Entry @ 1.856
✅ Target1@ 1.899
✅ Target2 @ 2.036
✅ Target3 @ 2.222
✅ Target4 @ 2.799
❌ Stop Loss @ 1.651
Leverage: 5X_15X
Margin: 10% of Wallet Balance
⚠️"Take Care of Risk Management for Your Account"

LONG CAKE/USDT#Singal
CAKE/USDT
🟢 LONG Position
🎲 Entry @ 1.908
✅ Target1@ 2.060
✅ Target2 @ 2.163
✅ Target3 @ 2.345
✅ Target4 @ 2.579
✅ Target4 @ 2.832
❌ Stop Loss @ 1.682
Leverage: 5X_15X
Margin: 10% of Wallet Balance
⚠️"Take Care of Risk Management for Your Account"

$CAKE Trade IdeaNASDAQ:CAKE is approaching a very good Liquidity region. A bounce from here is very likely.
What for $CAKE next?I am not fundamentally aware of what's in development on Pancakeswap. But when looking into the chart on daily, there is trendline acting as a support. One more bounce from trendline area and a breakout of the resistance at 2.84 largely in play. Let's see what's going to happen.
CRYPTOCAP:BNB NASDAQ:CAKE #Binance #Pancake #Swap

CAKE LONGCrypto Introduction
PancakeSwap is a BEP20 decentralized trading platform built on the Binance Smart Chain, which uses an automatic market maker mechanism to provide liquidity.
Reversal from 0.5, bullish retest of bullish candle formation

CAKEUSDT (PancakeSwap): Sweet Gains or Stale Trade?(1/9)
Good afternoon, everyone! ☀️ CAKEUSDT (PancakeSwap): Sweet Gains or Stale Trade?
With CAKE at $2.599, is this DEX token a tasty treat or a flat pancake? Let’s flip the details! 🔍
(2/9) – PRICE PERFORMANCE 📊
• Current Price: $ 2.599 as of Mar 25, 2025 💰
• Recent Move: Consolidating $2.6-$2.8, up from $2.34, per data 📏
• Sector Trend: Crypto steady, DeFi mixed amid trade tensions 🌟
It’s a flip-flop—value might be cookin’! ⚙️
(3/9) – MARKET POSITION 📈
• Market Cap: Approx $760M (292M circulating) 🏆
• Operations: Leading BNB Chain DEX, yield farming, staking ⏰
• Trend: Deflationary model burns 102% minted, per data 🎯
Firm in DeFi, but volatility’s the spice! 🚀
(4/9) – KEY DEVELOPMENTS 🔑
• Recent Surge: Up 45% earlier in March, per X posts 🌍
• Platform Updates: Expanded NFT marketplace, per web data 📋
• Market Reaction: High volume ($230M daily), showing interest 💡
Adapting to DeFi trends, cooking up growth! 🍳
(5/9) – RISKS IN FOCUS ⚡
• Regulatory Risks: Crypto scrutiny could hit DEXs 🔍
• Market Volatility: Crypto swings could drag price down 📉
• Competition: Other DEXs like Uniswap challenge, per data ❄️
It’s a risky recipe—watch the heat! 🛑
(6/9) – SWOT: STRENGTHS 💪
• DEX Leader: Top on BNB Chain, strong user base 🥇
• Deflationary Model: Burns tokens, potentially boosts value 📊
• High Volume: $230M daily, per data, shows activity 🔧
Got a sweet spot in DeFi! 🏦
(7/9) – SWOT: WEAKNESSES & OPPORTUNITIES ⚖️
• Weaknesses: Price volatility, regulatory fears 📉
• Opportunities: DeFi adoption, new features like lending 📈
Can it rise or get burned? 🤔
(8/9) – POLL TIME! 📢
CAKE at $2.599—your take? 🗳️
• Bullish: $3+ soon, DeFi booms 🐂
• Neutral: Steady, risks balance gains ⚖️
• Bearish: $2 drops, market sours 🐻
Chime in below! 👇
(9/9) – FINAL TAKEAWAY 🎯
CAKE’s $2.599 price reflects consolidation, with strengths in its platform and deflationary model, but risks from market volatility and competition persist. DCA-on-dips could be a strategy to average in over time, banking on long-term growth. Gem or bust?

Analyzing $CAKE🚀 Analyzing NASDAQ:CAKE
📊 Weekly Timeframe:
- Currently moving inside a Symmetrical Triangle, hinting at a possible breakout in the near future.
📊 4H Timeframe:
- Shows trading within an Ascending Channel, suggesting short-term bullish momentum.
👀 Keep an eye out for a breakout confirmation in either direction!

CAKE/USDT(BUY)hello friends
According to the price correction, we can now buy in steps and move with it until the specified goals.
*Trade safely with us*

CAKEUSD NEXT MOVESell after bearish candle stick pattern, buy after bullish candle stick pattern....
Best bullish pattern , engulfing candle or green hammer
Best bearish pattern , engulfing candle or red shooting star
NOTE: IF YOU CAN'T SEE ANY OF TOP PATTERN IN THE ZONE DO NOT ENTER
Stop lost before pattern
R/R %1/%3
Trade in 5 Min Timeframe, use signals for scalping

CAKEUSDT, its my favorite coin ...Hello everyone
Everything was shown on chart
if you have any question and need help send us messages
Thank you
AA
