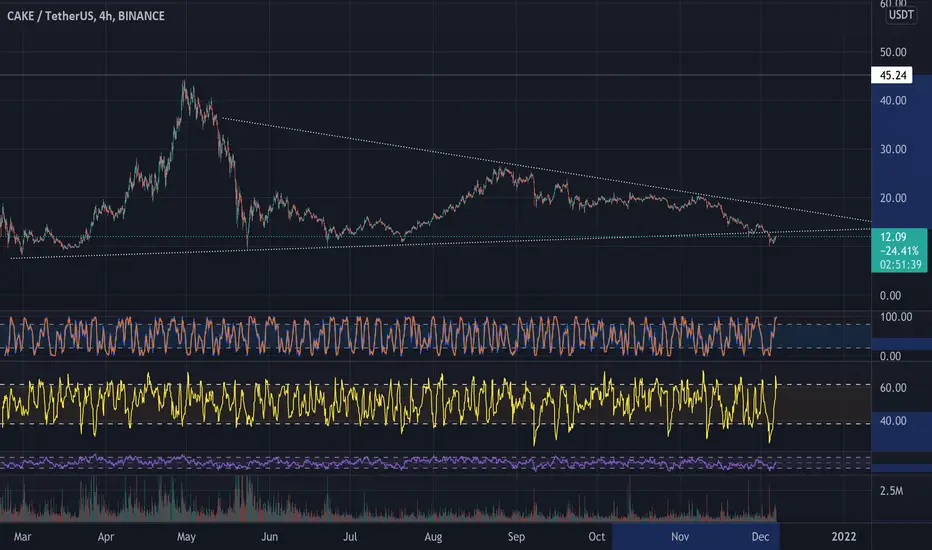
CAKEUSDT: SELLING PRESSURE ON PANCAKE SWAP, WILL IT GOES DOWN?Hello Enthusiast Coin Traders! Here's medium-term outlook for CAKEUSDT , Please give us the thumbs up and support the channel by Smashing the FOLLOW button :)
CAKEUSDT broke out of the Rising Wedge pattern. Rising Wedge Pattern indicates a potential bearish movement ahead. The MACD indicator starts crossing down below the zero level, it signify the potential bearish bias ahead.
The roadmap will be invalid after exceeding the resistance/target area.
DISCLAIMER:
This is only an outlook, not a recommedation to buy or sell the cryptocurrency.
CAKEUSDT trade ideas

bull run is a little fari think bull run is a little far from cake and the following pattern is probable

Cake Token Powerful Support ZoneThe Strong Support Zone: 9.7$ To 10.7$
This is a Big Signal for buying this Token.
We hope Price has reacted to this support zone.
you can see the analysis chart.

Cake right now is close to opportunity zone!Hello guys 😃
Before we start to discuss, I would be glad if you share your opinion on this post's comment section and hit the like button if you enjoyed it!
it's simple as drinking water! do not miss the chance, if the price hits 9$ zone(every time the price came near to this zone after a short time this coin pumped) do not hesitate and buy one step!
The mid-term target is MA200 for me.
Note: right now in the BSC chain, Cake has the most TVL! and it's $5.5b also mcap/tvl ratio is 0.5119.these parameters can show us investing in Cake has less risk than other coins for now!
Hope you enjoyed my analysis, You can support me with your likes and comments! (always open to hearing points from the others)
Attention: this isn't financial advice I'm just trying to share my vision and remember we must always see what's up with BTC after that go buy altcoins. never forget investment principles and do your research before investing.

CAKE USDT on its way to the ultimate lows, see my analyseHello dear friends
An analysis of Cake USDT. On the chart you find all the details. If Cake stays below the black trend line it is very likely to test the ultimate low.
The price has already bounced off the trend line and is on its way to the target. Does Cake break above the black trend line with good volume and stays there then we can go to the upside at around 17 USD. That is the declining black trend line.
So place the stop for shorts above the black trend line and for longs (only if it breaks the trend line upwards) below the black trend line.
Good luck and happy trading!
Disclaimer This is my view, no advice to buy or sell. Also always do your own research!
--->> Dear friends please follow me for updates and give me support with a like 👍 if you like me to continue this work. Thanks 💚

PancakeSwap H4 LongPancakeSwap H4 Long. The investment information, comments and recommendations contained herein are not within the scope of investment consultancy. Investment consultancy service is provided individually, taking into account the risk and return preferences of the individuals. The content, comments and recommendations contained herein are of a general nature, which are not in any way directive. These recommendations may not be suitable for your financial situation and risk and return preferences. Therefore, making an investment decision based solely on the information contained herein may not produce results in line with your expectations.

CAKE Descending TriangleCAKEUSDT
If the price breaks the lower side of the triangle, it can drop to 13$.

Good Time to Buy CAKEFor those looking for long term positions a good entry point would be here followed by staking in their syrup pool for a good return. Current rate is 75.67% APY.

CAKE.Usdt (Y21.P7.E1).Go longHi All,
As per the chart, makes sense to enter long.
All the best.
S.SAri

Short CAKEUSDReason:
1. Market has corrected nicely after a big drop, I think the market will be soon come back to downtrend or at least in sideways mode
2. Cake has performed better than other coins because of $77m-worth CAKE burning yesterday, this catalyst is no longer exist

CAKEUSDTThis symbol has hit a very important price floor and is expected to start moving upwards after the defeat of the trend line.

Cake can enter from here ::: midtermspot position :: midterm > long term
cake can give us good profit
NFA


CakeUSDCake is ranging now after making its TL, Now if my zone is holding then price should continue to break the TL
Once that happens we can anticipate for more buy opportunities,
Best Trade is to let the TL break and then enter based on market structure
Follow for more Crypto Grapy


cake usdt start moving upas you can see we have a nice return pattern (morining star) with good green long bar in daily timeframe and also volume is good
my idea is long : next (first)target 16 and stoploss 10
not a buy or sell offer


CAKE / USDT ready a pump !Cake is ready to pump.
Full Energy, RSi divergenton,
maybe to fly.... :)
Good Luck.
CAKEUSDTCake does not look good.
It should exit the downtrend to see a move up.
I don’t think it will break the last strong support.
No financial advice.
Corrections are welcome.
Have a nice day!

history repeats itselfartificial pump from the weekly burn, followed by a dump due to weak tokenomics and general bearish sentiment

Cake 1DCAKE has found strong global support. The price should break the downtrend line for a new uptrend. Fibo channels are indicated - resistance zones

$40 CAKE in December? Thank you Santa!
Nice multi-week flagging structure ready to breakout.
New ATH is possible.
Precondition:
- Orange zone has to hold.
- We have to break out of the descending channel.
- Price might retest the negative trendline upon break.
Buy inside the Orange Zone.
Sell inside the Red Zone.
NFA/DYOR please.

CAKEUSDT PENDING LONGS 💰💰💰The price is approaching a valuable area for DCA LONG TRADES on pankcakeswap, 10$ acts like a strong psychological barrier for the cake holders and i think it woudnt be broken and we will go back into 15/20/25$ area.
What do you think ? Commente below..
