CAKE updatewe have a triangle in hourly chart of #CAKE this can be a mean of a drop or a rising spike !
i think we have 2 scenarios once is rising from here or make more correction to the demand zone and then make a huge rise !
CAKEUSDT trade ideas

CAKE HIT THE DEMAND ZONE !#CAKE i made an analysis on this coin that it can make a correction to the next demand zone chekck this out
now the demand zone is hit so i think that cake is ready to rise again but its a possible move to make another correction before rising again

Cake Coin analysisAs you can see from the last crash of cake which is at 1$ price it did huge come back around 4$
Then it did the correction in my opinion the correction done because the period from dropping until recovery was 10 days and now from the top it did it until today its 10 days also
I think its the time to complete pulling up
This is not a financial advice its only my analysis for cake chart

CAKEvery very simple, if someone can read this chart and what the yellow line means... target 5$
very soon.
spot

Cake support + triangle breakoutCake currently sitting at 0,618 fibo retracement 2,316usd from recent local high 3,4usd. This support holds strong for now. Possible breakout from triangle will lead to new uptrend with target 5,187usd. Breaking down will lead to lower support 2,016usd.

CAKE what a nice signali have given s signal (not here on TV) on 16.02.
i forgot to post it on TV too.
now CAKE came to the damn exact point and gave 23% for long.
Unfortunately it is not possible to paste pictures from other sources here in TV :(
Follow for more ideas/Signals. 💲
Just donate some of your profit to Animal rights and rescue or other charity :)✌️

Cake is gonna increase moreThanks to the TST token and rising volume on PancakeSwap, we saw CAKE pump hard today! If the price dips back to my ‘safe zone’ from the chart, I’m definitely buying more.
Let’s keep CAKE on the rise

Cake is getting ready to pumpRecently, while searching for GSR market maker activity, I discovered large transactions between some of the GSR wallets for CAKE coin. I believe they have completed their accumulation phase and will be playing their cards soon.
GSR wallet: 0x4d88ac34c5A401cB6cdfD8FedA2339F7fb04e4B9
Horban Brothers.

CAKE is rising !#CAKE made a huge down to the ground to take out liq in lower prices now there is just one flip zone which if the market cross it there is no strong supply zone in higher prices
there is a positive pattern in higher prices too so its clear that the market can rise from here !

CAKE update#CAKE we made over 65% on this coin in about 2 weeks !
i think that this coin has the potential for more rising even !
check this out !

CAKE update#CAKE i love this coin !
i made an analysis on this coin weeks ago and we made over 65% profit 1X !
check this out !

#CAKEUSDT: Triangle Breakout – Next Move?Market Overview:
#CAKEUSDT has been in a strong uptrend and recently formed a triangle pattern on the 1-hour timeframe. This pattern typically signals trend continuation, and we just witnessed a breakout!
Key Observations:
🔹 Triangle breakout confirmed – bullish signal!
🔹 Resistance Level: Watch for a clean break for further confirmation.
🔹 Potential Targets (TPs): Higher highs expected if momentum holds.
Strategy:
🔹 If price retests the breakout zone and holds, we could see a strong bullish continuation.
🔹 Invalidation: If price falls back into the pattern, we may see a fakeout scenario.
What’s your take? Will #LDOUSDT pump higher or is this a bull trap? Share your thoughts below!
Follow for more chart updates, trade ideas, and market insights!
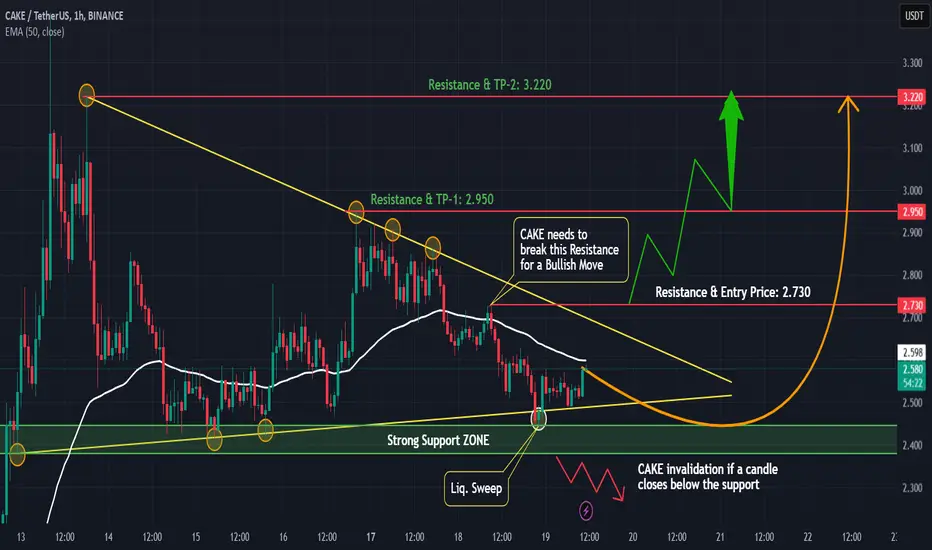
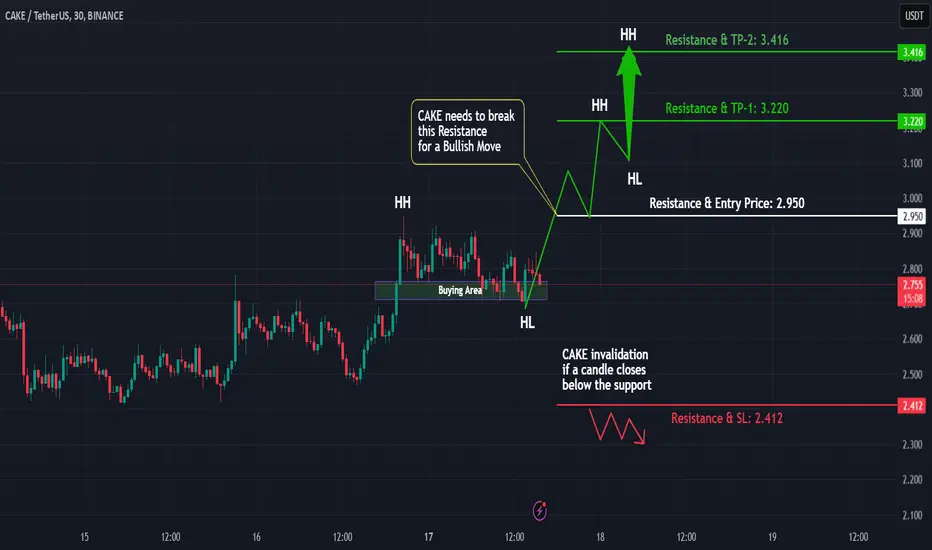
#Cake Ready for a Big Move? Bullish Breakout Incoming!🔹 Market Structure & Trend
#Cake is currently in a strong uptrend, forming higher highs (HHs) and higher lows (HLs). This is a classic sign of bullish momentum.
🔹 Key Breakout Zone
We are watching the resistance level: 2.950, which aligns with previous HHs. A breakout above this level could trigger another strong rally.
🔹 Trade Plan & Entry Strategy
Breakout Entry: Above 2.950 with confirmation
Stop Loss: Below recent HL for proper risk management
Targets: First TP at 3.220, extended TP at 3.416
🔹 Indicators & Confirmation
RSI: Above 50, indicating bullish strength
Volume: Increasing, signaling strong participation
Moving Averages: Aligning for an uptrend
What’s Your Take?
Do you think #Cake will break out or face resistance? Drop your analysis in the comments!
$CAKE Token Set to Spike to $5 Amidst Falling Wedge BreakoutNASDAQ:CAKE , the native token of PancakeSwap, a leading decentralized exchange (DEX) built on the BNB Chain. Recently, NASDAQ:CAKE has been making headlines with a remarkable 70% surge in just seven days, climbing from $1.5 to $2.8. But this could just be the beginning. We are now predicting a potential spike to $5 in the near term,
Technical Analysis
The NASDAQ:CAKE chart is currently painting a bullish picture, with a falling wedge pattern that has been forming since December 2024. Falling wedges are typically reversal patterns, signaling a potential breakout to the upside. For NASDAQ:CAKE , this breakout appears imminent, with the token testing key resistance levels.
The falling wedge pattern suggests that selling pressure is weakening, and buyers are stepping in. A confirmed breakout above the wedge’s upper trendline could trigger a significant upward move, potentially propelling NASDAQ:CAKE to $5 in the short term.
The 38.2% Fibonacci retracement level is acting as a strong support zone for $CAKE. This level has historically served as a springboard for price rallies. In the event of a minor pullback, this support level is expected to hold, providing a solid foundation for further upside.
The immediate resistance lies at the 1-month high, which, if broken, could act as a major pivot point for NASDAQ:CAKE ’s next leg up. Beyond $5, the next target is $10, a level that could be achieved if bullish momentum continues and broader market conditions remain favorable.
Ultrasound CAKE, Four.memes, and PancakeSwap’s Ecosystem
While the technical setup is compelling, NASDAQ:CAKE ’s fundamentals are equally impressive. PancakeSwap has consistently innovated and expanded its ecosystem, making NASDAQ:CAKE one of the most versatile tokens in the DeFi space.
1. Ultrasound CAKE: A Deflationary Mode
In April 2023, PancakeSwap transitioned to a deflationary token model called “Ultrasound CAKE.” This model, approved through the CAKE Tokenomics v2.5 proposal, combines real yield with reduced token emissions. Over 102% of minted CAKE is burned weekly, creating a supply squeeze that enhances the token’s long-term value.
2. Four.memes: A Catalyst for Growth
One of the key drivers behind NASDAQ:CAKE ’s recent surge is the launch of Four.memes, a BNB token creation toolkit. This platform allows users to create and graduate meme coins to PancakeSwap once they reach a bonding curve. Four.memes has not only increased activity on the PancakeSwap platform but also brought new users and liquidity into the ecosystem.
3. Strong Financials and Staking Metrics
Despite the bear market’s impact on the broader crypto space, PancakeSwap continues to generate impressive revenue. The platform boasts an annualized revenue of $27 million, with 42% of NASDAQ:CAKE ’s circulating supply staked.
Market Sentiment and Future Outlook
The current market sentiment around NASDAQ:CAKE is overwhelmingly positive. With a market cap of $845 million and a 24-hour trading volume of $444 million, NASDAQ:CAKE is firmly positioned as a top-tier DeFi token.
Conclusion: NASDAQ:CAKE is Ready to Rise
The falling wedge breakout, combined with PancakeSwap’s innovative ecosystem and deflationary tokenomics, sets the stage for a significant price surge. With a potential target of $5 in the near term and $10 in the coming weeks, NASDAQ:CAKE is poised to deliver substantial returns for investors.

CAKEUSD - Pullback after the rallyLooking at the CAKE/USDT chart, the price is currently undergoing a corrective move following its significant upward surge that reached around 3.40. The orange box around the 2.20 level represents a strong support zone that could act as a base for the next leg up. This correction appears healthy and natural after such a strong rally, allowing the market to reset before potentially resuming its upward trajectory. Once this pullback completes around the support area, we might see renewed buying interest that could propel CAKE to new highs, continuing the established uptrend. The previous price action and market structure suggest this support zone could provide a solid foundation for buyers to step in.

CAKEUSDT CHART ANALYSİS- EDUCATİONAL POSTDiscover what an NFT is and what all the hype is that's surrounding the space.
An NFT, or non-fungible token, is a unique, digital certificate stored on a blockchain. This guarantees the originality of any item, giving the owner exclusive rights to it. Such tokens cannot be discreetly tampered with, split, or replaced because of the nature of the blockchain structure and anonymous encryption technology.
Therefore, this system is best suited for securing rights to a unique object — a work of art, real estate, an artifact in a computer game, or something similar. This article will help you understand the peculiarities of the NFT concept and learn about the most expensive and unusual non-fungible tokens since their creation.

CAKE/USDThello friends
According to the pattern made in the trading range and pullback, this currency has eaten a good amount and it can be said that it can move to the specified goals in the long term.
*Trade safely with us*

#CAKEUSDTCrossing the 4-tetri red resistance line and
especially a strong break of the red resistance band can make it space.
So we are very careful about its movements these days

CAKE is About to Break! (Possible Short-Term Correction)Hello Traders 🐺 .
As you can see on the chart, CAKE is approaching a critical breakout level , but before that, we might see a short-term correction to shake out weak hands.
This could be a healthy retracement before a strong bullish continuation, so keep an eye on key support levels! 📊🔥
Are you ready for the next move? 🚀
In my personal humble opinion, we could take a look at the daily chart to find a good entry price and make the most of the upcoming volatility :
As you can see in the chart above, the price might correct to the buy zone for reaccumulation before continuing its upward movement. If BTC.D keeps dumping, we could expect even more bullish action! 🚀
Make sure to check out my BTC.D analysis and follow me for more updates!
🔹 Midterm Target: If CAKE successfully breaks the monthly resistance, the next major target would be around the 0.786 Fibonacci level , which also acts as a strong resistance ! 📈

CAKE Ready for a Breakout? Cup & Handle Pattern in Play!Analysis: #CAKE is in a strong uptrend and is currently forming a cup and handle pattern on the 30-minute timeframe. This is a classic bullish continuation pattern, signaling a potential breakout.
Key Observations:
🔹 Higher Highs (HH) & Higher Lows (HL) indicate a healthy uptrend.
🔹 Bearish divergence spotted—indicating a possible retracement.
🔹 If support breaks, we may see a trend reversal.
🔹 If the handle completes and #CAKE breaks out, it could be an ideal buying opportunity.
Strategy:
🔹 Wait for breakout confirmation above the cup resistance.
🔹 Entry: On breakout with volume.
🔹 Stop Loss: Below recent HL.
🔹 Target: Measure the depth of the cup for a price target.
Final Thoughts:
This setup has high potential, but always use proper risk management.
What’s your take on #CAKE? Will it break out or break down? Comment below!

CAKEUSDT UPDATECAKEUSDT is a cryptocurrency trading at $21.85. Its target price is $3.500 is likely incorrect, as it would be a significant price drop. However, assuming the target price is actually higher, a more plausible target would be around $39.41, indicating a potential 80%+ gain. The pattern is a Bullish Falling Wedge, a reversal pattern signaling a trend change. This pattern suggests the downward trend may be ending. A breakout from the wedge could lead to a strong upward move. The Bullish Falling Wedge is a positive signal, indicating a potential price surge. Investors are optimistic about CAKEUSDT's future performance. The current price may be a buying opportunity. Reaching the target price would result in significant returns.

CAKEUSDT Falling Pattern Setup with 100%-150% Potential Gains CAKEUSDT has recently formed a Falling Pattern, a chart formation that typically signals a period of consolidation or potential reversal. This pattern is often seen in markets that are in the process of finding a bottom before making a sharp upward move. For CAKEUSDT, the pattern is accompanied by good volume, which indicates that there is solid market interest and a buildup of potential for a breakout. With a projected gain range of 100% to 150% or more, traders are watching this pair closely, hoping to capitalize on what could be a significant upward move once the price breaks out of the pattern's resistance.
The Falling Pattern typically shows a series of lower highs and lower lows, followed by a potential breakout when the price moves through the key resistance level. The increasing volume during this phase suggests that buyers are starting to take control, positioning themselves for a potential rally. Investors are growing more interested in CAKEUSDT as it shows signs of bottoming out and setting up for an explosive upward movement. If this pattern follows through, traders could see substantial returns as the price looks to reclaim its previous highs.
As with all chart patterns, the success of the Falling Pattern in CAKEUSDT depends on several factors, including broader market conditions and the overall sentiment in the crypto space. However, the good volume backing this pattern suggests a higher likelihood of a strong reversal. If CAKEUSDT can break above the resistance formed by the Falling Pattern, the next phase could be a sharp rally, potentially pushing the price higher and providing traders with significant profit opportunities.
Traders should remain cautious and monitor key support and resistance levels to make informed decisions as the price action unfolds. If the market continues to favor bullish momentum, CAKEUSDT could experience a strong breakout that leads to notable gains. Given the current technical setup and investor interest, this pair could be one to watch closely in the coming days or weeks for those looking to capitalize on the next big move.

Pancake Swap (Cake): Forming BoS, Might Pump 15%Cake coin has the potential to form another break of structure (which we are forming currently), which would result in a movement of 15%. EMAs are the major target here but we are also keeping attention at that CME gap!
More in-depth info is in the video—enjoy!
Swallow Team
