Top China Internet-Tech stocks (most on Hang Seng Tech Index)Top China Internet-Tech stocks (most are on the Hang Seng Tech Index, some are still on the Nasdaq - all on separate scales) vs Hang Seng Index (HSI), CSI 300 index , NASDAQ (IXIC index):
- Tencent 0700
- Meituan 3090
- JD .com Nasdaq JD
- Pinduoduo Nasdaq PDD
- Baidu Nasdaq BIDU
- Netease 9999
- Kuaishou 1024
- Bilbili Nasdaq BILI
- Alibaba 9988
HK50 trade ideas

Top China Internet-Tech stocks (most r on Hang Seng Tech Index)Top China Internet-Tech stocks (most are on the Hang Seng Tech Index, some are still on the Nasdaq) vs Hang Seng Index (HSI), CSI 300 index, NASDAQ (IXIC index):
- Tencent 0700
- Meituan 3090
- JD.com Nasdaq JD
- Pinduoduo Nasdaq PDD
- Baidu Nasdaq BIDU
- Netease 9999
- Kuaishou 1024
- Bilbili Nasdaq BILI

China Big Internet-Tech vs talisman China A-shares & HSI, CSI300China Big Internet-Tech (Tencent 0700 Hongkong, KWEB) versus selected talisman China A-shares (Kweichow Moutai 600519 Shanghai, Vanke 000002 Shenzhen) & Hongkong Hang Seng Index (HSI), CSI 300 index (000300 Shanghai), NASDAQ (IXIC).

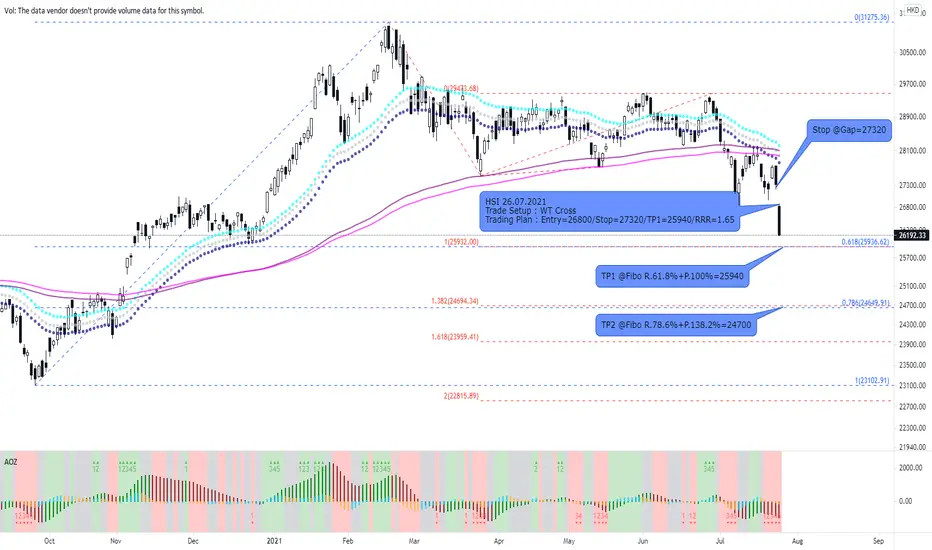
HKXHKD50 || HK50 || about 10:1Trading a perhaps* Bearish flag.
*Perhaps, because, despite such Bearish momentum, anything aye still possible.
After TP1 clicks, If the market shows more of Bullish possibilities. Then RR should be... you know what, "hold my drink"
Ok,
For trade, setting two entries. Same SL, different TP.
If TP1 hit, and TP2 doesn't. Then RR becomes about 9:1, instead of about 10:1.
This =/= break even.
@Smilq

Emerging Markets Tech KEMQ ETF vs China Tech, China & HK indicesEmerging Markets Consumer Technology ETF (KEMQ) vs. Invesco China Technology ETF (CQQQ), KraneShares CSI China Internet ETF (KWEB), China Securities 300 Index (0003000), Hong Kong Hang Seng Index (HSI), Nasdaq Composite Index (IXIC)

Beaware of 09 August HSI trading dayAccording to HSI news at 06 August, the newest price of HSI is 26042, prepare for the dropping impact

Hang Seng- After fearHong Kong index dropped after china crack down again own companies but these were headlines in all media "Crack Down" , but reality is little different china want maximum cooperation from some giant companies and some security issues specially DIDI IPO in USA.

Hang Seng.....Bearish territory entered!Hello Traders,
Hang Seng broke below 26861 and has declined to 24748 area on July 27! This could be a good portion of wave 3 as visualized at chart!
An open target is at 2358x area, where wave 3 is a 1.618-Extension of wave 1.
It needs a break of the 28218 level to change the outlook.
Seasonally spoken, we enter a time of „weak-perfomance“ in the coming month ahead, so it could be, that major-markets will pause the uptrend we have seen since the March 2020 lows!
Hang Seng is really weak since the February high's and the structure look corrective, with overlapping waves and choppy pattern
Have a great Sunday.....
Ruebennase
Feel free to ask or comment!
Tading this analysis is at your own risk!

2021 Aug 02 Week
OANDA:HK33HKD
2021 Aug 02 Week
Last week a historically UHV down bar appeared. Strength always appears on UHV ultra wide spread DOWN bar.
Weekly: Market has rolled over with a wide spread down bar closing in middle (UHV) = Indecision.
Price bounced off Monthly channel demand line.
Daily: Shakeout + Reversal = Strength. Market was resisted at 26340 temporarily.
Given the UHV, there should still be supply to clear.
H4: Bar A UHV ultra wide spread bar closing off low = strength. Automatic reversal after climatic Bar A
has reasonably good bullish volume. Test of the lower region of bar A is to be expected.
Bar B test of low has off the low and level with bar A, some demand is present.
Strategy:
(1) Red/Green zones = preferred entry
(2) Dotted Red/Green is to indicate late entry, but risk will be higher since SL is further away
Remember to follow and like if you find this useful.
Have a profitable week ahead.

JICPT| Concerns ease with HSI bouncing from false breakout! Hello international market traders. Recently, I've published several posts explaining how China's tightened regulation on the education & tech sector caused massive sell-off.
Yesterday, I observed the investors calmed down a bit with Meituan rallied from weekly long-term MA support level as below.
Today, I found more funds came in to buy those who suffered the most in the past 2-3 days, because their valuations become attractive, for example, Tencent rose by 10% today.
From the daily chart, I can see index bounced back and closed above red line zone calculated by measured move of abcd pattern. The quick closing above the zone indicate false breakout. Looking above, the zone of 27513-27859 turned from support zone to resistant zone with MAs coming down. So, the likelihood of formation of impulsive bullish candles to penetrate the zone is slim.
Pay attention to the zone if you're exposed to the Hang Seng Index or tech stocks. Basically, the individual stocks don't perform well with a declined broad market index.

HSI (Hong Kong Index) Could provide a short opportunity HSI (Hong Kong Index) Could provide a short opportunity after reaching marked resistance area. However, price have been dropping massively so this up move could end up in a change of trend since price managed to reach weekly demand areas, however, higher time frame trend still remain short. Keep an eye on it and wait for confirmation to be given around the selected area.

Will HSI break below the trend lineHSI break above the trade line and hold above it since 1992, will we break below the trend line as the status changed?

JICPT| Tighten regulation triggered big Chinese stock sell-offWhat a bloody day for Chinese mainland stock market and HK stock market . The tech stocks, such as Tencent and BABA tumbled by more than 7%. Even value investor favored blue chip-Kweichow Moutai, dropped by over 5% and touched the level below CNY1800 per share for the first time this year.
Kweichow Moutai
How did it start? It was all related to recent crack down on private education industry. Soft copy of the policies targeting the education sector were circulated on line on the Friday day afternoon. I also got a screen shot of the partial soft copy in Chinese. It said the educational training institutions will be banned from raising money through listings. That trigger the first wave of sell-off last Friday. Today is actually the second wave, that impacted the related companies listed in HK market. In addition, investors are concerned about how tighter the restrictions might go, even for Chinese big techs. Meituan, Tencent and BABA also got hit.
From the selling orders, I suspected a bulk of those were from institutions. In addition, over CNH 10B fund outflowed via the China-HK connect scheme. I guess the regulations messed up the valuation, and uncertainty triggered the sell-off. Institutions will see how it goes in the future before coming back again. So I'm bearish for Chinese tech stocks the near term. For the education ones, I recommend immediate sell or sell the rebound . The Fundamental part of private education has changed. The related stocks are likely to go further down, say 30% to 40%, before new business models are recognized by the market.
I personally, prefer Chinese alcohol stocks, e.g. Kweichow Moutai to Chinese tech companies. The unregulated golden days has passed.
Today, I bought some Chinese alcohol ETF. The valuation of the sector become attractive. It reached a reasonable zone in my view. This is investor, not trading. I got enough cash to buy(dollar averaging cost) and are prepare for another 20% drop. I will buy the dip.
I also linked my published idea regarding Tencent and HSI below. Both are coming toward my buying zone. However, the fear may result in overreaction under the current circumstance. To reduce the risk, you can wait for bullish pattern, bullish engulfing or breakout the downtrend line on the daily for better entries.
Hopefully, it helps.


Hang Seng.....On a bearish path?Hello Traders,
Hang Seng is on track to break below the July 9 low @ 26861! If so to come, it would open the door to 25939. More bearish potential exist!
I have visualized the path for my idea!
A break off the possible wave (2) level @ 28218 would be a first sign, that the correction could be done. It should open the door to the wave X high at 294xx zone and a break of this would end the correction definitely!
Keep in mind, that HS is known for extensive corrections! So this one, should last for several weeks. In Germany we call it the „Sommer-Loch“ (Summer hole)! 😜
Have a great Sunday.....
Ruebennase
Feel free to ask or comment!
Trading this analysis is at your own risk!

HANG SENG : possible buy
I think the index failed to break down as you can see on the chart.
As long as 4 hour candles keep closing above 27500 then I believe we will see higher prices.
Expectations:
1. Price will rise to the middle of the channel
2. price will rise to 30,000 zone
3. price will stall between 30,000 zone and the middle of the channel, then continue up
best of luck :-)


Hang Seng..... More bearish potential!?Hello Traders,
Hang Seng has broke out of the flag and declined to 26861 on July 9! This decline was a 0.618 Fibonacci of wave a/w! In rare cases, this could be all off the correction in a wave c/w! But as long as HS is trading below 28833 level I favor the odds for a wave c or y which is not done to the downside.
A break of the July 9 low would open the door to 25939 level. Here, waves c=a (i.e. y=w) and at this level is the 0.618 Fibo of the advance from 23124 to 31183! So I guess a strong Fibo-cluster!
But more bearish potential exist!
A break of the 28833 area would signal the correction should be done, and HS is on the way to new highs.
Have a great Sunday.....
Ruebennase
Feel free to aks or comment!
Trading this analysis is at your own risk!

Hang Seng ready for a big bull run and catch up.The worst of fundamentals are over and fully discounted and act upon; riots, security law, China supposed disregard, enough time of selling by global managers.
The truth of "cyclical" better fundamentals; lowest PE ratio, most attractive valuations for a most developed liquid market in Asia, China actually even more so will ensure it's version of one country two systems work. Like latest IPO, no restrictions on HK idea, the further integration with Pearl Delta positive effects will soon solidify, stability will bring prosperity & greater confidence (don't believe the great exodus hot propagated story, businessmen go where the money is, not politics ideology).
The technicals are now ready. The daily charts have formed a nice base, and started moving up even in the midst of a few days of bearish moves in US Nasdaq & S&P . The underlyings for the 1st time in a long while points to Hang Seng out-performing. Study and get ready.


Hitting my buying pointFinally breakout resistance line hitting my buying point that i just increased more positions for HK Stocks.
