Bearish Signal on Nikkei 225 4hI have a Bearish bais on the nikkei with a stoploss @ 29,000 and a take profit @ 28,000.
J225 trade ideas

Explanation of Pivot Preference Fib Channel An example of flattening market at highs with Fibonacci Channel using High, Low, square root of High*Low, Opening Time and Price and, Closing time and two prices M1 and M4, calculated samely as in Traditional Pivots except, central Pivot = Sqrt(H)*Sqrt(L) instead of, central Pivot = (H+L+C)/3. So, Fib Channel starts at Open Price & Time, and if Bullish then it goes to { - }/2 and if Bearish then to, { - }/2
The r.lambda, or Pivot Preference, in such an interpretation, (DISCLAIMER: just understanding, limited, mine, opinion) is Bullish if, Risk Reward for the last closed duration(period) was favorable for Buyers. Knowing whether you(as a participant) are Bullish or Bearish is important, as well as what kind of participant you are, as well, i.e. maker or taker.
In any respect, this was a video with a Nikkei, and part of a pivot preference circle


This Might Be a "Negative Reversal".When a MACD is much higher than the previous MACD, and the index price is the same,or lower, it sets up a "Negative Reversal". That means the MACD is so high it has nowhere left to go but down. Many times this leads to a price failure at prior resistance,


JP225 - Hidden divergentBuy Entry
-Sideway TFD1
-Trendline
-Demand D1
-Rejection Candle H4
-Hidden divergent H4
TP
-Supply D1

NI225, Elliott wave analysis■Outlook of NI225(NIKKEI) on 1M chart.
I think that we are on sub-wave (1) of wave Ⅴ on the Upper Degree shown as Blue-line.
Sub-waves of WaveⅤare Red-line. Probably, The sub-waves of "wave Ⅴ" will be "Impulse".
Sub-wave (1) of waveⅤ looks like completed because of sub-wave 5 of wave (1) broken acceleration channel line.
The trend will switch to a down-trend. Next is wave(2). It probably is a big retrace.
probably DJI will crash, and Nikkei will be linkage to DJI.
If you want to know more, read my idea about DJI.
If the assumption is correct, the target of wave (2) is as follows.
1. 38.2% Fibo levels of wave (1), 17,500.
2. Closing price of sub-wave 4 of Wave(1), 16,400.
3. Closing price of sub-wave ⅳ of Wave4, 14,800.
4. 61.8% Fibo levels of wave (1), 12,300.
5. Resistance line touch, 11,185.
In this scenario, the stop loss level is 30,715.
■Outlook of DJI(Dow),3Days-6months, Dec 19, 2021 idea.
■Outlook of DJI(Dow),1Day, Dec 25, 2021 idea.

Samurai in shortAfter a return to Pivot it is now moving in the direction of the analysis shown. The analysis is weekly. So keep calm and relax to reach target

The Nikkei Close to Breaking DownThe Nikkei is close to decisively breaking the 4 and 1 hour trendlines. This could lead to at least a 500 point sell-off. Good support is the next line at 27500.


jpn225 neutral viewlike i see .we are in a falling market in the third wave from final wave 5 . so i think that we can take a position "sell" like i tried to mention it in the chart .any objections or advices to improve my trading system that base on elliot waves please montion it. and thenks

NIKKEI 225 - More Upsides to GoSpent a decent amount of time working on Nikkei 225, which is one of my heaviest invested markets. In my opinion, there is certainly a great amount of probability it will crash, but I really don't see it coming in a short period of time.
On one hand, The USDJPY and DXY are probably implying more upsides to go, which in my opinion, would mean a strong economic recovery, which boosts the market even higher.
Realistically, the US stock market is already expecting 3 rate hikes in the year 2022, and with that taken into account, I really cannot come up with extra bad expectations, probably only inflation. However, if there is inflation the stock market would probably climb even more due to an increase in nominal value.
Because of that, I really don't see too much upside in the short term, at least in the first half of the year 2023. I am still holding my longs and would love to add more, and certainly would stay with my cash and be cautious maybe a half year later.

Nikkei 225 Index Target Price 28846.76 Nikkei 225 is bullish on the 30 minute time frame. Watch for a bullish price action signal.

Training Trading Positions | Nikkei 4H• Training trading positions Along with how to use trading volume and the impact of volume on price movement !

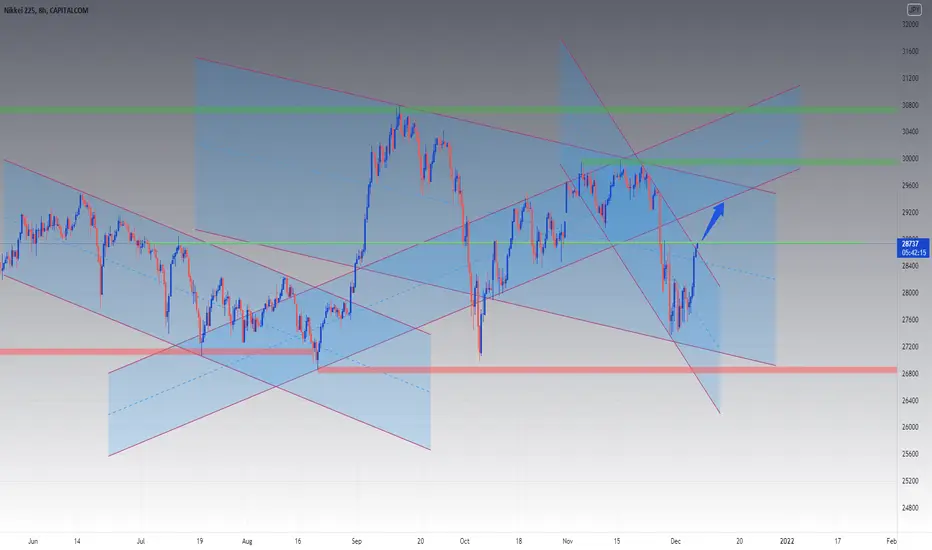
NIKKEI Trading IdeaBased on Simple Technical Analysis ( Trendline + Support & Resistance )
Risk Disclaimer:
Please be advised that I am not telling anyone how to spend or invest their money. Take all of my analysis as my own opinion, as entertainment, and at your own risk. I assume no responsibility or liability for any errors or omissions in the content of this page, and they are for educational purposes only. Any action you take on the information in these analysis is strictly at your own risk. There is a very high degree of risk involved in trading. Past results are not indicative of future returns. Good luck :-)
A Perfect Example for "Price Action Trading Strategy" - #JPN225Watch the market carefully in between the two lines and get ready to take action for both scenarios.

JP225descending wedge on the 1h time frame
impulsive break to the upside
corrective continuation to the upside

Liquidity Indicator: Time to turn bullishNI225 & HSI should reach correction Minimum soon. As well as other major World Indices.

More stimulus plans for Japan economyThey did it again ! Like the drug addict who got hooked to drugs, each time he took it , the next one he wants more stimulus, more drugs to satisfy himself. So , the economy works the same. With high inflation, low birth rate and the COVID pandemic, what else can the government do beside printing money? Allowing the stock market to crash is disastrous though this reset is necessary for new growth to starts.
With soaring property prices globally, how can the young ones afford to buy a unit to start a family ? Not to mention the costs of transportation, food, utilities, etc. Is wages increment matching all these inflationary costs ? I doubt so ........
Isn't what is happening in China currently with the government intervene in the costs of private tuition (read this article )
, improve housing affordability for the young people a trend that is coming strongly ?
Well, as traders and investors, this can be a good time to ride the trend and make the money!
Enjoy whilst it last

Winning for good with JP225 24000PIPSWhat wonderful market
It's been an awaiting prospect
and opportunity to take this chance
TP# 27200.0
24000 Pips cover
OANDA:JP225YJPY
