Nasdaq 100 Index 2-Hour Chart Analysis2-hour candlestick chart for the Nasdaq 100 Index (NDX) on the NASDAQ exchange. The chart spans from May to August, showcasing a significant upward trend with notable fluctuations. Key indicators include a recent price of 22,861.53, representing a 0.72% increase. The chart features technical analysis elements such as support and resistance levels, highlighted by green and red boxes, and a downward arrow suggesting a potential price movement.
US100 trade ideas

Nasdaq leads the rally and can move for 3-5 days moreWhile crude oil is declining, tech stocks are gaining momentum: Nasdaq had reached another all-time-high recently and that might not be over: according to statistical studies, it rarely reverses quickly above the upper Bollinger Bands line and the average swing duration is between 17 and 20 days (which gives us several days of potential continuation).
The earnings season fuels growth for many technological stocks, and the “sell America” narrative steps back, so we may see Nasdaq growing as shown in the chart below.
Don't forget - this is just the idea, always do your own reserch and never forget to manage your risk!

The W FormationThe question now is, with the W pattern forming with bold bullish price, that has broken a high we had as a target yesterday, tapped on the FVG already and now showing some positive candle stick communication, will we buy to continue breaking the highs, or relax and wait for more confirmation within the fvg range or even lower before going in?

Nasdaq Surges to New Highs – 23,200 and 24,000 in Sight? (READ)By analyzing the Nasdaq chart on the weekly timeframe, we can see that the index is currently trading around the 22,700 zone and has followed the main analysis perfectly so far — continuing to print new all-time highs.
According to the original outlook, as long as the index holds above 22,150, we can expect further bullish continuation toward the next targets at 23,200 and 24,000.
Please support me with your likes and comments to motivate me to share more analysis with you and share your opinion about the possible trend of this chart with me !
Best Regards , Arman Shaban

USNAS100 Bullish Ahead of NVIDIA Milestone – 23010 in SightUSNAS100 – Outlook
The index continues its bullish momentum, supported by strong tech performance — notably NVIDIA surpassing a $4 trillion market cap.
As long as the price holds above 22880, the trend remains bullish toward:
23010 Then extended targets near 23170
However, a 1H close below 22815 would signal weakness, potentially opening the way for a retracement toward: 22705 And 22615, especially if tariff tensions escalate.
Resistance: 23010, 23170
Support: 22815, 22705, 22615

Double TopSet up forming on the hourly chart on the Dow. When or if we close bellow the 15:00 bar and if we don't trade above the recent highs in the meantime, it will be our trigger for selling short. Because its a big bar I believe there will be a price engineering from the big boys, therefore I will place a sell limit order a 50% retracement in relation to the 15:00 bar from yesterday in order to get in a optimum level.

NAS100 SELLTake trade on your own risk!
still moving on the downtrend to the next supply & demand zone, no sign of reversal.
Set TP: 22,755

BUYAsian Session
Trend Line Break
Order Point
Previous Week Bullish
Divergence
New day..., Action backed decision

NASDAQ 100: Breakout Confirmed — Targeting 23,023Market Overview:
The NASDAQ 100 is showing strong bullish momentum within its ascending channel. After forming an ABCD pattern and breaking above the buy level at 22,745, the price accelerated upward and is approaching the target resistance zone at 23,023.
Technical Signals & Formations:
— ABCD pattern in play
— EMA supports bullish momentum
— Breakout above buy zone at 22,745
— Target is the upper channel boundary and resistance at 23,023
Key Levels:
Support: 22,681, 22,620
Resistance/Target: 23,023
Scenario:
Primary: If the price holds above 22,745, the bullish continuation toward 23,023 remains the main scenario.
Alternative: A drop below 22,681 may lead to a correction toward 22,620 and increase bearish pressure.

NAS100 LONG TRADE PLANThe instrument has broken above the descending trend line. This is an indication of the bullish rally.
Please do your own analysis before placing any trades.
Cheers and Happy Trading !!!

NSDQ100 Bullish Flag continuation pattern developing Metals Market Volatility
Trump’s proposed 50% tariff on copper imports triggered a sharp drop in London copper prices (~2%), with risks of falling below $9,000/ton. While U.S. prices spiked on supply concerns, the global move reflects industrial demand fears—potentially weighing on manufacturing and cyclical stocks.
Trade Negotiations Intensify
Asian trade delegates have logged over 350,000 air miles traveling to Washington as tariff timelines remain unclear. Ongoing uncertainty is capping broader risk appetite, though delayed duties and active talks are offering short-term relief to markets.
Fed Under Pressure
Trump ramped up criticism of Fed Chair Jerome Powell, calling him “terrible,” and may consider replacing him with top adviser Kevin Hassett. This raises questions about central bank independence and future rate policy, a potential headwind for investor confidence.
Market Snapshot
U.S. stock futures: Slightly higher
Oil: Up, on Red Sea conflict
Gold: Down, as risk appetite stabilizes
Conclusion – Nasdaq 100 Trading Outlook
Near-term view: Mildly bullish, supported by easing trade tension and tech sector strength.
Caution warranted: Watch for headline risks from new tariff announcements or Fed-related developments.
Key Support and Resistance Levels
Resistance Level 1: 22940
Resistance Level 2: 23060
Resistance Level 3: 23180
Support Level 1: 22410
Support Level 2: 22300
Support Level 3: 22130
This communication is for informational purposes only and should not be viewed as any form of recommendation as to a particular course of action or as investment advice. It is not intended as an offer or solicitation for the purchase or sale of any financial instrument or as an official confirmation of any transaction. Opinions, estimates and assumptions expressed herein are made as of the date of this communication and are subject to change without notice. This communication has been prepared based upon information, including market prices, data and other information, believed to be reliable; however, Trade Nation does not warrant its completeness or accuracy. All market prices and market data contained in or attached to this communication are indicative and subject to change without notice.

US100 – Trendline Break Signals Potential RallyUS100 breaks above descending trendline.
🎯 Targets: 22799 → 22877
⚠️ Invalidation if price drops below 22702

USNAS100 Consolidates Between 22815–22705 | Breakout Will DefineUSNAS100 – Technical Outlook
The NASDAQ remains under pressure amid ongoing tariff uncertainty, with traders closely watching for any progress in negotiations or signs of escalation.
Currently, the price is consolidating between 22815 and 22705, awaiting a breakout to define the next directional move.
A 1H candle close below 22705 would confirm bearish continuation, targeting 22600, with further downside potential toward 22420.
A break above 22815 would shift momentum bullish, opening the way to 22880, followed by 23010.
Key Levels:
Support: 22600 / 22420
Resistance: 22815 / 22880 / 23010

NASDAQ Potential DownsidesHey Traders, in today's trading session we are monitoring NAS100 for a selling opportunity around 22,750 zone, NASDAQ is trading in a downtrend and currently is in a correction phase in which it is approaching the trend at 22,750 support and resistance area.
Trade safe, Joe.

Nas100 is Still Correcting Nasdaq is Correcting
Long Term we are still Bullish
Remember that markets hunt liquidity
The short term trend is Lower Highs and Lower Lows
Price is still in Premium For Sells
Looking for a retest of previous short term high and my TP would be around 22580
The only way I would get into a buy trade if price would retest the current support and hold with very bullish price action. No little candles etc.

NAS100 - Bearish Triangle Breakdown Forming!NAS100 - Bearish Triangle Breakdown Forming!
A symmetrical triangle pattern has formed on the NAS100 30-min chart, signaling potential volatility ahead. We’re nearing the apex of the triangle, and price action suggests a possible bearish breakout.
🎯 Entry: 22,750.00
🎯Target: 22,400.40
⛔ Stop Out: 22,850.88
The risk/reward setup is favorable if the breakout follows through. Keep a close eye on volume confirmation as price exits the triangle.
What do you think about this triangle formation? Will the breakdown hold, or could bulls trap the shorts again?
💬 Share your opinion below and let’s discuss the setup!
🙏 If you find this helpful, please give it a like and follow for more technical ideas!

NASDAQ 100 – Is Upside Momentum Still Evident?Tough talk on tariffs at the back end of last week and over the weekend from President Trump ahead of his 90 day pause deadline, which is due to end tomorrow (July 9th), helped to put a small dent in trader sentiment, slightly undermining the recent strong upside momentum seen in the US 100 index.
This led to a sell off from fresh all time highs of 22908 registered on July 3rd to a low of 22600 yesterday evening, as the letters sent by the US administration outlining import tariffs of 25% sent to Japan, South Korea and another 12 nations were unveiled.
However, the moves have been relatively muted since then as traders remain optimistic that there is still time for negotiation to agree trade deals given that the new tariffs won’t go into effect until August 1st, providing a potential further 3 weeks to move things along.
Looking forward, in a relatively quiet week for data and central bank speakers, the next moves in the US 100 index towards the Friday close may be dictated by updates on trade deals between the US and EU, and the US and India, both of which have been reported as moving closer to agreement. Technical trends could also be an important factor.
Technical Update: Is Upside Momentum Still Evident?
Future tariff news has the potential to continue to be a very important sentiment driver for global equities, particularly within the tech sector, which the US 100 index reflects within its constituents.
As a result, it can be useful to assess potential support and resistance levels within the US 100 index that traders may be focusing on to gauge the next possible direction for prices.
Possible Resistance Levels:
Since posting the April 2025 low at 16290, the US 100 index has rallied by over 40% in only a 13-week period. While this has reflected positive sentiment during this time, traders may well now be questioning if this upside momentum can continue, or if it might stall, even leading to price weakness.
As such, being aware of potential resistance levels against which to judge current price strength that might be able to hold and possibly reverse this latest activity back to the downside, may prove important.
Having previously been strong enough to hold recent price strength, the 22908 July 3rd all-time high, may now represent an area where sellers can be found again, and as such, this marks a potential first resistance focus.
However, closing breaks above 22908 might suggest a more extended phase of price strength, with traders then possibly looking to 23429, the upper weekly Bollinger band and on breaks above this, even towards 24482, which is equal to the 38.2% Fibonacci extension of the February to April 2025 price decline, as the next resistance levels.
Possible Support Levels:
Of course, just because a 40% advance in prices has been seen, doesn’t guarantee it will continue and traders may be trying to focus on support levels that if broken on a closing basis over the coming days, might suggest risks of a more extended decline in price.
Looking at the daily chart above, it might be suggested that the first support is currently represented by 22201, the level of the rising Bollinger mid-average. Closing breaks below 22201 could in turn lead to further price declines to test 22053, the 38.2% Fibonacci retracement of May 23rd to July 3rd price strength, even 21787, the deeper 50% retracement.
The material provided here has not been prepared accordance with legal requirements designed to promote the independence of investment research and as such is considered to be a marketing communication. Whilst it is not subject to any prohibition on dealing ahead of the dissemination of investment research, we will not seek to take any advantage before providing it to our clients.
Pepperstone doesn’t represent that the material provided here is accurate, current or complete, and therefore shouldn’t be relied upon as such. The information, whether from a third party or not, isn’t to be considered as a recommendation; or an offer to buy or sell; or the solicitation of an offer to buy or sell any security, financial product or instrument; or to participate in any particular trading strategy. It does not take into account readers’ financial situation or investment objectives. We advise any readers of this content to seek their own advice. Without the approval of Pepperstone, reproduction or redistribution of this information isn’t permitted.

Long position idea on Nasdaq Simple and precise idea of Nasdaq. Bullish momentum in full swing. Nasdaq recently broke out of the previous High/Resistance and shows that the bulls are still in power. Take profit is at 25.000.00 because Nasdaq usually moves around 10.000 pips after a market crash so when doing my calculations from previous Low of 16300, my estimation is around 25000 which equals to 9,000 - 10,000 pips.

X1: NAS100/NQ/US100 Short Trade Risking 1% to make 1.35%PEPPERSTONE:NAS100 / CAPITALCOM:US100 Short Trades
PEPPERSTONE:NAS100 / CAPITALCOM:US100 Short for week, with my back testing of this strategy, it hits multiple possible take profits, manage your position accordingly.
Risking 1% to make 1.35%
Note: Manage your risk yourself, its risky trade, see how much your can risk yourself on this trade.
TP-1 is high probability TP but don't overload your risk like greedy, be disciplined trader.
Use proper risk management
Looks like good trade.
Lets monitor.
Use proper risk management.
Disclaimer: only idea, not advice

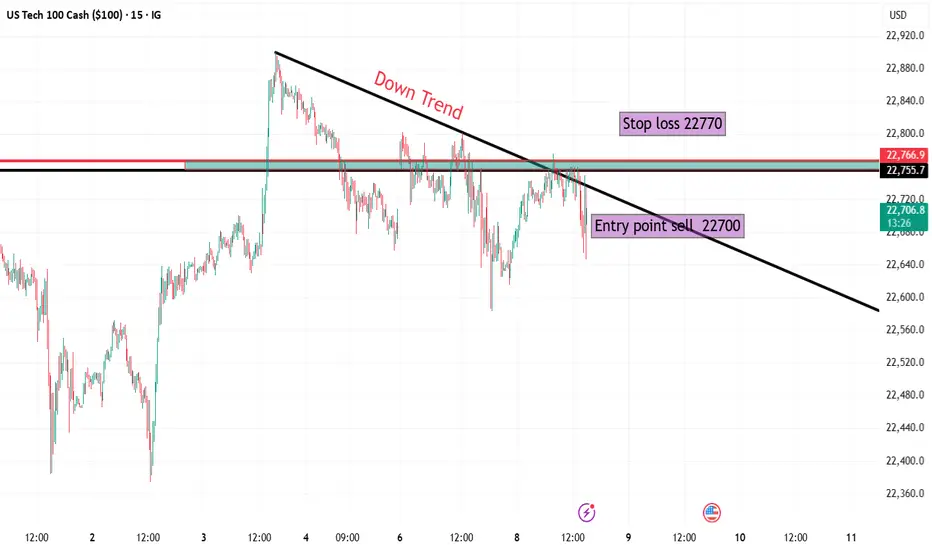
NASDAQ 🔍 Market Overview:
Instrument: US Tech 100 (NASDAQ 100)
Timeframe: 15 Minutes
Current Trend: Short-term downtrend, indicated by the descending trendline connecting recent lower highs.
📉 Trade Setup (Short Position):
Entry Point: 22,700
Price has broken below the trendline and a horizontal resistance zone around 22,750–22,770, confirming bearish pressure.
Stop Loss: 22,770
Placed just above the previous resistance and trendline. A break above this level would invalidate the downtrend structure.
Target: 22,070
This level aligns with a previously tested demand/support zone, offering a logical take-profit area.
📊 Risk/Reward Analysis:
Risk: ~100 points
Reward: ~640 points
Risk-to-Reward Ratio: 1:6, which is excellent and indicates a high potential reward relative to the risk.
📌 Technical Observations:
Trendline: Clearly established downtrend with lower highs.
Breakout Confirmation: Price rejected from trendline + horizontal resistance = confluence zone.
Volume & Momentum (not shown but advisable to check): Traders should confirm the breakout with increased selling volume or bearish momentum indicators (e.g., RSI dropping below 50 or MACD crossing down).
✅ Conclusion:
This is a well-structured short (sell) setup with:
Clear trendline rejection,
Defined entry, stop loss, and target,
A favorable risk-to-reward ratio.
Bear signalsLooking for 22500 Im thinking. Banks trade the round numbers and the round numbers for nas are 125 point increments

NASDAQ Bulls Defend Pivot – Can 23,000 Break Next?USNAS100
The Nasdaq 100 is currently holding above the pivotal 22,720 level, supported by market optimism amid recent tariff-related developments from the White House.
Bullish Scenario:
Sustained price action above 22,720 keeps bullish momentum intact. A break and 1H close above 22,815 would confirm strength, opening the path toward the psychological milestone and potential all-time high at 23,000.
Bearish Breakdown:
A 1H or 4H close below 22,720 would invalidate the bullish bias and strengthen downside pressure, with initial support seen at 22,615 and deeper correction likely toward 22,420.
Key Technical Levels:
• Resistance: 22,815 · 23,000
• Support: 22,615 · 22,420

US NAS 100Preferably suitable for scalping and accurate as long as you watch carefully the price action with the drawn areas.
With your likes and comments, you give me enough energy to provide the best analysis on an ongoing basis.
And if you needed any analysis that was not on the page, you can ask me with a comment or a personal message.
Enjoy Trading ;)
