NASDQhe image shows a daily chart (1D) of the Nasdaq 100 (US100) on TradingView, with a detailed technical analysis suggesting a possible continuation of the long (bullish) trend, supported by various price levels, trendlines, and visual cues. Here's a description based on the chart:
🟦 Current Context
The price has recently broken above a key resistance area around 20,016 – 20,038, which may now act as support.
The current candle is bullish (green) and closes above this range, showing buyer strength.
There is a clear upward trend starting mid-April, with higher lows and consecutive bullish candles.
📈 Key Technical Elements
A target is marked at 21,009.5, highlighted by an orange horizontal line.
A light blue rectangle represents a potential projected move range, starting around the 20,000 zone and aiming toward 21,000.
A red box below the current price likely indicates the invalidation area or stop-loss zone.
Intermediate support levels include:
19,756.0 (blue line)
19,226.9 (orange line)
18,304.8 (deeper support)
🔁 Potential Long Continuation Scenario
If price holds above the 20,000 – 20,038 zone, we may see an acceleration toward the 21,009 target.
The overall pattern suggests a breakout from a consolidation phase, followed by a retest of the broken level (now support), and a potential upward continuation.
The diagonal trendlines indicate the formation of a broad ascending channel.
📅 Timing
The projected target may be reached within the coming weeks: a vertical black line is marked on May 21, 2025, possibly indicating the expected timeframe for the move.
✅ Conclusion
There is a clear bullish market structure, with a resistance breakout and well-defended supports. Unless there’s a false breakout or negative macro news, the long projection toward 21,009 appears technically valid.
US100 trade ideas

a strategy i made with chatgpt in the works before market openThe strategy involve the use of to EMAs. The 10 and 20 EMAs. and i have an alert on Tradingview that tells me when the golden cross occurs and on the next candle after the golden cross thats where i am supposed to enter the trade but since i am working at this time i missed my entry but still got a good entry on the next reset and took a 2.5:1 trade and it panned out.

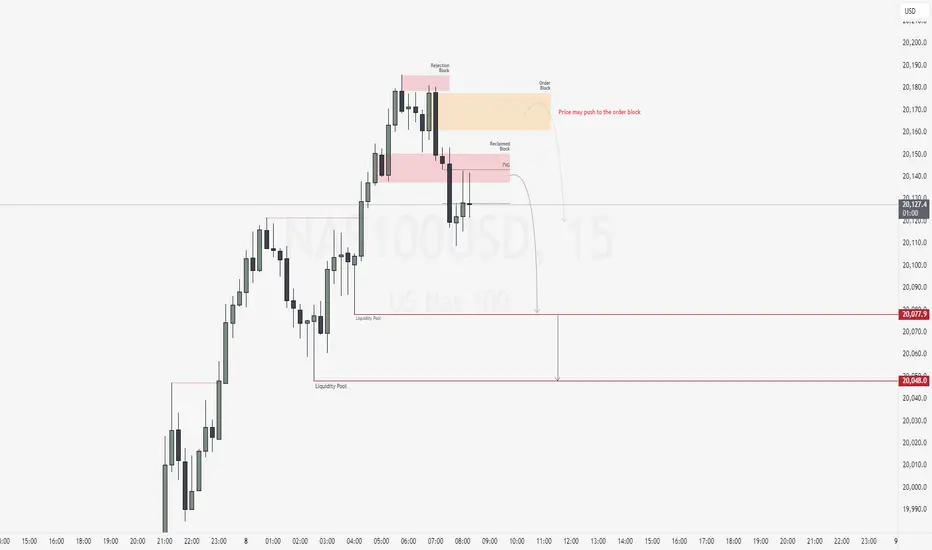
NAS100USD: Bearish Confluence Builds as Market WeakensGreetings Traders,
Despite the broader bullish context on NAS100USD, current confluences suggest a potential short-term move to the downside. As we enter the New York session—with a key news release on the horizon—we anticipate heightened volatility. The critical question now becomes: where is price most likely to draw?
Key Observations:
1. Shift in Market Structure:
Price failed to break above the previous high and instead formed a lower high, signaling weakness and suggesting a possible reversal. This lower high, marked by multiple rejection wicks, forms what we identify as a rejection block—a zone often used by institutions to initiate sell orders.
2. Displacement and Bearish Arrays:
Following this rejection, the market displayed strong displacement to the downside, confirming a market structure shift. This supports the likelihood of bearish continuation and increases the validity of bearish institutional arrays holding as resistance.
3. Current Zone of Interest:
Price is now trading within a fair value gap (FVG) aligned with a reclaimed order block—a strong confluence area for potential bearish continuation. Just above this zone lies a bearish order block and another FVG, which may act as a secondary resistance should price wick higher before moving down.
Trading Plan:
Wait for confirmation at the current resistance zones before considering entries. If validated, look to target the liquidity pools resting at lower, discount price levels.
Stay patient, trade with precision, and let the market confirm your idea.
Kind Regards,
The Architect
Nas100 Bullish- I'm looking for an retracement to buy otherwise I'll wait until i see something nice.
-It would be nice to see a sell off when the new york open starts

When Stocks & Bond Move Opposite Direction - Its implicationWhen Stocks & Bond Move Opposite Direction what does it mean?
We have observed a divergence between the stock and bond markets since 2020. While U.S. Treasury bonds entered a bear zone, the stock markets continued their upward climb. What are the implications of this decoupling?
Will the stock market resume its uptrend and hit new highs? Or is this merely a retracement before further downward pressure?
Micro E-mini Nasdaq Futures and Options
Ticker: MNQ
Minimum fluctuation:
0.25 index points = $0.50
Disclaimer:
• What presented here is not a recommendation, please consult your licensed broker.
• Our mission is to create lateral thinking skills for every investor and trader, knowing when to take a calculated risk with market uncertainty and a bolder risk when opportunity arises.
CME Real-time Market Data help identify trading set-ups in real-time and express my market views. If you have futures in your trading portfolio, you can check out on CME Group data plans available that suit your trading needs www.tradingview.com
Trading the Micro: www.cmegroup.com

Technical Breakdown on US 100 1H TimeframeTechnical Breakdown on US100 1H Chart using Volume Profile, Gann, and CVD + ADX
1. Key Observations (Volume, Gann & CVD + ADX Focused)
a) Volume Profile Insights:
Value Area High (VAH): 20,080
Value Area Low (VAL): 19,720
Point of Control (POC):
Recent Session: 19,828.32
Previous Session: 19,760.96
High-volume nodes: Between 19,750 – 19,830 (acceptance zone with strong historical interest).
Low-volume gaps: 19,840 – 19,950 and above 20,100 (potential fast-move areas).
b) Liquidity Zones:
Stop Clusters Likely at:
Above 20,100 (psychological level and channel top).
Below 19,720 (value rejection zone).
Order Absorption Zones:
19,828 – 19,850 shows thick absorption based on CVD response and price stall.
c) Volume-Based Swing Highs/Lows:
Swing High: 20,080 (volume spike with slight wick rejection).
Swing Low: 19,700 (demand step-in area).
d) CVD + ADX Indicator Analysis:
Trend Direction: Uptrend (strong green candle series with rising CVD).
ADX Strength:
ADX > 20 with DI+ > DI- → Confirmed uptrend.
CVD Confirmation:
Rising CVD + bullish price action → Strong demand from market buyers, aligning with breakout above POC.
2. Support & Resistance Levels
a) Volume-Based Levels:
Support:
VAL: 19,720
POC (Current): 19,828.32
POC (Previous): 19,760.96
Resistance:
VAH: 20,080
Round number & psychological level: 20,100
b) Gann-Based Levels:
Gann Swing Low: 19,700
Gann Swing High: 20,080
Key Retracement Levels (Range: 19,700 – 20,080):
1/2: 19,890
1/3: 19,827
2/3: 19,953
3. Chart Patterns & Market Structure
a) Trend: Bullish (confirmed by rising ADX + CVD).
b) Notable Patterns:
Breakout from consolidation range above POC (strong volume confirmation).
Ascending channel structure supporting higher lows.
No divergence in CVD → healthy trend continuation signal.
4. Trade Setup & Risk Management
a) Bullish Entry (If CVD + ADX confirm uptrend):
Entry Zone: 19,828 – 19,850 (retest of POC/consolidation base)
Targets:
T1: 20,080 (VAH/Swing High)
T2: 20,200 (Channel Top)
Stop-Loss (SL): 19,700 (below swing low)
RR: ~1:2.3 minimum
b) Bearish Entry (If CVD + ADX flip bearish later):
Entry Zone: 20,080 – 20,100 (failure to break channel top)
Target:
T1: 19,828 (POC retest)
Stop-Loss (SL): 20,150 (above channel breakout zone)
RR: ~1:2
c) Position Sizing: Risk only 1-2% of capital per trade. Avoid oversized trades in extended trends.

Understanding the Crab's Potential Ascent Before the DescentCurrent market analysis suggests a potential temporary surge in the Nasdaq index, colloquially referred to as a "crab walk," possibly reaching a level of 20.4 before a significant correction.
While this upward movement may present short-term opportunities, it is crucial to recognize its potential transience.

NAS long idea Another idea on NAS100. The price is making bullish pattern, so if the price falls down to the key level and can't break it, highly likely to make bullish movement.
This is only my prediction, decision is all yours.

Hanzo : NAS100 15m: Breakout Zone Confirmed After Liquidity Trap🆚 Nas100 – Hanzo’s Strike Setup
🔥 Timeframe: 15-Minute (15M)
——————
💯 Main Focus: Bullish After Break at 19950
We are watching this zone closely.
💯 Main Focus: Bearish After Break at 19715
We are watching this zone closely.
———
👌 Market Signs (15M TF):
• Liquidity Grab + CHoCH at 19930
• Liquidity Grab + CHoCH at 19650
• Strong Rejections seen at:
➗ 19750 – Major support / Key level
➗ 20100 – Proven resistance


I'm selling NAS100, you should too!!Classic head and shoulder is forming, sometimes, it is that easy, dont overcomplicate it

NASDAQ (NDX) Market OutlookCurrently, the NASDAQ is trading around 19,723. We're anticipating a short-term pullback toward the 19,462 level, where a significant pool of liquidity awaits. This zone could act as a magnet for price in the near term. Once price reaches this area, we’ll closely monitor the lower timeframes for a potential bullish reaction or accumulation, which could signal the next leg higher.
Stay patient and let price confirm at key levels.

NAS100USD: Volatility Opens Door for Sell Setup in NY SessionGreetings Traders,
As we enter the New York session—a period known for heightened volatility—we note that NAS100USD remains in a broader bullish environment. However, current price action suggests the potential for a short-term reversal, prompting us to explore selling opportunities.
Key Observations:
1. Bearish Internal Structure Developing:
Despite the overall bullish trend, internal price action reveals a sequence of lower lows, indicating the formation of a bearish microstructure. This internal weakness is reflected in the way bearish arrays—such as mitigation blocks and fair value gaps (FVGs)—continue to act as resistance zones.
2. Mitigation Block & FVG Alignment:
Recently, price delivered a strong displacement to the downside, followed by a retracement into a mitigation block that aligns with a fair value gap. This confluence reinforces the bearish bias and suggests institutional selling may be active in this zone.
3. Downside Targets – Gap Fill & Liquidity Pools:
The first downside target is a nearby inefficiency (gap) in price action, which the market often seeks to fill. The second target lies below, where sell-side liquidity pools are likely resting.
Trading Plan:
Monitor price behavior within the current resistance zone. If confirmation of continued bearish momentum appears, short positions targeting the aforementioned levels may be viable.
Stay focused and wait for confirmation before committing to any positions.
Kind Regards,
The Architect

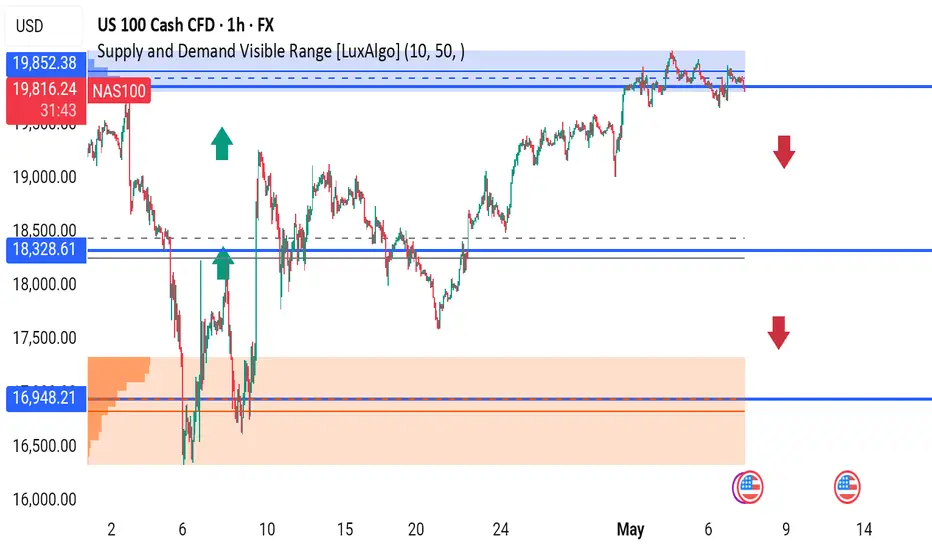
NAS100 1H | Major Rejection Zone – Time to Sell?NAS100 is trading inside a key supply zone, showing clear rejection signs near 19,825, with a potential downside move on the table.
Watch These Levels:
Resistance (Rejection Zone): 19,825
First Support: 18,328
Major Demand Zone: 16,948
Bearish Bias if price fails to break and close above 19,825.
A break below 18,328 could trigger a deeper drop toward 16,948.
Trade Plan:
Sell near 19,825 with SL above zone
Target 18,328 → 16,948
Bullish reversal only above clean breakout
What do you think—pullback or breakout?
#NAS100 #NASDAQ #Indices #PriceAction #SupplyAndDemand #SmartMoney #ForexTrading #TechnicalAnalysis #LuxAlgo #US100 #CFD
NSDQ100 INTRADAY awaits Fed Rate Decision Macro & Central Banks
The Federal Reserve is expected to keep interest rates unchanged. Officials say policy is well-positioned, despite political frustration.
China is adding stimulus: cutting rates, reducing bank reserve requirements, and increasing gold reserves for the sixth month in a row.
Markets
U.S. stock futures are higher.
The U.S. dollar is recovering after three days of declines.
The U.S. and China will restart trade talks — the first since the Trump-era tariff war.
Companies
Novo Nordisk shares are rising on expectations of less competition for its obesity drug Wegovy.
WeightWatchers has filed for bankruptcy.
Earnings reports this morning: Walt Disney, Uber, Barrick Gold.
Earnings reports this afternoon: Arm Holdings, Occidental Petroleum, Carvana, Flutter.
Key Support and Resistance Levels
Resistance Level 1: 20,190
Resistance Level 2: 20,510
Resistance Level 3: 20,930
Support Level 1: 19,330
Support Level 2: 19,020
Support Level 3: 18,570
This communication is for informational purposes only and should not be viewed as any form of recommendation as to a particular course of action or as investment advice. It is not intended as an offer or solicitation for the purchase or sale of any financial instrument or as an official confirmation of any transaction. Opinions, estimates and assumptions expressed herein are made as of the date of this communication and are subject to change without notice. This communication has been prepared based upon information, including market prices, data and other information, believed to be reliable; however, Trade Nation does not warrant its completeness or accuracy. All market prices and market data contained in or attached to this communication are indicative and subject to change without notice.

nasdaq us100 buy/longtarrifs
interest rates
use proper risk management
#interest rates
#fomc
#ppi
#cpi
#jerome powell
