US30: Local Bearish Bias! Short!
My dear friends,
Today we will analyse US30 together☺️
The in-trend continuation seems likely as the current long-term trend appears to be strong, and price is holding below a key level of 44,774.9 So a bearish continuation seems plausible, targeting the next low. We should enter on confirmation, and place a stop-loss beyond the recent swing level.
❤️Sending you lots of Love and Hugs❤️
US30 trade ideas


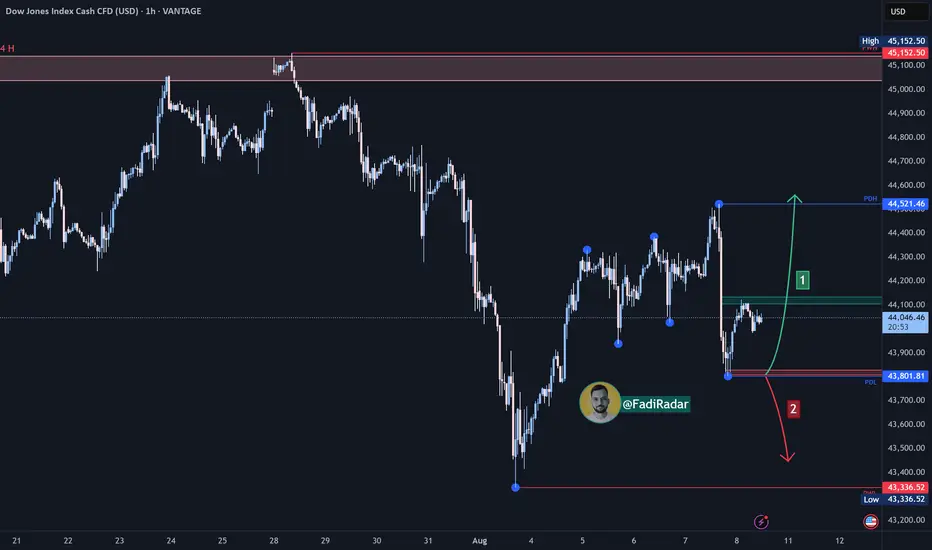
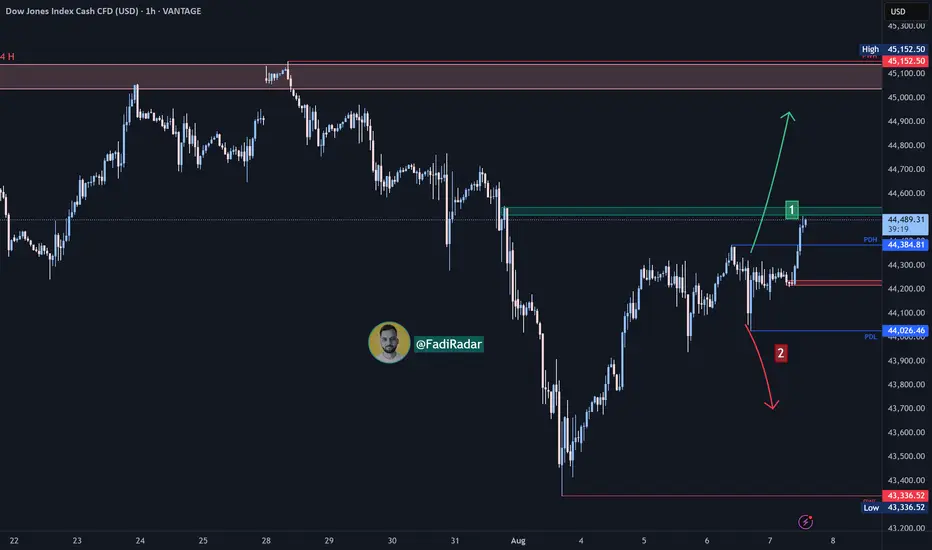
Dow Jones Index (US30 / Dow Jones) Analysis:The Dow Jones index is currently moving sideways and is trading near the $44,000 level.
🔻 Bearish Scenario:
If selling pressure leads to a break below the $43,800 area, the index may drop to test the $43,300 level, which is considered a critical support in the short term.
🔺 Bullish Scenario:
The price may test PDL (Previous Day Low) at $43,800 as a support zone and bounce upward. If the index breaks and holds above $44,100, this could lead to a continuation toward $44,520, and then to $45,000, a key resistance zone.
⚠️ Disclaimer:
This analysis is not financial advice. It is recommended to monitor the markets and carefully analyze the data before making any investment decisions.
US30 LongElite Analysis
Double confirmation on lower time frame
- Interesting is that I am finding the same confirmations in the seconds charts giving me a stronger trade.
Targeting upper liquidity pools
Executed in a lower time frame

$DJI📊 TVC:DJI – Market Outlook Ahead of Inflation Data
As we head into next week’s inflation report, market sentiment is showing signs of cautious optimism. Recent signals from China suggest a slowing in money supply growth, which could be part of an effort to stabilize domestic markets and control capital flows.
At the same time, the possibility of a 90-day truce in U.S.–China tensions may give investors some breathing room, especially around trade and supply chain concerns. If such a pause materializes, it could help maintain a temporary balance in global supply chains, reducing immediate inflationary pressures.
For the Dow Jones, this combination of monetary restraint in China and geopolitical stability—even if short-lived—may support a steadier market tone in the near term. However, the upcoming inflation data will be the key driver to confirm whether this calm can extend or if volatility will return.
US30 - Potential TargetsDear Friends in Trading,
How I see it,
Keynote:
If price closes a 2HR / 4HR candle body above red barrier,
the "SHORT" thesis is voided.
I sincerely hope my point of view offers a valued insight
Thank you for taking the time study my analysis.
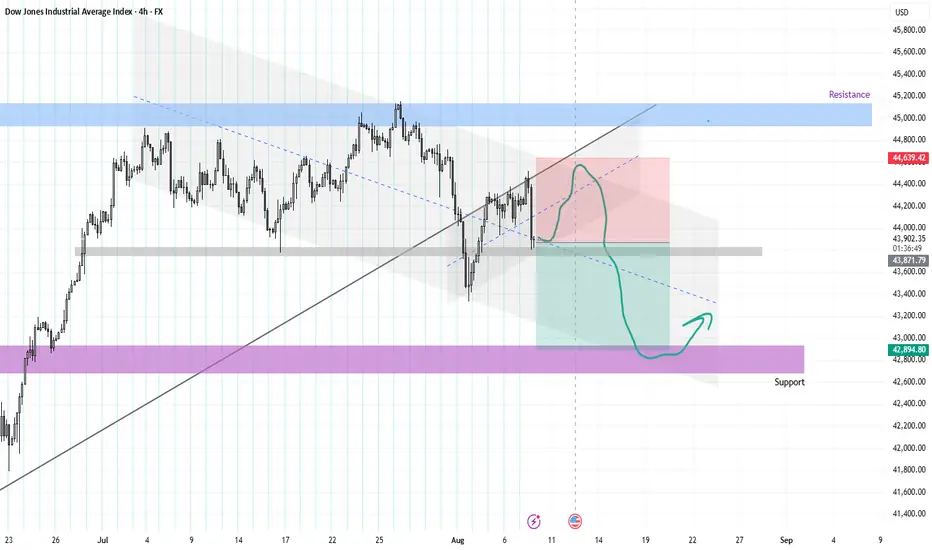
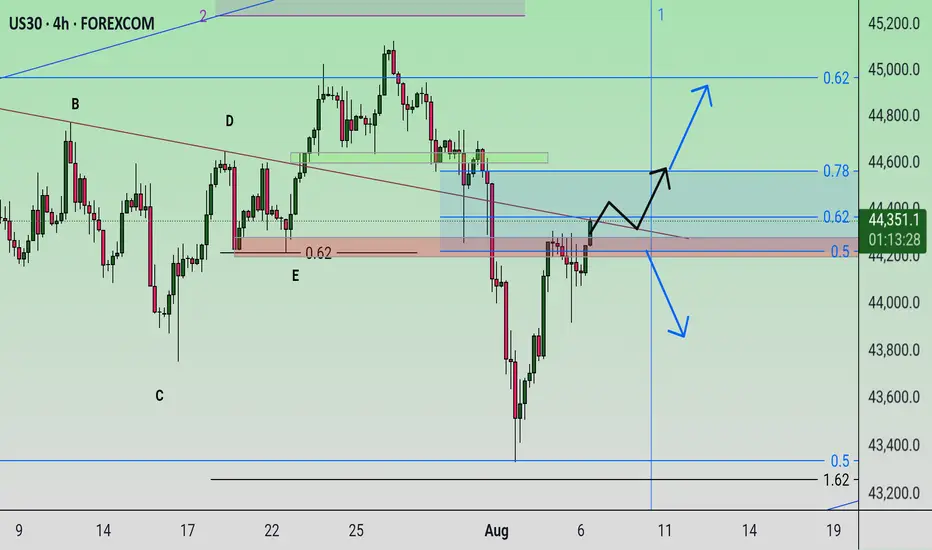
US30This chart displays the Dow Jones Industrial Average Index (4H timeframe), with key technical zones and trendlines marked to illustrate potential price movements. The price is currently at 43,894, just below a key ascending trendline (black) that has been recently broken. The chart also highlights resistance around 45,000 (blue zone) and support near 42,800 (purple zone).
The green curved path drawn on the chart indicates a potential bearish scenario. After a brief consolidation around the current price and broken trendline, the price is expected to fail to reclaim the previous structure, leading to a drop. The projected move suggests a sharp decline toward the support zone around 42,800, where demand might return and trigger a bounce.
This scenario implies bearish pressure in the short term, possibly due to rejection from the resistance zone and loss of trendline support. The suggested bounce near 42,800 implies that this level could serve as a buying opportunity or a reversal point, making it a key area to watch for potential long setups or confirmation of continued weakness.
Short Looking for major bearish momentum when market reaches 44,740 having multiple previous rejections at this level.

Dow Jones Index (US30 / Dow Jones) Analysis:The Dow Jones index opened the day with bullish momentum and is currently trading near 44,500.
🔻 Bearish Scenario:
If the price fails to break above 44,500 and selling pressure returns, a break below 44,200 could push the index back toward 44,000, which is a key support in the short term. A confirmed break below that level may open the way for a drop toward 43,700.
🔺 Bullish Scenario:
If the price breaks and holds above 44,500, which is the more likely scenario, we could see continued upside movement toward 44,700, followed by the strong resistance zone at 45,000.
⚠️ Disclaimer:
This analysis is not financial advice. It is recommended to monitor the markets and carefully analyze the data before making any investment decisions.
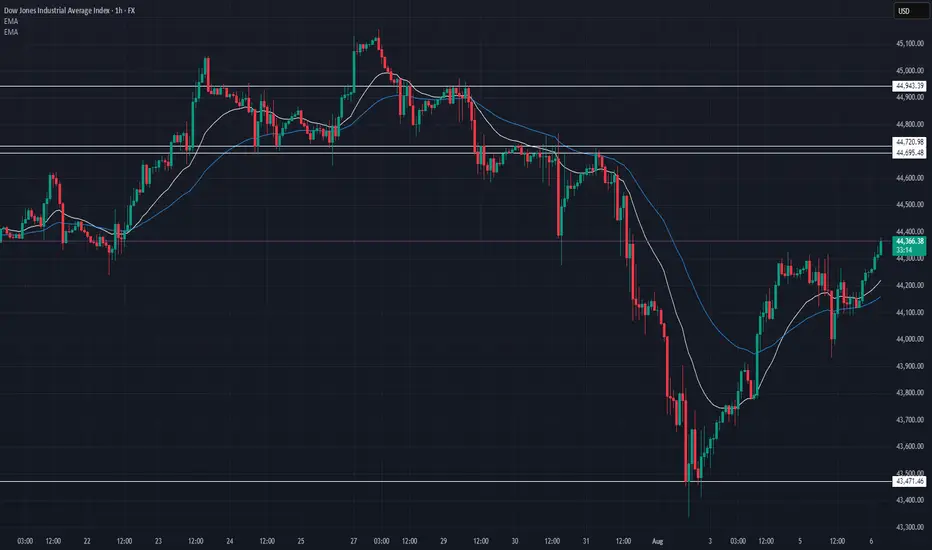
US30 Technical Breakdown – 08/07/2025📍 US30 Technical Breakdown – 08/07/2025
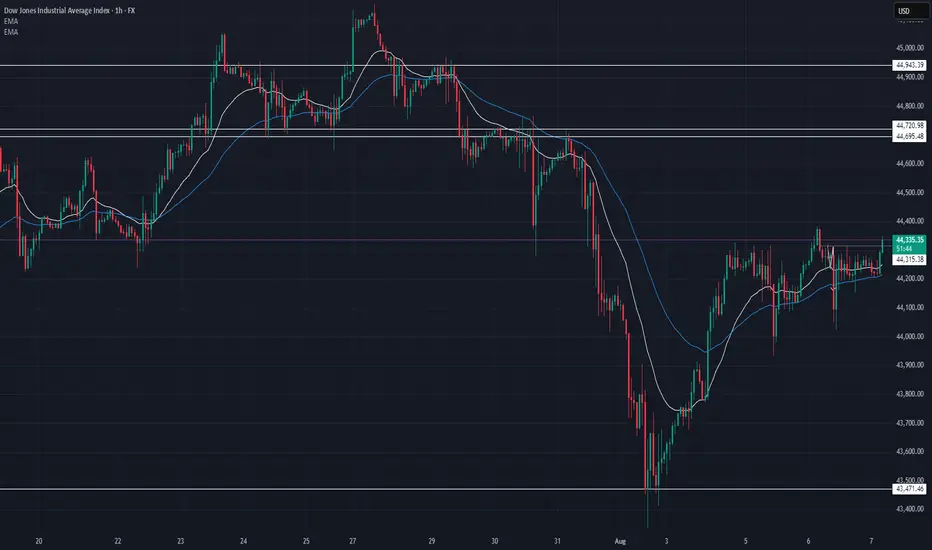
US30 is consolidating below 44,360, continuing to coil tightly after its bounce from 43,500. Bulls have defended the 44,150–44,200 support zone, but upside momentum is stalling ahead of the 44,600–44,720 resistance wall.
This tightening range signals that a breakout—or rejection—is imminent. Volume remains low, suggesting the market is waiting for a catalyst.
📊 Current Market Behavior:
🔄 Sideways chop between 44,200–44,360
📉 Lower volume, tightening price action
🧱 Bulls holding support but struggling to push higher
⚠️ Key resistance test likely in the next sessions
📌 Key Levels:
🔹 Resistance Zones:
44,360 → Immediate breakout pivot
44,600–44,720 → Major supply zone
44,943 → Swing high resistance
🔹 Support Zones:
44,200–44,150 → EMA & structure support
44,000 → Psychological round level
43,471 → Recent bottom
🧠 Bias:
🔄 Neutral Intraday
Range-bound with fading volatility. Watch for breakout above 44,360 or failure to hold 44,200.
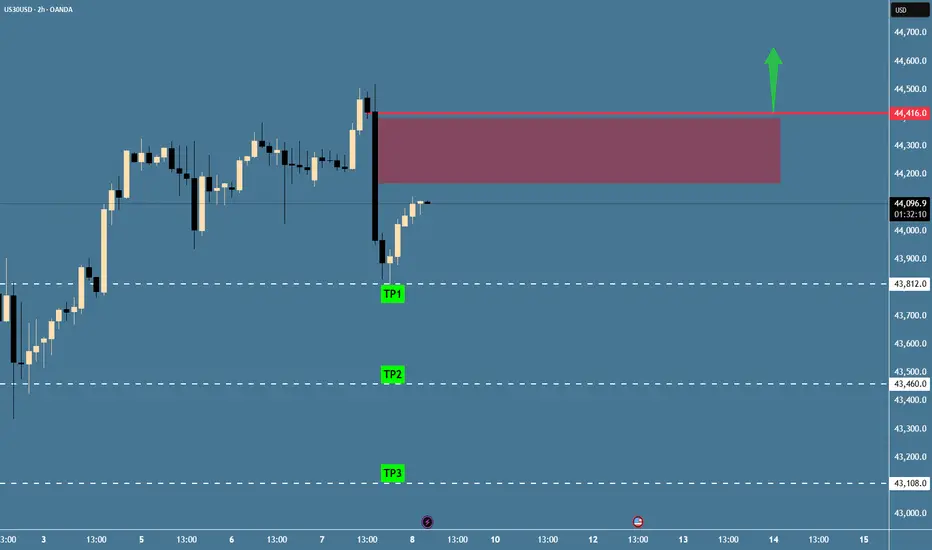
Us30S30 is currently respecting a key support zone, showing strong buyer interest. As long as this level holds, the bias remains bullish, with potential for price to push higher toward the next resistance levels.
Dow Jones Index Analysis (US30 / Dow Jones):The Dow Jones index showed a slight improvement at today’s market open and is currently trading near 44,300 USD, attempting to break through a nearby resistance level.
🔻 Bearish Scenario:
If the price fails to break above 44,300 USD and selling pressure returns, a break below 44,000 USD could send the index back toward 43,350 USD, which is considered a critical support zone in the short term.
🔺 Bullish Scenario:
However, if the index breaks above 44,300 USD and holds — which is currently the more likely scenario — we may see continued bullish momentum toward 44,700 USD, followed by the key resistance at 45,000 USD.
⚠️ Disclaimer:
This analysis is not financial advice. It is recommended to monitor the markets and carefully analyze the data before making any investment decisions.

Uptrend It is expected that the resistance level will be broken and after consolidation above the resistance level, the uptrend will continue. Otherwise, a trend change and a continuation of the correction will be likely.
US30 – Bullish Break Above 44,300.00After bouncing off 43,450.00, US30 surged past 44,120.00 and is now holding above the key 44,300.00 resistance-turned-support level.
Support at: 44,300.00 🔽 | 44,120.00 | 43,770.20
Resistance at: 44,700.00 🔼 | 44,922.00 | 45,136.10
🔎 Bias:
🔼 Bullish: Holding above 44,300.00 could fuel a rally toward 44,700.00 and beyond.
🔽 Bearish: A drop back below 44,300.00 may expose 44,120.00 and 43,770.20.
📛 Disclaimer: This is not financial advice. Trade at your own risk.

US30 Technical Breakdown – 08/06/2025📍 US30 Technical Breakdown – 08/06/2025
US30 continues its bullish recovery from the 43,500 lows and is now pressing into the 44,360 area. Price is printing higher highs and reclaiming key moving averages, building momentum ahead of the major 44,600–44,720 resistance zone.
A clean break above this range could open the door to 44,943+, while a failure may bring a pullback toward short-term support at 44,150–44,200.
📊 Current Market Behavior:
📈 Bullish momentum accelerating
📊 Price reclaiming structure above 44,300
🧱 Major test ahead at 44,600–44,720
⚠️ Overhead resistance – potential reversal zone
📌 Key Levels:
🔹 Resistance Zones:
44,380–44,400 → Immediate resistance (currently testing)
44,600–44,720 → Major breakout zone
44,943 → Last major high
🔹 Support Zones:
44,219–44,150 → EMA and structure support
44,000 → Psychological and structural support
43,471 → Recent swing low
🧠 Bias:
📈 Bullish Intraday
Momentum remains with buyers as long as price holds above 44,150. Key resistance test ahead.
US30; Heikin Ashi Trade Idea📈 Hey Traders!
Here’s a fresh outlook from my trading desk. If you’ve been following me for a while, you already know my approach:
🧩 I trade Supply & Demand zones using Heikin Ashi chart on the 4H timeframe.
🧠 I keep it mechanical and clean — no messy charts, no guessing games.
❌ No trendlines, no fixed sessions, no patterns, no indicator overload.
❌ No overanalyzing market structure or imbalances.
❌ No scalping, and no need to be glued to the screen.
✅ I trade exclusively with limit orders, so it’s more of a set-and-forget style.
✅ This means more freedom, less screen time, and a focus on quality setups.
✅ Just a simplified, structured plan and a calm mindset.
💬 Let’s Talk:
💡Do you trade supply & demand too ?
💡What’s your go-to timeframe ?
💡Ever tried Heikin Ashi ?
📩 Got questions about my strategy or setup? Drop them below — ask me anything, I’m here to share.
Let’s grow together and keep it simple. 👊
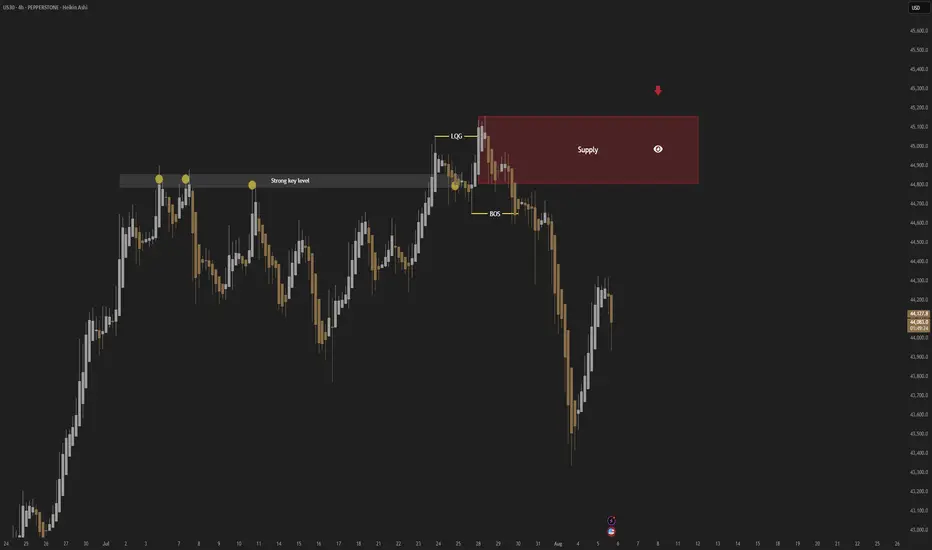

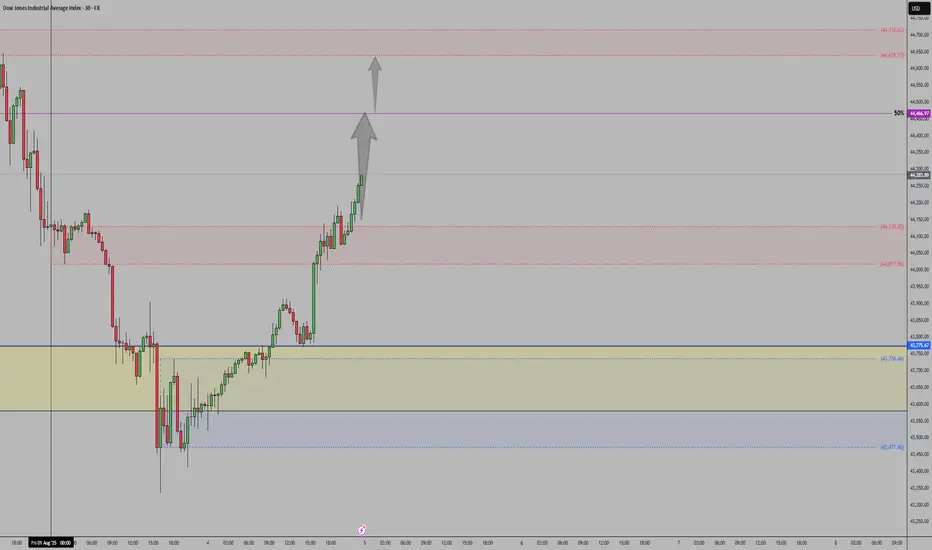
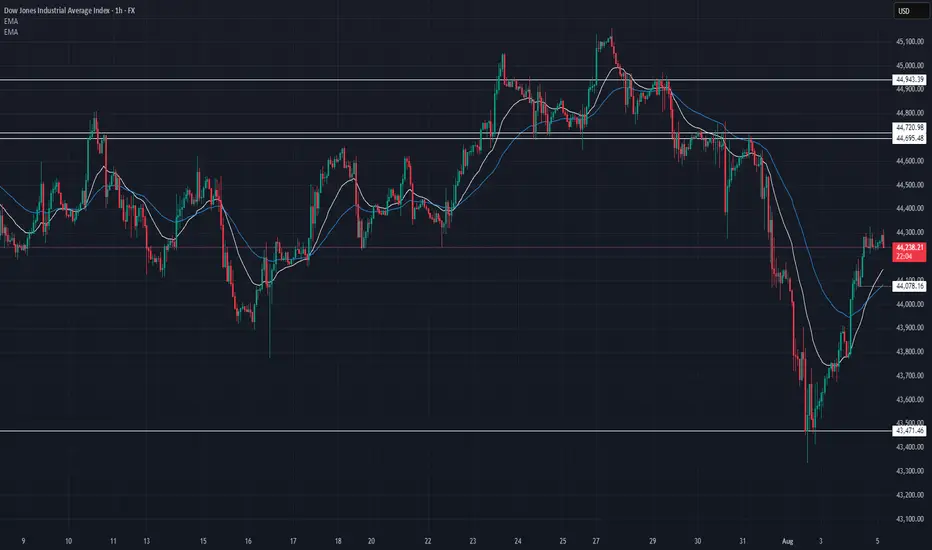
08/05/2025📍 US30 Technical Breakdown – 08/05/2025
US30 bounced hard from the 43,500 lows and is now trading near 44,250, reclaiming key short-term moving averages. The index is approaching a major resistance zone around 44,600–44,720, where sellers previously stepped in.
Momentum is shifting in favor of bulls, but this move could stall unless we see a clean break above the previous breakdown levels.
📊 Current Market Behavior:
📈 Strong bounce off 43,500
📊 Trading above EMAs — short-term momentum bullish
🧱 Resistance overhead at 44,600+
⚠️ Potential lower high if bulls fail to reclaim 44,720+
📌 Key Levels:
🔹 Resistance Zones:
44,300 → Intraday resistance (current level)
44,600–44,720 → Key breakout test zone
44,943 → Major rejection point
🔹 Support Zones:
44,078 → EMA confluence support
43,600–43,500 → Bounce zone
43,471 → Prior low
🧠 Bias:
📈 Neutral to Bullish Intraday
Buyers in control short term, but critical resistance ahead. A failure at 44,600–44,720 would favor reversion. Breakout = bullish continuation.
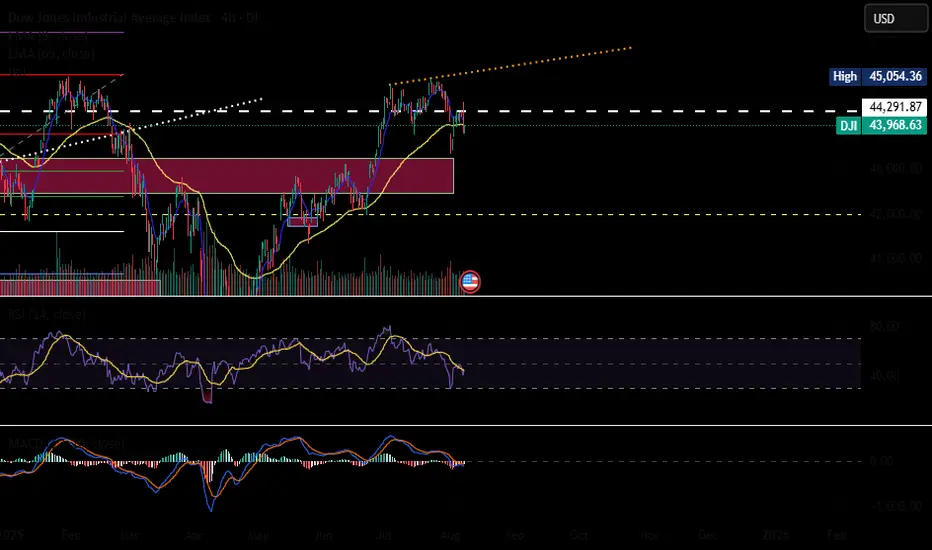
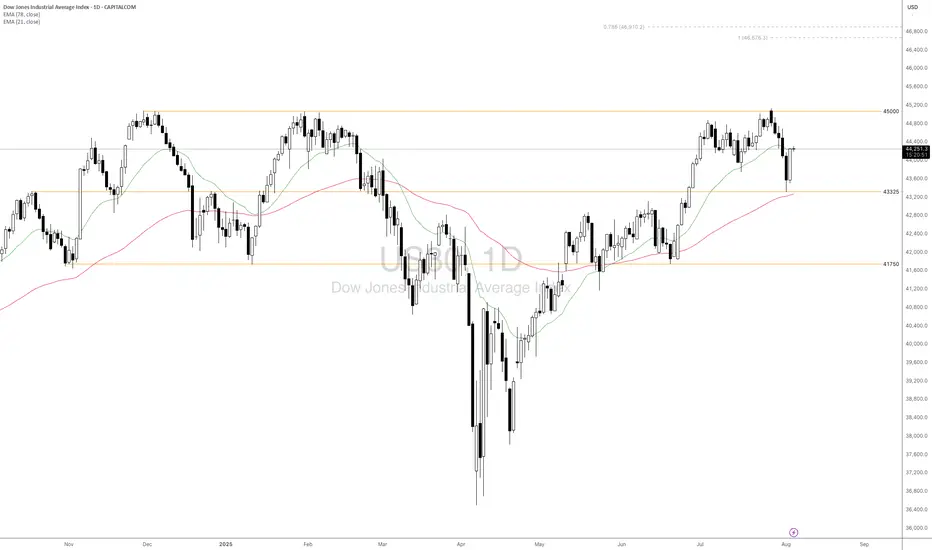
Will The Soft NFP Data Resume the Strength of Dow Jones?Macro approach:
- The Dow Jones Industrial Average advanced this week, rebounding strongly as risk appetite improved following last week’s pullback, supported by a soft jobs report and easing global tariff concerns.
- Sentiment was aided by the Fed’s increased hopes of a near-term rate cut after Non-farm Payrolls missed expectations, prompting a 1.3% surge on Monday. Broader market sectors responded favorably to resilient earnings and softer economic prints.
- The index may remain sensitive to upcoming US inflation data, US service sector data and Fed communications, with labor market softness and further trade headlines poised to influence direction this and next week.
Technical approach:
- US30 significantly rebounded yesterday, erasing half of the losses from the last 5-losing streak last week. The price is hovering around EMA21, indicating a short-term sideways momentum and await for an apparent breakout to determine the trend.
- If US30 breaks above key resistance at 45000, the price may surge further to test the Fibo Extension confluencing area around 46800.
- On the contrary, failing to hold above the support at 43325, confluence with EMA78, may prompt a deeper correction to the following support at 41750.
Analysis by: Dat Tong, Senior Financial Markets Strategist at Exness
Dow Jones Index (US30) Technical Analysis:The Dow Jones Index has bounced from the 43,350 support after a sharp decline, currently trading near 44,000, testing nearby resistance.
🔹 Bearish Scenario:
If the price fails to break above 44,200 and selling pressure resumes, a drop below 43,800 could push the index back toward the 43,350 support area.
🔹 Bullish Scenario:
If the index breaks and holds above 44,200, the bullish move may continue toward 44,700, with further potential toward the 45,150 resistance zone.
⚠️ Disclaimer:
This analysis is not financial advice. It is recommended to monitor the markets and carefully analyze the data before making any investment decisions.
Sell US30US30 Sell Idea
Bearish Flag Pattern at NY open. Price should rapidly decline in the next few hours

US30 ShortUS30 Short Setup – Bearish Retest Play
Idea: Looking for a short opportunity after a clean break of structure and trendline.
Breakdown:
Trendline Break: The rising trendline (yellow) has been decisively broken, signaling a shift in market structure.
Structure Shift: We saw a strong impulsive move to the downside, breaking previous higher lows and confirming bearish intent.
Key Resistance Zones: Price is now pulling back toward a key supply zone between 44,100 – 44,300, which aligns with previous support-turned-resistance.
Plan: I’m anticipating a potential lower high formation around this zone, followed by rejection and continuation to the downside.
Target Zone: My short target is the demand area around 42,900 – 42,600 where price last consolidated before the previous rally.
Invalidation: If price reclaims and holds above 44,400, the short idea becomes invalid.
