VXX - manipulationVXX cratered when the plunge protection team (Trump with his tweet) decided to set parameters around today's sell-off to have a very tight trading range. Down 70 cents from the open. This nonsense won't last in 2020. Looking for volatility to pick up dramatically.
ATMP trade ideas
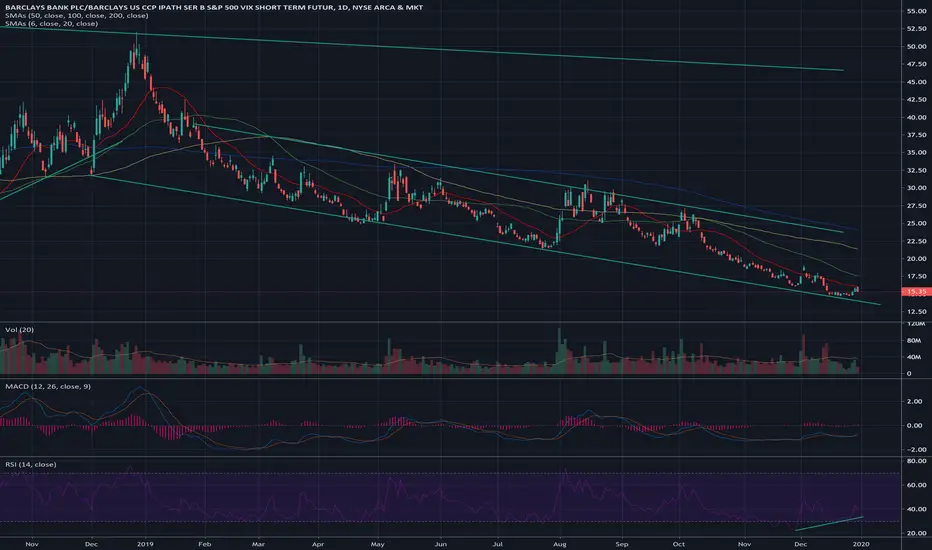
VXX - tight daily trading rangesVXX has done nothing but slide all year as volatility VIX remains below historical norms. RSI divergence and tightest trading ranges I've seen all year. Looks like something has to give soon. Six cent trading range today so far. This just can't continue to stay this way. Market maculation at its finest.

OPENING: VXX 14/15 JANUARY 17TH ZEBRAWith VIX hovering around 2019 lows, re-upping with another "Zebra" ... .
Metrics:
Max Profit: Undefined
Max Loss: $221/setup
Break Even: 15.23
Delta/Theta: 85.16/-1.07
Notes: There are several different ways to look at this trade: (a) as a long call vertical + an additional long call; (b) long calls, the cost of which is cut by selling a short against; or (c) a synthetic long stock position (at least on setup, since its delta is dynamic). In any event, looking for a pop between now and expiry. Take profit on these is subjective, since it's awfully hard to tell when VIX has topped out and max profit in the setup is "theoretically infinite" due to the additional long call present in the spread.

VXX - Room to go!Market giving all the bears another bite at the apple this morning with Bloomberg report that trade talks are moving along...."sources said". Ultimately looking for this to trade up to the 25 area which would coincide with a correction in the market that could still sustain a continue uptrend. RSI and MACD favorable. Look for a retracement down in the 17.50 to 17.80 area before next leg up. VIX under 15 again this morning. Need a move above 18 in VIX for VXX to get moving to that 25 area.
Power Play Special. Long with much caution. Possible huge upside play with bullish option flow throughout the month. I don't recommend playing this one however. Very risky. Short term target 17.71, then will find support around 16. Possible move to 25 late December.

OPENING: VXX DEC 20TH 16/18 "ZEBRA"I've dicked around long enough waiting to put something on at or near VIX lows, and I like this particular setup here, although I obviously didn't catch things at VIX lows.
Metrics:
Max Profit: Undefined/Infinite
Max Loss: 3.03 ($303)
Break Even: 17.51 versus 17.57 spot
Delta: 98.9
Theta: -.83
Notes: With the classic "Zebra", you're looking for a setup in which the short option "pays for" all of the extrinsic in the longs, resulting in a break even at or below where the underlying is currently trading. Given the delta metric, you're basically in synthetic long stock. The max profit is "theoretically infinite," with the long call vertical aspect of the setup converging on max at >18 and the additional long call converging on an instrinsic value where the underlying is trading.
Naturally, a monstrous pop would be nice, but will probably money, take, run at the earliest opportunity. From a trade management standpoint, this is basically "unmanaged" -- i.e., it works or it doesn't ... .


VXX - VIX Tracker?VXX is a very tough instrument to trade. Although it tracks volatility, it has many factors that contribute to its decay over time when compared to historical VIX levels. As such it is best to set s top loss on this and only trade what you are willing to lose. This has been trading lower now for 7 weeks or so and today's drop looks like it could be close to a turning point. Not sure it happens this shortened holiday week but I'm looking for a move back to the midline very soon, and something bigger over the next couple months. VIX is under 12 today and typically this has market bottoms in volatility.

TRADE IDEA: VXX -16P/+18P/+18C/-20C SUPER BULLI'm not hugely fond of going long volatility, particularly in an instrument that gets routinely battered by contango and/or beta erosion.
With VIX closing in on its 2019 low, however, it may be time to consider one.
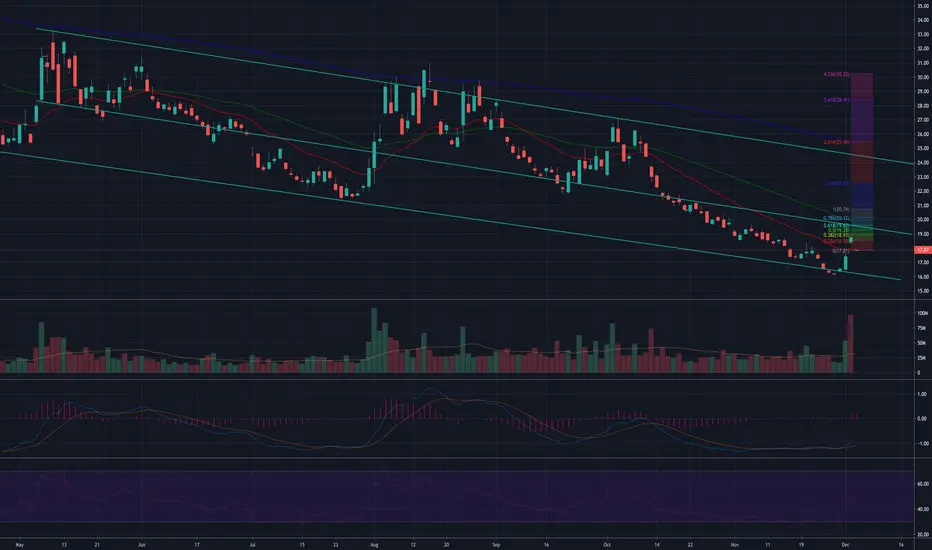
Pictured here is a VXX "Super Bull" made up of a 16/18 short put vertical and a 18/20 long call vertical. As of Friday close, it pays a small .11 credit, has a 2.11 max profit, a 1.89 max loss, and a break even of 17.89 versus 18.87 spot, with max profit assuming a finish above 20.
You can also go smaller -- the 17/18/18/19 pays .07, has a max profit of 1.07, a max loss of .93, and a break even of 17.93.
Look to manage aggressively starting at 25% max ... .

$VXX So looks like it might bounce up to $28 which is about where the EMA50 on the weekly time frame. Do you use the EMAs? I have set mine to 20 and 50 as there is a lot of price action interaction with these settings. (EMA - exponential moving average)
Also I have no fucking idea how this instrument works, im just noticing a pattern with that EMA which would be my target (to ride to that EMA or last high or low or S/R line. Generally thats how i set my targets

The market looks good until this hits 10Good day folks,
VXX is trading in a range from 10 to 55. The RSI is falling and the VI is bearish. 30 was tested a few time and couldn't hold, so I believe VXX will continue to fall until it reaches 10. Ofcourse, if it reaches this price I will load a few shares.
Volatility falling, I think the US market will continue to rise for the next few months.
Thank you,

Experiment with Ghost candles and Call option expiration VXXGhost candles and Call option expiration for VXX on a day chart for the next 4 weeks
(first chart was skewed)

Experiment mixing Ghost candles & Call option expiration for VXXExperiment mixing Ghost candles and Call option expiration for VXX on a day chart for the next 4 weeks

VXX long Maybe the bottom is in . RSI ovesold , MACD is turning bullish and a bullish wedge pattern , trade with a SL under the lower candle

VXX Possible movement I think this is a bottom.
Using ghost candles to project the trend over the next two weeks.

VXX plodding along. Should bottom today around $24.25 unless Trump tweets something in Chinese
Much easier to see the trend on the 2, 3 or 4 hour charts.
A lot of trading happens in the extended hours


VXX - Long opportunity from support level VXX seems to be a pretty decent buying opportunity at the current price. It's trading near strong support and we think it has a good chance of bouncing off from this support and run above 28 levels.

OPENING: VXX JAN 17TH 22/23 LONG PUT VERTICAL... for a .45 debit.
Max Profit: $55
Max Loss: $45
Break Even: 22.55
Delta/Theta: -2.81/-.11
Notes: Here, a bet that beta slippage and contango eat away at this VIX derivative over time ... .


VXX is a Great BuyThis market Can go much lower but could bounce on these levels before it go lower.

Double Breakout Setup for Volatility ProductsVXX, VIX, TVIX, VIXY, etc all consistently banging against a descending diagonal trend line, meanwhile also printing an inverse head & shoulders pattern. A break above neckline or DTL suggests a massive move higher for volatility, which spells trouble for equities and indices.
