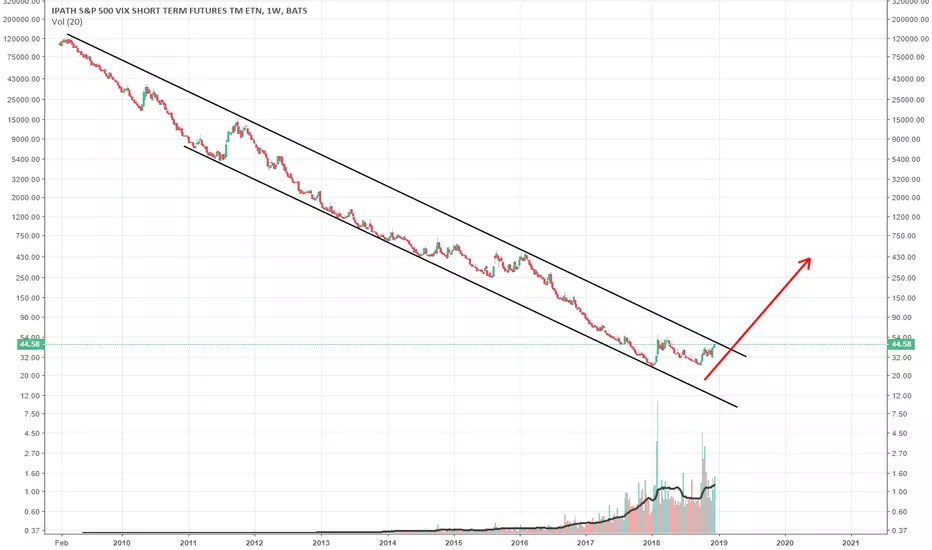
History repeatingTwice in the last year this has created very clear descending wedge patterns (bullish reversal) that break with heavy volume following a tightening range. I'm waiting for the next one to form.
A slight bullish divergence in the RSI suggests we may be heading to higher VXX in the future. If this third wedge forms, the breakout could mark the right shoulder of a head and shoulders pattern on the S and P.
ATMP trade ideas

VXX at supportwould like to see some sort of up move tomorrow to confirm. 55 by friday for powell? $SPY

$VXX we're going to see another round. New target $52$VXX we're going to see another round. New target $52

Market Analysis and Forecast for 2019I think the markets have scaled back is because of overall debt. In the video I explain the difference between the 2009 crash and today's market downtrend.

Big Green day...What's next??Look for an open higher VXX (lower your favorite tickers). I look for a short on the open then will go long on my watchlist tickers. If not I believe for price action to yield little results from yesterday's move. Good luck!!


VXX -Getting up there! Hmmm...With the recent sell offs VXX is getting pretty volatile. Wondering what sparks the market sell off to create the bullish spike in VXX soon? Looks like around Dec 21 zone. This would complete the Cypher Pattern and lines up with other resistance and channels as shown and Completing wave C up.


The FUTURE High / Low price swing dates for VXX (IPATH S&P 500)Apply your own indicator(s) to determine price swing direction.


#VXX #VIX #SPX #SP500 Head and Shoulders Nearing CompleteI wrote, earlier that We looked like we could be getting a Head and Shoulders on the #VIX #VXX, what that means that volatility was looking to deteriorate, #SPX #SP500 would see a rally. We saw that this past week. Waiting for this break to see IF there is more upside in #SPX.

Year end rally repeating?Good day folks,
Pretty simple setup, VXX made a double-top. The second one was a head and shoulders that seems to be completed (see my previous chart for more info).
I’m not a big fan of shorting volatility as I feel it brings bad karma lol. Being long the indexes is basically the same for those who also feel the same.
I put 2 targets as we cannot know yet if the neckline of the double-top will hold or not. And it could also rebound for a few days.
Target 1 at neckline or 32.00 (cash and wait);
Target 2 at support or 26.00.
If this pattern works out, the indexes are in for some serious gains.
Have a nice weekend,

Another possible Head & ShoulderGood day folks,
Looks like the market wants to go up. Is it going to last? I don’t know, but from what I can see on VXX, the pain is not yet over.
Basically, if this H&S materialize, the market could go higher for the next 2-3 days, then making the right shoulder would bring it lower. Pretty much flat for the next few days until next week, then we could see more movement on either side.
I’m a little bit late imo to trade the head drop in VXX at this time. I prefer to wait and trade the right shoulder both sides.
*Keep in mind that the last H&S in VXX did not sell, so better to wait for clear movement.
Thank you,

VXX is building a head and shoulder patternI think VXX is in the process of building a head and shoulder pattern. It may continue downward from here toward at least $32 then possibly drop to $25 as the first support or even to $22 based on the target for head and shoulder which is about the same as bottom line of the channel

#VXX #VIX #SPX #SP500 Head and Shoulders?on the VXX we possibly see a Head and Shoulders pattern forming. If this confirms and breaks, then we could see much higher prices in equities. My feeling is that we may stop at the neckline and we resume higher. My thinking behind lower prices in equities stems from late cycle, global growth slowing down and inflation. We may see higher bond yields which would put more pressure on equities.

FALLING WEDGE on VXXIn the chart of IPATH S&P 500 VIX SHORT TERM FUTURES TM ETN ETF , in a 1 hour time frame, after a previous bullish trend, has formed a continuation falling wedge pattern where it suits us to open a long position. It has two upper touches and three lower touches. Also, the current price has not broken the upper trendline yet, so we must wait it to happen and set a long position.
The price target or take profit can be placed at $41 approximately and the stop loss can be settled at $35.
