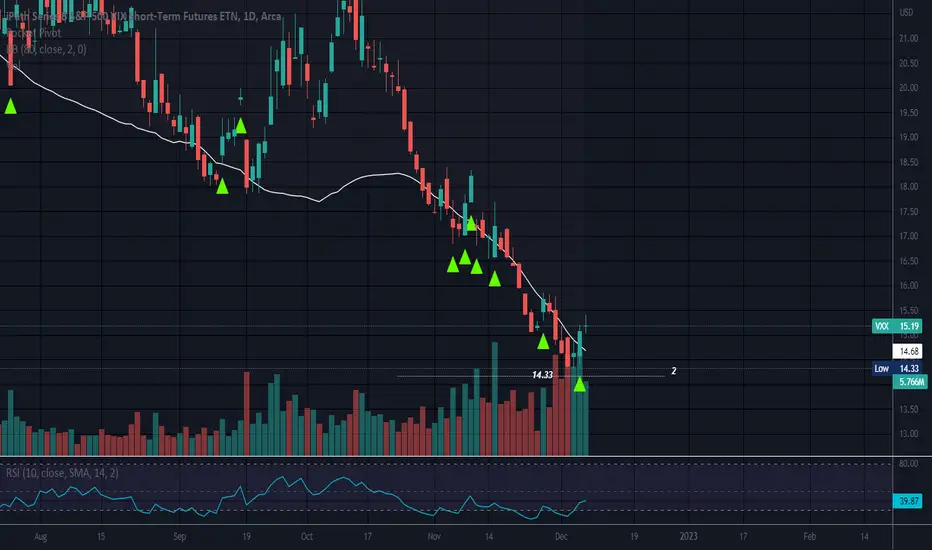
How Low Will it Go?VXX went down to 14.33. From what I an find that is an ATL (all time low)
Very low in the scheme of things.
No recommendation
ATMP trade ideas
$VXX looks like it's about to explode higherSo far the selloff has been pretty orderly the entire year and trying to play volatility hasn't worked. I think that's about to change.
$VXX has been consolidating in these two channels and looks like it's about to explode higher. If we can see $VXX get above $21 or so, I think we're about to see a huge move in $VXX. Similar to what we saw in March 2020.
I've marked off key levels of resistance on the upside. Let's see if it plays out over the coming weeks.

Ready for some volatility?Historically VIX bottoms around $20 and then tends to create some chaos. As we see here the VXX RSI has bottomed and MACD is close to crossing up. Looks like an upside move for VIX and VXX soon.

Big move in VXX brewingWhat we have here is a very LOOONG pennant on VXX. We already had the breakout back in September and since then have created a whole pennant for the retest of the breakout. From how things look now, the apex of the smaller pennant is due to breakout no later than November 22. The yellow rectangles are gaps within the price action. The retest has a gap to be filled and the breakout target is RIGHT at the gap fill of the second from bottom gap. Breakout target for VXX is $27.30
Combine this chart with what I just recently shared on SPY, shows there are darker days ahead.

VXX
Looks like we located a potential market anomaly on the daily timeframe. As we approach a potential end to the A/C wave, there looks to have been a sign of weakness as we have a few candles during the most recent a/c wave that are giving us some information (Bullish candle/bearish volume). Since then we have seen price start a small bullish move. Looks like an expanded flat where are at now. The MacD is starting to shift momentum towards the upside and would love to see a crossover while price attempts to reach up to 50%-70% of the previous wave (wave B) high. An impulsive wave would be an early Christmas. Happy trading!

VXX (VIX ETN) hints yet again of increasing volatilityRushing this out before market opens...
The VIX index is rather special (to me) and it is not feasible to use usual technical analysis on that chart IMHO. So, I use the VXX (VIX ETN) for a better idea when volatility spikes might occur. Am observing one just now with an apparent alignment of weekly adn daily factors in the charts.
On the weekly chart, noted that there was previously a bullish divergence where the VXX kept going lower whilst the MACD (left lowest bottom panel) crept up. Noted that when we had the MACD crossover, the following week(s) come with volatility spikes. There is an early indication that we might see a MACD crossover this or next week, suggesting that August would be volatile. The candlestick formed last week gapped up, attempted to close the gap, but closed at the high. This is a rather bullish candlestick, and an identified wedge breakout just might happen this week.
The daily chart uncannily bears (pun not intended) a similar pattern, but with more details, as the last day of last week closed in a similar looking candlestick, along with a gap up (that attempted to close and reopened), as well as a MACD crossover. These MACD crossovers in 2022 have been marked, last posted about this on 12 Feb 2022, which saw a period of higher volatility. Then formed the identified wedge, and bouncing off the wdge support twice, this time, it suggests that volatility is about to spike, and would probably breakout of the wedge.
Taken together, this uncanny alignment forewarns of clear and present volatility for the weeks to follow...
Having said that, I suspect that this is might be a short and sharp spike that could end the bearish status for a couple of months until we get into 2023. That's another discussion altogether.
Meanwhile, hold on to your pants, be ready for the volatility storms!


VXX Good entry for long postion.Good Risk reward here on VXX.
$21 a good price level for entry to upside with SPY closing the $400 gap.
Long hold.

VXX - Amazing time to load on more VXX!-VXX being limited from Barclays is already high, higher than it normally should be.
-Any smart investor should take the great opportunity VXX offers. Not only its deemed to drop in the long term due to SPY's overall statistical tendency to rise, but also at some point Barclays will print them more, and then it will drop even more aggressively.
-Print them puts or open some short calls Ladies and Gents!
OUR EXPECTATION:
We think VXX might rise a little more from this point on due to SPY dropping lower and lower, but its good to start shorting now and slowly adding on each rise in VXX.

VXX short using weekly put optionFundamental Analysis
Taking advantage of the recent volatility tracked by the VIX, and using VXX ETF for exposure to the VIX Future.
Recently the market is poised to move into bearish territory with rampant inflation and the Feds hands tied in making monetary changes swiftly.
Technical Analysis
Chart is forming a double-top pattern in the making.
MACD cross of May 10th approaching zero level.
Stochastics approaching 20 level.
Chart forming a wedge pattern hovering around 38% retracement.
RSI hovering around 50 level and below 14-day SMA. Awaiting further confirmation
Looks like a 40% chance at the moment of this publish for the short to succeed.
Using stop-loss to manage risk.

VXX moving sidewaysDespite the recent volatility in the tech sector, the S&P 500 VXX is still operating as if in a low volatility environment. VXX is a good hedge for a portfolio but technical analysis is showing sideways momentum, with key resistance levels at 30.18 still not broken. This low volatility in general can help in getting in at a cheaper price for when volatility does kick into full gear, or to purchase a longer-dated call option for when volatility does kick into high gear.

VXX - The only safe haven we have!-Lads and gents, don't even bother yourself with pointless technicals and fundamentals, right now the market has nothing to offer you all except uncertainty.
-While VXX on the other hand has the amazing opportunity as it is no more supplied, so limited supply + rising volatility due to the market condition, create this one-time opportunity to load on them vertical/naked shorted calls! Sell as many as you can for 40-50 day period.
-Once they will start printing vxx again and spy will slowly find a support, vxx will drop like a rock

VXX Long Trade AMEX:VXX TVC:VIX VANTAGE:SP500
The main reason to be bullish in an instrument that is -99.99% down and continues to depreciate all the time is that VXX usually sees explosive moves when the S&P 500 declines, and the moves in VXX typically far exceed the movement in the S&P 500. And so as the S&P just made lower high and lower low and we want to protect our portfolio from the possible upcoming drop which is obvious with the fundamentals around with spiking inflation and interest rates and just technically we can expect -150$ drop in the index, and if we break this resistance level than we can expect an even bigger decline and the possible Take Profit level could be placed even higher, on the other hand, it is a very volatile instrument and it is preferable to be more conservative in taking profits.
Entry 26$
SL-23.50(1.50$)
TP1-30$ :Risk-Reward 1.50
TP2-36$ :Risk-Reward 3.90

VXX - Shorts seems to be running out of steamEarly to say, but VXX is starting to diverge from the MAs...suggesting flag breakdown.
Still time to snap back above 24.5, but the downside risk seems higher now.
Keep your shorts lights until action is clear.

VXX - Something BIG is brewingCup with Handle on the VXX --- Oh, it's HOT alright..
I'm betting on a breakout...maybe one last shake out first? ....

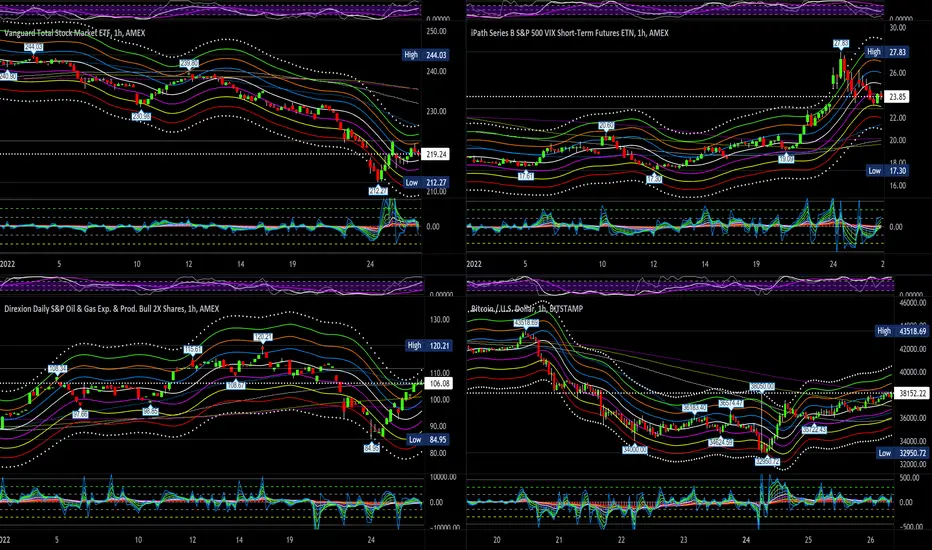
Fed Watch Charts 1/26 @ 2pmFOMC Interest Rate Decision is at 2pm today, followed by a press conference at 2:30. Federal Open Market Committee (FOMC) members vote on where to set the rate. Investors watch interest rate changes closely as changes in interest rates can have both positive and negative effects on the markets. The Fed lowers interest rates in order to stimulate economic growth, as lower financing costs can encourage borrowing and investing. However, when rates are too low, they can spur excessive growth and subsequent inflation, undermining the sustainability of the economic expansion. When there is too much growth, the Fed can then raise interest rates in order to slow inflation and return growth to more sustainable levels. Here's a 4 split chart window of VTI (total US equity market), VXX (S&P Vix), GUSH (Oil & Gas) & Bitcoin. I didn't care to fit in TLT or TLH (Bond) chart. Below is a list of Interest Rate history:
Jan 26, 2022 14:00 TBA
Dec 15, 2021 14:00 0.25%
Nov 03, 2021 13:00 0.25%
Sep 22, 2021 13:00 0.25%
Jul 28, 2021 13:00 0.25%
Jun 16, 2021 13:00 0.25%
Apr 28, 2021 13:00 0.25%
Mar 17, 2021 13:00 0.25%
Jan 27, 2021 14:00 0.25%
Dec 16, 2020 14:00 0.25%
Nov 05, 2020 14:00 0.25%
Sep 16, 2020 13:00 0.25%
Jul 29, 2020 13:00 0.25%
Jun 10, 2020 13:00 0.25%
Apr 29, 2020 13:00 0.25%
Mar 15, 2020 16:00 0.25%
Mar 03, 2020 10:00 1.25%
Jan 29, 2020 14:00 1.75%
Dec 11, 2019 14:00 1.75%
Oct 30, 2019 13:00 1.75%
Sep 18, 2019 13:00 2.00%
Jul 31, 2019 13:00 2.25%
Jun 19, 2019 13:00 2.50%
May 01, 2019 13:00 2.50%
Mar 20, 2019 13:00 2.50%
Jan 30, 2019 14:00 2.50%
Dec 19, 2018 14:00 2.50%
Nov 08, 2018 14:00 2.25%
Sep 26, 2018 13:00 2.25%
Do your own due diligence, your risk is 100% your responsibility. This is for educational and entertainment purposes only. You win some or you learn some. Consider being charitable with some of your profit to help humankind. Good luck and happy trading friends...
*3x lucky 7s of trading*
7pt Trading compass:
Price action, entry/exit
Volume average/direction
Trend, patterns, momentum
Newsworthy current events
Revenue
Earnings
Balance sheet
7 Common mistakes:
+5% portfolio trades, capital risk management
Beware of analyst's motives
Emotions & Opinions
FOMO : bad timing, the market is ruthless, be shrewd
Lack of planning & discipline
Forgetting restraint
Obdurate repetitive errors, no adaptation
7 Important tools:
Trading View app!, Brokerage UI
Accurate indicators & settings
Wide screen monitor/s
Trading log (pencil & graph paper)
Big, organized desk
Reading books, playing chess
Sorted watch-list
Checkout my indicators:
Fibonacci VIP - volume
Fibonacci MA7 - price
pi RSI - trend momentum
TTC - trend channel
AlertiT - notification
tickerTracker - MFI Oscillator
www.tradingview.com
VXX Bearish inclined Naked Calls 1 Apr Expiry (Apr Track 1)Whats The Plan/Trade/Thought
I purposely ended my March trades last week because I felt this week would be super volatile given the Fed announcements on interest rates. This play turned out well as I got to write VXX calls that end 1 Apr at an amazing price
On the 15 March, I noticed that the VXX had stopped correlating with the market and I believe this had to do Barclay suspending new share creations of their VIX Short Term futures ETN (VXX). In a statement, the bank said it ran out of issuance capacity for the two products and would halt new creations indefinitely. It claimed the halts were not a result of the war in Ukraine
This divergence, allowed me to quickly write VXX Call options that expires 1 April at $3 a contract. I decided to use a smaller Margin (50k) because it is still a VUCA global situation and I wanted to have room to maneuver. I have also never seen the VXX diverge so drastically before.
I also believed that the Fed’s announcement would already be factored in to the past weeks and current volatility
I Feel
Pretty damn good, the VXX as aligned back to the market and right now the market is pretty bullish. Lengthen my distance to strike.
Imagine Yourself Taking The Other Side
This trade is very opportunistic in timing and volatility. There is no way I would take the other side given the price movement.
Imagine Yourself As A Neutral Observer
The risk of this was the unknown of why the VXX was diverging from it’s original intention and what the implications where.
Look For New Information
I did a search to understand what was going on with the VXX, but I decided that it was better to look and based my decision on the current sentiment of the market.
How Do I Feel Now
I am very very happy with this play as it mitigated risk by having a shorter time frame, high contract price and also leveraged my understanding and tracking of the market’s key events.
Trade Specs
Sold 60 Calls @ 3.00 - Strike 58
% to Strike 41%
ATR 98%
BP used 51k
Max Gain: 18k

Most Overlooked Opportunity of 2022 - VXXHi Everyone,
Excited to share some good news for our fellow options traders!
-One of the market's most popular instruments, $VXX, recently underwent an anomaly of an event that hasn't occurred in over 10 years in the volatility-trading space. On March 14, 2022, Barclays announced a suspension of share sales and issuances on the iPath® Series B S&P 500® VIX Short-Term FuturesTM ETNs (BATS: $VXX).
-Generally speaking, the $VXX is built to track the first- and second-month VX futures on a rolling basis. Barclays, the issuer of $VXX, doesn't actually hold underlying futures contracts to maintain the ETN, rather, it tracks the performance of the underlying futures contracts on a rolling basis. The product that the ETN tracks is known as the net asset value (NAV) or "indicative value" of the underlying ETN. Issuers use NAVs as a metric to match their ETN prices to their NAV. Essentially, in order for Barclays to maintain the publicly traded product, they match long and short order flow on their ETNs. For example, if a trader wanted to buy 1,000,000 VXX ETNs in one transaction block, Barclays will usually issue 1,000,000 shares of VXX to keep the price of the ETNs the same. On traditional shares of stock, however, 1,000,000 shares of stock in one transaction block could change the stock price due to an increase in demand and a shortage of supply. Equities, unlike ETNs, do not issue shares of stock for order flow to keep the price of the security at its NAV. Whereas, ETNs generally issue notes to keep the ETN price at its NAV.
-Considering that Barclays is no longer issuing shares for their $VXX ETNs, long order flows will not result in the issuance of new shares.
So, what does this mean?
Let's say you purchase 1,000,000 shares of stock, similar to the equity example made in the last paragraph. The purchased shares are no longer issued by Barclays to keep the price of the ETNs at their NAV. Rather, the existing market participants must sell their 1,000,000 shares of stock to you. Due to the increase in demand, the price of the ETNs will increase past their NAV.


VXX 50% gainerWatch for the pop! If you haven't been in by now you probably live under a rock.
It can go higher than $38 and might even blast through it.

Why VXX exploded and what it means for volatility (VIX)One of the big market events today is the explosion in price of AMEX:VXX which according to the issuer Barclays has nothing to do with Ukraine or market events. I think it is tangentially related in some way to the market conditions but what does this actually mean for the near future of volatility? I look at TVC:VIX as a measure of the "fear index" of the S&P500. The VIX can be very useful in timing market tops and bottoms as it represents maximums of emotion. The VIX is telling us something about the current lows of the market and how the recent correction might soon be over.

VXX- BUY THE EFFING DIP (AGAIN)Nothing has changed in this cycle...except that drawdowns have been very steep in individual names. Doesn't mean we will see bearishness in months to come...there will be big rallies...enough to strangle shorts and dump to kill longs.
Best idea is to trade lighter and not to be greedy.

CAUTION: VXX Is Broken!The pricing of the VIX futures tracking ETN VXX no longer reflects reality.
Barclays has halted new issuance of both the VXX and OIL ETNs.
Existing shares of VXX are being bid up far beyond the movement in the underlying futures market.
As I mentioned in a previous post, (linked below), I believe the VIX is setting up for a breakout to the upside.
I strongly caution against trying to trade VXX right now. For one, trading has been halted repeatedly, which may happen again, and you NEVER want to get stuck in a position that you can't trade out of. For another, VXX pricing is no longer tracking the VIX futures, so it's impossible to predict how VXX will respond to a significant move in the VIX futures.
When the price action in a market is irrational, technical levels become irrelevant, fundamentals become irrelevant, and you can't expect logical price movements from the market. For example: See the recent price action in crude oil futures (CL1!).
One of the most valuable skills in trading is recognizing when not to trade.
VXX right now is like a crate of 100 year old dynamite sweating nitroglycerine in the desert heat. DON'T TOUCH IT!
Stay safe out there traders!
