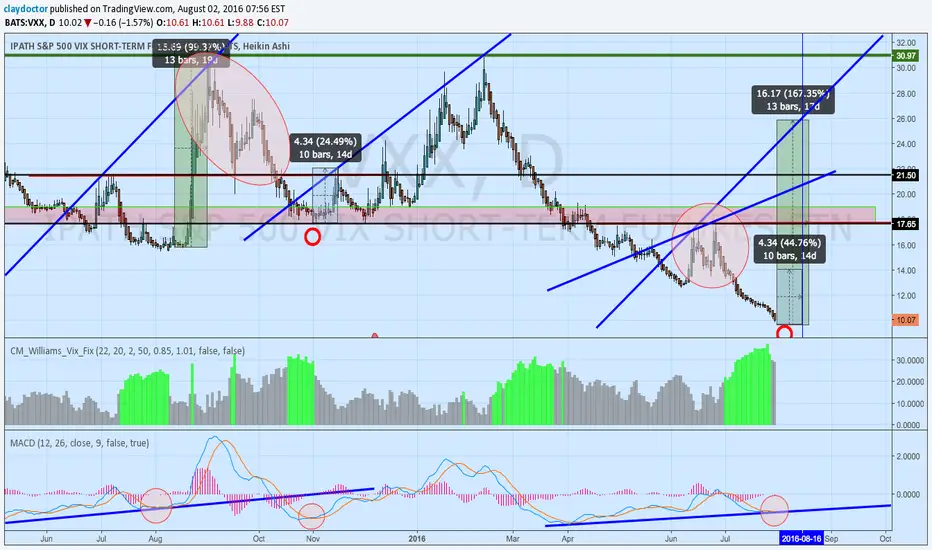
VXX should open upThe VIX futures had a strong move up after the market closed. the VIX rtfs/etns should open higher. The high volumes also correlate with improving RSI. It is not clear whether the SPX500 will keep falling with increasing volatility going forward. tntsunrise shows a possible rise in the SPX500 to a shorting zone, then a further fall. VXX may be traded in the short zone if that happens. A starting VXX position may be taken here with a stop loss. Check the VIXM chart for a daily RSI approaching 50 in an uptrend per my prior post. Big rises in VIXM requires several days of SPX500 crashing. Note the VIX rtfs/etns usually decline except when the SPX500 is crashing/falling. They are not truly coupled to the VIX but are like fiat currencies.
ATMP trade ideas

SPY down underway Pattern, PA & Cycle - half risk sizeExpecting Medium to Major dive for cycle, broadening wedge & unusual volume drop.

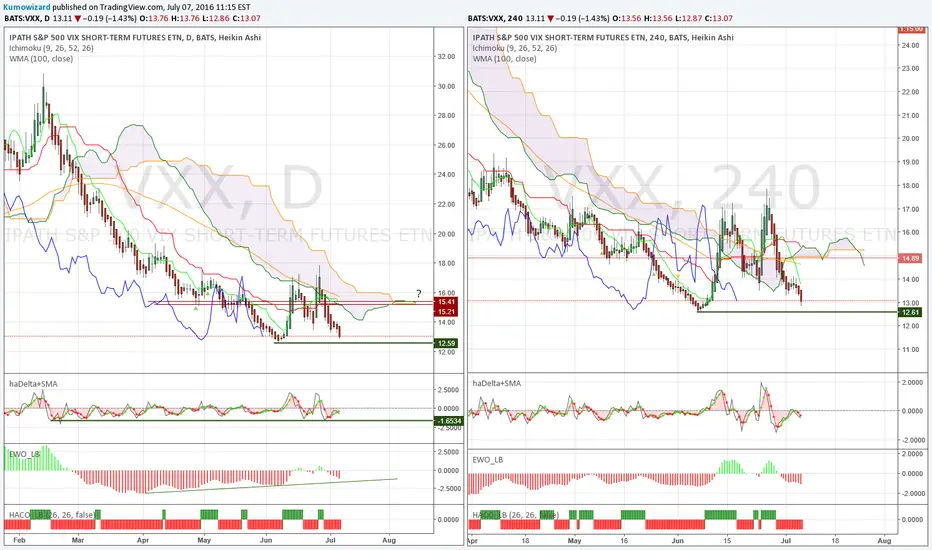
Long in VXZThe VIX (red line) is near 52 its week lows. I went long on VIXM on 7/21/2016. After further research I found that VXZ has higher volumes (more liquidity). VXZ and VIXM do not decay as fast as the leveraged ETFs/ETNs. They also react more slowly, peak more slowly, and fall more slowly then the VIX and the short term ETFs/ETNs. Looking further back in time, shows that shows that VXZ and VIXM gradually decay over time. I do not understand the cause of this as they are not rebalanced. Perhaps there is a gradual loss of faith in them as a FIAT marker for the VIX (anyone who knows the correct reason, please comment/enlighten). Going long at 52 week lows may reduce the risk of medium term holds on this long position. This is a also a good black swan position. I am considering adding more long positions via VXZ.


Bearish, with divergences. May get some pull back (vol. pickup)Weekly:
Simply bearish. Anyway, it is the nature of the long volatility Fund. Those who hold it jave to pay the money managers' fee and more importantly the continous roll down caused by VIX futures contango.
Weekly chart can go bullish only if we once ever have a krach in SP500... but as we know that is absolutely impossible with new type of central banking ;-) :-D
Daily:
- Ichimoku is bearish, but price moved quite far away from its equilibrium level (currently marked by Kijun and Senkou B at 14,75)
- Heikin-Ashi has important message! haDelta/SMA3 has built quite remarkable bullish divergence! It is still below zero line, but ticking higher, while price still made lower low. Probably the bearish price action in last few days happene on low volume, which means Bears are not so keen on selling heavily at these levels.
Candle last friday had small inside body and both upper and lower wicks!
- Bearish supp at 12,80 (Tenkan) and 14,70 (Kijun+Kumo)
4H:
- Ichimoku is bearish, but just like on the daily, Price is toofar below equilibrium levels.
- Heikin-Ashi signals indecision / consolidation. haDelta/SMA3 back to zero, has built positive divergence.
I think volatility has chance to pick up a bit. We can do small bottom fishing here, but don't expect huge rally in VXX. In case your own system confirms, you can go long with maximum 0,5 unit.

Update on VXXVXX reached previous bottom. If it holds, then we'll have chance for a double bottom.
Still watching. Candle close will be important.
p.s.: I do really tiny bottom fishing here. Equity indexes ($ES and $NQ) also reached important resistances.

Hey Vol. sellers, can you make a lower low? If not...For now all bullish forces are in play to push volatility and VXX lower. I know it looks bearish now on both time frames, but let me make few notes.
- Daily Kijun and Senkou B are flat, making an equilibrium around 15,21. No real bearish trend continuation until these longer averages do not point down again.
- Tenkan is still slightly above Kijun, both lines are in the Kumo cloud
- EWO is bearish, but it has been building a positive divergence since April! This triggered nice spikes twice already.
- Heikin-Ashi is bearish now.
The questions:
Can price make a lower low on close?
Can haDelta reach or dip below its lower range of -1,65?
Can forward Kumo cross bearish?
For earlier answers given by price action, we'll also have to keep an eye on 4H time frame.
I'll try to post any relevant changes, and also if I see a better risk/reward setup to enter long.
More trouble ahead! Pull back to 15 - 15,50 can be a buy!Ah, just after three days selling in SPX, and here come the prema bulls telling us why it is again, for the third time this year is a "life time buying opportunity" .... well, it is... just probably not in SP500, but in the VXX volatility ETF! :-)
I see more trouble ahead. Here are the technical signals:
Daily:
- Ichimoku setup is still neutral, but WATCH forward Kumo twist --> Bullish Senkou cross! Bias is bullish. Chikou Span (lagging line) is above past candles -> weak bullish. Tenkan/Kijun -> weak bullish
- Heikin-Ashi is bullish
- EWO back to bullish zone
4H:
- Ichimoku setup is bullish. EWO is bullish.
- Support zone is 15,00-15,50
- Heikin-Ashi shows some loss of momentum, price may retest to 15,50 +/- support today or tomorrow.
In cae of a retracement, look for buy signals in the blue rectangle zone!


VXX daily - watch the blue resistance - 6/24/2016It closes the day above 50 DMA and right under the blue resistance. A breakout can quickly send it to $26 area.

I know market decided UK will stay. But what if they don't? Seriously I do not understand how markets can be so much sure about these polls, and pricing out even the smallest chance that finally Brexit happens. Again, I don't say it happens for sure, but I don't think it is a wise thing to smash volatility down 2 days before the vote!
Daily:
- Price back tbelow Kijun. (Tenkan and Kijun stay together) but haDelta and candle shows selling started to lose momentum
- Lower key is 14, upper key is 16 and 16,85
4H:
- Price dipped back to neutral Kumo, while Tenkan/Kijun and forward Kumo is still bullish.
- Heikin-Ashi signals loss of bearish moentum short term. haDelta hit extreme low yesterday.
- I suggest small buy here, and more if price moves back above Kijun -> 15,00+ / Stop loss 13,95
Markets are underestimating risk! They may be right, maybe nothing bad will happen, but it is a gambling this way. I rather buy some protection.

VXX - Love Affair between VXX and 21 DMA!Every time VXX closed above 21 DMA, market turmoil hits up!
This time couple of strange things are happening as well:
1. US Market just pulled back 2% and VIX fired up 80%!
2. VIX is at ~$21 and S&P500 at ~$2080 ( VIX is too hot)!
3. Volume is not too high!
4. US has decoupled from rest of the world while they are down 20% From All time High, US is down just 3%!
*** Conclusion, I believe the big boys know more (actually earlier) if something really bad may happen. It would be wise to protect your portfolio or sit on the sideline.****
BTW, I am wondering how high VIX would go if S&P500 breaks that $2040 level to the downside!


VXX - Remember the GREXIT last year. Buy some protection!If BREXIT wins, we will get into a bumpy market!
Yet, market sellers don't have the momentum and I am not convinced to be fully bearish!!!

VXX - FED got a huge BAT when it comes to VOL!I have adjusted my VXX target from 15 min chart to Daily chart!
And have stop loss at $13.20 to secure some profit in case market goes haywire !!!

VIX - FED is slamming the VOL!FED is supporting the market. Short VXX; beside FED, contago is killing it!

No fear at all. Not yet. Key reversal zone lower.Not much to comment here. Market is Uber bullish, there's no fear at all... at least in US equities.
Very strange, that 3-4 weeks before Brexit vote, FX priced in quite remarkable risk premium through short term options implied volatility, while the stock markets (in general) completely ignore any risks, at least for now.
Which market is pricing correctly? FX or Equities? Or maybe FX is overpricing risks, while Equity markets clearly undervalue it? I don't have the clear answer, but I can answer your question when to buy VXX (SP500 short term volatility).
1. You can try small bottom fishing with tiny longs, IF you see some form of Heikin-Ashi reversal on daily
2. You have to buy larger size, IF price breaks through the key bearish support zone, which is now the 14,90-15,40 range.
Regarding SP500 and VXX, I actually see more bearish risk factors:
- Brexit
- China
- OPEC meeting with disappointment and WTI selloff
- FED hawkish tone -> rates ticking higher -> USD stronger -> more liquidity tightening
- Decreasing trend in Corporate earnings + profit warnings
- US election
In my childhood I was told "It is better to fear (too early), than to get (suddenly) scared!"
Keep your eyes open!
volatility etf with yeller speak ecb and payroll this week short term move possible to bottom of the cloud daily/rate hike in june or july not built in/europe and payroll next week /volatilyioversold/look for volatility to come on/enter on one candle your time above close/use a tight stop/this etf moves quickly with vix/diversify and use small position/yellen words not heard well because of long holiday fomc on the 15th/dollar moved up

ROLLING JUNE 17TH, JUNE 24TH VXX PWCC SHORT CALLS OUT ... .These short calls are both parts of poor man's covered calls (PWCC's) in VXX, the long-dated long calls of which are in the September expiry ... .
The June 17th 18 call had lost over 65% of its value, so I opted to roll it here to the July 8th 15.5 short call (as close to the 75% probability out-of-the-money strike as I could get) for an additional $68/contact in credit.
Similarly, the June 24th 18 call had also lost over 60% of its value, so I rolled it to the July 15th 16 short call for an additional $56/contract in credit.
Although it's great to be collecting credit along the way, as with any covered call -- poor man's or otherwise -- you will need price to increase above your cost basis to bail on the trade profitably ... . At the moment, I'm looking to exit the current setups for what I originally paid for them, essentially keeping the credit collected as my profit. However, as we near that September expiration (it's still a bit of ways away), I may have to look at what my scratch point is for each and possibly settle for less if we don't see a pop soon here ... .

VXX - Short with both hand!FED is in control, at the moment, so VOL will just make bear indices like VXX to bleed!

(S&P Down) VXX long opportunity comingVXX flat out price, escalating volume, RSI divergence, all suggesting S&P dive near.

VXX - Short the vol on any pop!VXX formed a bear flag.
Breaking down would give a good shorting opportunity!
