VXX Bearish inclined Naked Calls 11 Mar Expiry (Mar Track 1)Whats The Plan/Trade/Thought
I entered this position as I believe that we are currently in a sideways bearish situation. The markets took huge dips since late Nov to Jan and while it has recovered some of that loss. The S&P and especially the NASDAQ show that at least for now, the constant bold bullish days are narrowing
Even though I am taking a sideways bearish stance. I still sold calls as we have just gotten out from a terrible 3 months of nose bleed drops and I think there will be some respite where market participants will try to determine what is the next direction
Writing calls also allow me to develop a hedge on the other trades which will be bearish
I Feel
I entered this trade on Monday and it feels almost clinical as it was already part of my plan and the indexes were aligned
I would have liked to get a better price to weather some potential volatility but it is a decent price at 0.71
I would have also preferred to have this trade expire on the 4th March way before the mid March inflation implementations
Imagine Yourself Taking The Other Side
I would be slightly worried as the market in the past 2 days have been bullish.
Also I did try to initially take a sold PUT trade, but the prices for them and the % from strike were not optimal. I guess the market expects more bullishness?
Imagine Yourself As A Neutral Observer
VXX eats alot of margin fast as it is also a reflection of the tech stocks. And that could limit the fund’s movements.
Regardless of direction I think with a good 63% of space between the entry and strike is prudent
Look For New Information
I am accepting that if the market does furiously dip too fast and too hard. I might be in a difficult position. The good news is that the major Tech earnings are over.
How Do I Feel Now
I neither feel happy or worried. Just somewhat clear but edgy given what we have just gone through in Nov - Jan
Trade Specs
Sold 125 Calls @ 0.71 - Strike 33
% to Strike 63%
ATR 64%
BP used is 91k
Max Gain: 8875
ATMP trade ideas

Probably gonna boom.Same highs, higher lows, stock maybe boom. Won't let me publish unless I say more, uhh, it's broken the huge resistence line that acted like a brick wall for the past 2 years.

VXX Strangle Spread ManagementStarted with monthly VXX Strangle 2 strikes wide. As volatility kicked in, sold off the profitable trade (a put) and then used the rest of the time to allow the bearish sentiment to kick in. the problem was a lot of times the option would be reach ITM (In-The-Money), but I would hedge by tightening up the strangle by adding another put once the direction changed. Recently volatility has slightly tamed compared to when Russia initially attacked Ukraine. Using support and resistance levels including price-action to confirm entry and exit points. Using MACD, Stochastics and RSI to guage the sentiment whether it's bearish or bullish.
Tightening the Strangle
Once the trend reverses, I purchase the other side of the Strangle once the Put-Call ratio is favorable and there are discounts in the options prices (Black-Scholes Model).
In February there was very high volatility which led to better chances for profitability.
Technical Analysis
Always wait for engulfing candles with a confirmation candle or two to spot a trend reversal.
Verify this reversal with resistance levels and breakouts in the RSI.
Stochastics can be used to view the short-term sentiment.
Update - 03-03-2022
Volatility has slowed down so much more patience is needed for the options to go in-the-money. Due to this uncertain investment and political climate, there could be chances for volatility to spike again. Either way, using a Strangle, we just want a strong move either to the upside or downside.
General trend for the past 3 days is a bearish trend with no breakouts yet. Tighten the Strangle once direction changes and options prices get cheap.
Lessons Learned
Sometimes you have to wait for the trade to move in your favor.
It's always better to purchase discounted options.
Tighten the strangle when it is cheaper to do so and the trend is moving in its favor.
Delta and Gamma combined help shape the rewards better than the Put-Call ratio only.
Wait for the technicals in the chart to trigger entry points.
Always get options with more time than you think you need. Sometimes it takes more time than predicted to minimize losses and be profitable in the long-run.

Increase in VOLATILITY on the horizon? It's 1120am MST on 2/28, and I am expecting a further market decline. I already have a VXX call option in play right now and am expecting this position will end up in the money.
It seems Russia/Ukraine war is starting to heat up despite the meeting between the two countries today.
From a technical analysis perspective, there is another inverse head and shoulders forming and the 50 SMA is crossing over both the 100MA and 200MA, which seems to be a bullish indicator for VXX and a bearish indicator for the stock market as a whole.
I hope I am wrong on this one...because that would indicate a de-escalation of the war...which we're all praying for.

VXX Bearish inclined Naked Calls 11 Feb Expiry (Feb Track 1)Whats The Plan/Trade/Thought
Market seems to be ranging with deeper drops. This VXX trade is positioned as a hedge as it takes a bullish market stance. I like this structure of having a broad market hedge and especially a position that expires early in the month. As I would still have a solid feel of the previous month’s sentiment.
VXX seems like a good trade for early month as the BP drops drastically as it gets closer to expiry. If price goes against you, the expiring previous month’s trade will release BP to support it.
VXX contracts sometimes also have good premium as it spikes more during volatility events
For Feb’s VXX entry I will wait until 12 Jan after Jerome Powell’s speech. As that could spike the premiums and provide more visibility on the market direction.
I Feel
I feel confident on the trade and especially how it fits into the entire trade structure. Taking advantage of the entry and exit timings and the nature of VXX and it’s BP behaviour (It reduces drastically in size, closer to expiry).
Imagine Yourself Taking The Other Side
VXX is also good as it is a market wide counter. Only worry is that it is exposed to the volatility of tech
The Omicron news on the 26 Nov drove the price up by 47% to $30, while it did fall after 6 days. The recency and the potential for VXX to increase in a Black Swan event is also a potential and the BP requirements to maintain would be extremely large
Imagine Yourself As A Neutral Observer
I don’t expect another super volatile Black Swan event happening in the next month. Especially since knowledge on Omicron and the Fed’s inflation mitigation actions are clearer. But the market movements from Omicron in Dec really scared me and I need to see how I can better shield myself
Price is steady downtrending
Look For New Information
While Omicron has mild symptoms, the high infection rates are hitting businesses even harder because there is a direct impact on labour which are the legs for most businesses. I wondering how this will impact Q1 earnings
How Do I Feel Now
I feel confident and worry free
Trade Specs
Sold 123 Calls @ 0.63 - Strike 29
% to Strike 62%
ATR % is 67%
BP used is 89k
Max Gain: 7749

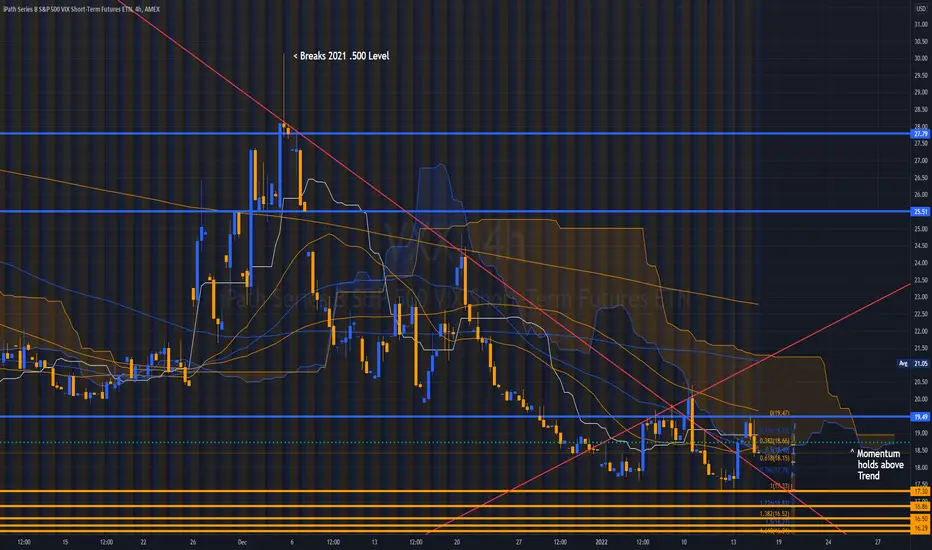
VXX - At crossroads
Up against the trendline resistance that has acted like a wall going back to March 2021.
Break on either side should mark a key direction change in the market.
If it can't move above 24.31 soon, growth stocks and indices will rally (atleast for a short time)
Takeaway: look for bearish signal on 4H before flipping side. Trend break shou ld present great long opportunities.

HEDGE your BTC and ETH positions... VXX is about to MOON?!!!In my opinion, buying a VXX weekly call option is an amazing way to hedge your crypto portfolio against the market volatility resulting from geopolitical and macroeconomic concerns.
Unless you live under a rock, you've reeceived incessant push notifications regarding the Russia/Ukraine geopolitical conflict and the inflation-driven macroeconomic concerns.
Smart money has already reallocated a sizable percentage of portfolio into stablecoins or cash... But why not CAPTURE ALPHA available from the current market volatility?
Inverse head-and-shoulders patterns are used by some traders to call a downtrend reversal. It's not always a reliable indicator. However, it's my belief this indicator is MORE reliable on the with VXX chart- which is perpetually in a long-term downtrend.
Look closely at the VXX chart, and you'll see TWO inverse head and shoulders patterns:
1. One forming locally over the past couple weeks
2. One that started forming at the end of January
I bought a weekly call option expiring on 2/25 with a strike price of 24. With a target of around 26.50, I'd be shocked if I didn't close this position, or have it expire, IN THE MONEY.
Do YOU AGREE or DISAGREE? Let me know in the comments!

VXX - Expect short-term drop!-VXX is dropping in the short-term window, this week SPY might have some bullish movement on it.
-As we get closer to next month, probably we will see some more blood, so VXX definitely has only 1 week to drop.

Long UVXY and VXX Trading Strategy IdeaThis is for going long UVXY or VXX.
I am fine-tuning on systematic approach to trading long volatility. I have back tested the rules below with great results! Please comment and share your thoughts. I traded this several times recently and have done well with it. It is fade-it or half-life approach; decaying position or reverse pyramid, since the underlying is decaying. Take a look at the chart; arrows indicate recent entries AMEX:UVXY .
CHART SETUP
195 minute bar chart (split the day into two bars)
RSI set to 2 periods
MACD - set to 2, 6, 1. (essentially a Moving average cross over)
Stochastics Full. 13,3,3
EMA 5 and 8 day EMA.
Bollinger bands -standard settings.
TTM Squeeze
BUY RULES
Buy Full position when:
- MACD crosses from red to green - above zero line AND
- bar close is higher than previous bar AND
- Stochastics are trending higher AND
- RSI(2) has crossed or is greater than 70 AND
- VXX/UVXY price is below the upper bollinger band AND
- VXX/UVXY is above the 5 period EMA
SELL RULES
- 4.1% stop upon entry
- sell entire position of MACD 2,6,1 closes red on the day.
- sell 50% position on first bar/price trading above the upper bollinger bands
- sell 25% of position on second bar/price trading above the upper bollinger bands
- sell remaining 25% position upon hard MACD sell signal or discretionary.
REPEAT:
- repeat and refill full position. For example, if you are down to final 25% position and VXX/UVXY crosses from below to above 5 EMA AND MACD is still green AND price is below upper bollinger band, AND bar close is higher than previous bar close, buy back to full position. Repeat sell rules.
Notes:
- if you miss a sell signal, sell the bar. for example, VXX traded above the upper BB briefly then below, sell the respective portion of the position.
- you may see several trades back to back in high market volatility
- I use the TTM Squeeze indicator for direction; histogram trending up? is it green?
- This system entry matches up with Heiken Ashi charts buy signals if these are your thing.
- the compounding of this strategy works well with 100% re-investment on each trade.
- long volatility trades are quick and fade fast. occasionally you will see an extended high volatility; this is the reason the for the 25% last part of the position. (I owned TVIX in Feb 2020 and sold it all once it hit +100%, it went up 11x)
- I back tested this to 2016; the results were amazing. in 2021 you had 30 trades, 23 winners, a trade expectancy of 9%, and with 100% re-investment upon every trade, a 783% return if I am doing the math correctly. (rough results below)
- other years had better results (2018) but still validating. (2018 returns look ridiculous)
- I set buy stops above trading prices at where my signals would be met to automate the entry.
- you need some real fortitude as you may take several losses in a row. -4.1, -4.1, -4.1
Again, share your thoughts and comments
2021 UVXY Trades. (Rough backtesting results) starting with 100k hypothetical)
Trade Returns trade profit/loss running percentage Running total of capital
6.52% 6,520.00 6.52% $106,520.00
15.56% 16,574.51 23.09% $123,094.51
16.06% 19,768.98 42.86% $142,863.49
-4.10% -5,857.40 37.01% $137,006.09
12.82% 17,564.18 54.57% $154,570.27
14.33% 22,149.92 76.72% $176,720.19
4.00% 7,068.81 83.79% $183,788.99
-2.88% -5,293.12 78.50% $178,495.87
3.66% 6,532.95 85.03% $185,028.82
2.80% 5,180.81 90.21% $190,209.63
-4.10% -7,798.59 82.41% $182,411.03
16.76% 30,572.09 112.98% $212,983.12
-4.10% -8,732.31 104.25% $204,250.81
3.66% 7,475.58 111.73% $211,726.39
12.02% 25,449.51 137.18% $237,175.91
10.66% 25,282.95 162.46% $262,458.86
22.19% 58,239.62 220.70% $320,698.48
17.91% 57,437.10 278.14% $378,135.58
-1.05% -3,970.42 274.17% $374,165.15
6.14% 22,973.74 297.14% $397,138.89
-4.10% -16,282.69 280.86% $380,856.20
22.23% 84,664.33 365.52% $465,520.53
6.22% 28,955.38 394.48% $494,475.91
6.73% 33,278.23 427.75% $527,754.14
8.80% 46,442.36 465.40% $574,196.50
11.67% 67,008.73 519.71% $641,205.23
11.23% 72,007.35 578.07% $713,212.58
10.69% 76,242.42 639.87% $789,455.00
-4.10% -32,367.66 613.63% $757,087.35
16.14% 122,193.90 712.67% $879,281.25

long vxxLooks like the market is becoming more bearish could see the price move up to next line. Trade safe

VXX - into a trendline resistanceNotice how technical setup precedes any news? VXX pulled back into the trendline resistance yesterday with negative divergence on the 30Min TF.
Next couple of days will be important to decide if we go way down or way up. Either is fine by me, but patience is needed to see the picture clearly before going too deep.
Plan today: reduce size of the shorts or cut losses. Watch hourly price action around 23...if it pushes lower, start small on the longer dates SPY, QQQ calls.
Risk: Daily charts for many charts are still showing bearflag signs...if there is no follow through, this would just be another dead cat bounce. need ES! to consolidate above 4450 for the chance at 4500, 4580.

VXX (VIX ETF) hints of increasing volatilityThe VXX is the VIX ETF and tracking it gives an idea of the VIX from a unique perspective. In the weekly chart, for most of 2021, there was a building MACD bullish divergence.
Given the higher low and the rather full bullish candle on Friday, any continuation of this rally aligns price to the indicator. Inadvertently, the would be downside volatility in the equity markets to follow...
The VIX, via the VXX ETF, is suggesting a plausible spike in volatility in the coming weeks.

Bounce on .5 Fibonacci ExtensionThe SPX & VXX both bounced from the .5 Fibonacci extension and retractement on daily time frames. Monday will be interesting with the Ukraine situations + Emergency FED Meeting results. I can see it going both ways unfortunately but the trend says we find a lower low. My gut tells me a no deal no info meeting through the weekend on Ukraine, and more accommodations from the fed because of Ukraine. These conditions could send the vix higher in the short term, we could finally see the sell off breadth we’ve been waiting for to call the bottom. Engulfments everywhere on the weekly’s charts look terrible. And the setup looks bullish to me on the VXX.

Vxx long Candle & moon star is a sign of strong sell to $15.65VXX long candle sold off as moon star candle is sign of strong sell and end bullish signal as Russia Ukraine tensions will reach diplomatic solution this weekend which will reach new support new support level to $15.65

$vxx - headed straight for $30vxx flagging here. took the length of the flagpole, applied it to where we have broken out.
spy is weak, this doesnt look good.
next few weeks will be gnarly.

VXX - 1H channel requires patiencelet the dust settle to see the picture clearly. I can only get long if VXX closes below 22.07

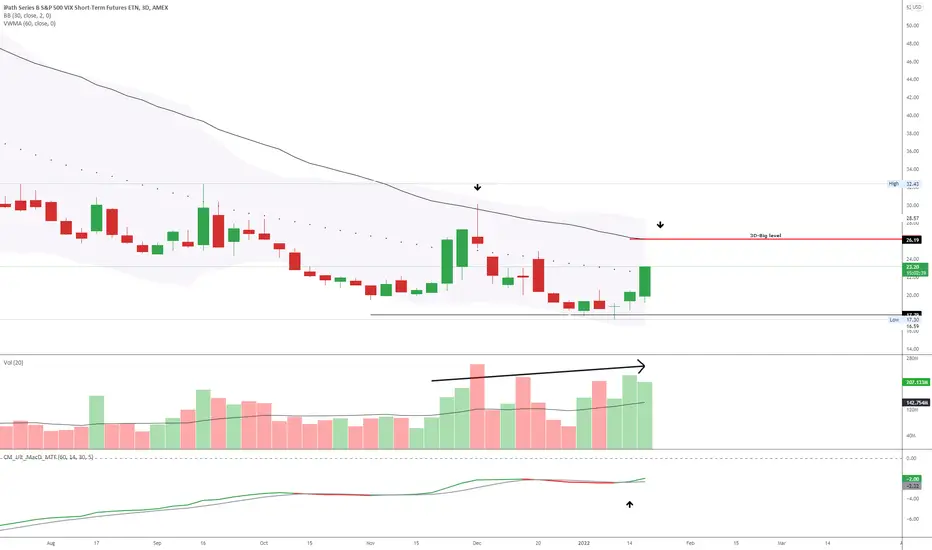
VXX - Key level is next
3D VWMA (60) has been tested only once since Sept 01, 2020 and it retraced on Dec 02, 2021 (market with arrow)
Negative divergence on the price.
All suggest months of pain ahead - UNLESS it is rejected and they keep smashing VXX below 26.
VXXIntraday Report
Looking for a SPY bounce? For that to happen VXX must break below 24.60 support level. A break below will give a good bounce for market.

VXX is my biggest playVXX has two gaps to fill, the highest being at $103. My target is $180 which is where the descending Fib Retracement began and historically where each major upward move returned to.
Not financial advice

VXX: Expecting a potential major moveHistory has a tendency to show us patterns which can make trading much simpler if you know what to look for. As I've said before, we finished a wave 5 of 5 from the bottom of 2009 which to me tells me we are about to head into the biggest recession of my lifetime. Now, I don't pretend to be a fortune teller or foresee the future, but I do tend to rely on the past to better predict the future of the markets. So based on all of this, I have found a pattern in VXX that I found interesting. As the chart shows, during the course of the last 5 years, VXX has made some interesting patterns which shows that around the same point in Fib retracements during the most volatile times since 2017, right before those events VXX sat around the same junction just above the 2.618 Fib retracement level. If this pattern were, to say, repeat itself again, you're looking at VXX returning to the point where the first peak of the downward move began or beyond which would place the VXX at $183. Now I'm sure some of you are looking at this and saying I'm crazy and maybe I am, however, I like patterns and fibs and if there are two things that have proven to be true in the markets its patterns and fibs.
Not financial advice


VXX - Arb Low into New ATL's for 2022 @ 17.30We are buyers of the Implied Lower Targets.
VXX is our preferred Instrument as it is the 30 Day Constant Maturity.
Trade Plan Buys on Inverse Ladder:
18.45
18.01
17.55
17.3
16.58
16.14
15.78
15.42
We'll hold our nose for:
25.24
27.41
28.87
30.05
31.23
32.69
35.06
VXX - 4 Hour / 17.55 LostRetest Lows and fail appears to be in trade into Friday.
VX Complex is being taken to the Woodshed again.
No reason to Buy, no real reason to Sell.
________________________________________________
Meandering.
Wandering.
_________________________________________________
Low to Low Draws is becoming a horror show.
