VXX about to popUS dollar index is rising overnight. S&P was rejected at 3800 and on the way down since, futures see m to confirm the trend.
VVX has been looking for a bottom, while stock squeezes in GME and AMC could catalyze further volatility. Large scale rotation out of tech stocks will add to the volatility, especially if the recent uptick was a bull trap.
Yesterday's rise was accompanied by a drop in short term interest rates, and a turnaround in the trend of the dollar index. Chicken or egg?
ATMP trade ideas

VXX Showing Indices Are Likely To Head HigherVXX tried to push up for the 4th time on March 4th and put in a climax buy bar.
Price broke below that climax buy bar yesterday and now price is set to head
lower. Looks like it might go and try to test the low of January and February
of last year around 13.75.
This is good news for the indices as prices are more likely to head higher.
Also, just read that a Deutsche Bank survey said that 25-34 year olds will be
spending HALF of their new stimulus checks on stocks. Other age groups said
they would allocate 35-45% of their check on stocks.
Looks like we're going higher at the moment. New bars on the chart can change that
probability so we'll see.

Roll premium ... No HODL'ingBe aware of the cost of roll premium...HODL doesn't apply!
In this game its about 'timing the market', not 'time in the market'

VXX TradingAs VIX is starting to set up a triangle pattern, We can think that it could explode because market uncertainty. For that reason I invest in long VXX.


Feb Hedge: VXX Puts - 19 Feb expiryFebruary's Hedge Trade
This trade hedges TOL my secondary trade which is riskier as it was strategically structured to be the opposite of the border market movement. Hence if PG surges this should mitigate the loss.
It is 15% of the premium from Feb's Primary and Secondary trade. If things go well I should not need to cash this at all.
Bought 10 Puts @ 1, Strike 15
It requires an est -14% drop to reach the strike

VXX - Little More Red in the MarketsTook a small profit on the VXX this morning after spotting hidden bullish divergence in the VIX yesterday evening. Opened a small position again on the pullback to support in anticipation of a small bounce the upper trendline of this descending sedge pattern. Holding off on opening long positions until this burns out tomorrow AM. LONG VXX SHORT market.

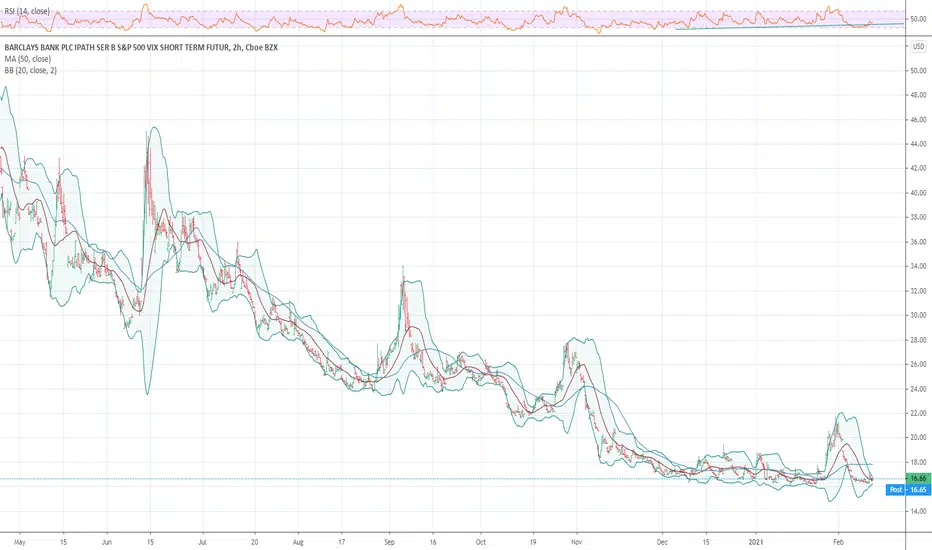
VXX back to January 2020 levelsJust an update on how the VXX has slowly worked its way down and is now back to the same levels as January 2020.
If you look at the RSI levels, the is a higher low pattern that emerges before a spike. It looks like the same thing is starting to appear again.

VOLATILITY TIME TO GO LONG CHART POSTED IS A SIGNAL SETUP FOR A RUN UP IN VOL LOOK FOR A VERY FAST RALLY
VXX $16.25 / TIME FOR MARKET CORRECTION PROTECTION0. Notes to follow;
1. Time for correction protection, if you are leveraged, or can't for whatever reason handle a 10 to 20 percent back draft;
2. More notes after close;

VXX Long In downtrend Wedge,
at support line.
Prepare for SPY Gap Down.
Entry 16.5
Stop 13
Target 40
I created a tool "MM_SMA_Swing" to draw swing in tradingview chart.
Each swing must cross SMA50.
This tool could help to draw trendline, and ignore the noise.
I am not a PRO trader. I trade option to test my trading plan with small cost.
The max Risk of each plan is less than 1% of my account.
If you like this idea, please use SIM/Demo account to try it.


Long VXXDon't sleep on volatility. Bullish divergences extending from Nov 2020 are primed for an explosive move higher.


Short the Vix through VXXThe vix had a flare up from the mass confusion and frenzy caused by the huge short squeezes on AMC and GME. That is going to die down and continue to subside.
As this subsides, the vix, a.k.a. the Fear Index, is going to steadly decline. Short the vix. VXX is a good investment vehicle to play the vix through.


VXX, Long hedge posistion Here is my take on the VXX which I longed as the QQQ broke its upward channel support trendline and spy , which already broke its channel support, made lower lows .
Good luck ~

VXX spiked todayVXX spiked today obviously.
Do your own due diligence, your risk is 100% your responsibility. You win some or you learn some. Consider being charitable with some of your profit to help humankind. Small incremental steps work : If you double a penny a day for a month it = $5,368,709. Good luck and happy trading friends...
*3x lucky 7s of trading*
7pt Trading compass:
Price action, entry/exit
Volume average/direction
Trend, patterns, momentum
Newsworthy current events
Revenue
Earnings
Balance sheet
7 Common mistakes:
+5% portfolio trades, risk management
Beware of analysts motives
Emotions & Opinions
FOMO : bad timing
Lack of planning & discipline
Forgetting restraint
Obdurate repetitive errors, no adaptation
7 Important tools:
Trading View app!, Brokerage UI
Accurate indicators & settings
Wide screen monitor/s
Trading log (pencil & graph paper)
Big organized desk
Reading books, playing chess
Sorted watch-list
Checkout my indicators:
Fibonacci VIP - volume
Fibonacci MA7 - price
pi RSI - trend momentum
TTC - trend channel
www.tradingview.com

VXX prediction for next pop. Notice the pattern. Down-wedges followed by a pop. The angles of the wedges are all very similar. The pops are also similar with 2 pops to around $50 and last pop to $78 (due to covid) .
Various time/$ measurements are shown including:
1. Top ones (light blue): the range of the pops.
2. Bottom ones (blue and pink): The range of pop-end to beginning of next pop.
NOTE: The last cycle is not complete, so an overlapping blue and pink are shown corresponding to previous to see if they give any info. We are close to the blue on x-axis (time) so if a pop happens NOW, we would correlate cyclically. Would be great, but can only confirm with hindsight.
Brought out time cycle bubbles (green) to see if any more predictive patterns emerge. Not at very top of chart the arrow icons. These correspond to intersections of the SMA (smoothed moving average = orange line) and the ends of the green cycle time bubbles. The green arrows imply that they line up nicely. The orange arrows do not correlate to a big pop (but there was a "small" pop (50%, small not small!) hence i put orange instead of red).
Going to the last cycle which isn't complete, we place the question mark (purple) to see if the SMA will peak here. If we assume this pattern could be something, we would expect price action preceding the question mark to cause a dramatic rise in price to change the trajectory of SMA to form a peak. 1st and 3rd "pops" lasted about 30 days. The 2nd "pop" lasted about 90 days. The next cylce time (green bubble) ends 2/15, so we have roughly 100 days left.
SO.....this sucker should still pop (if these "patterns" mean anything. And it should be a good one (to create SMA peak). And it should be relatively "soon" (for position traders and some swing traders).
Caveats: This is not a great "stock" for day traders. This is not a great stock for position traders either, as there is a natural decay and this is a loser if held for too long. The is probably best as a swing trade and a hedge against market with plan to hold on until there is an exit or around 100 days. (by then election drama and hopefully covid drama will have also dissipated and hence if nothing happens by then it would make sense to abandon this play and cut losses.
If anyone has any insight as to a new bottom for this latest cycle please do share. Considering some price averaging, but i'm a bit gun shy now watching this one slip......


VXX and EquitiesVXX (Volatility Index) is starting to show bullishness which means volatility could pick up.
If VXX successfully breaks the rectangle, we can expect wild swings that could happen in equities (NASDAQ, SP500).
Prepare for downside if ever that happens for equities.
